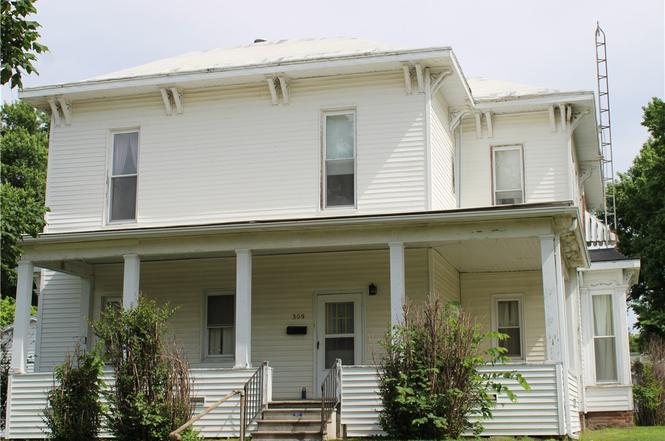
309 W South 1st St · Shelbyville, IL
Flood risk 1/10 · Minimal
- FEMA flood zone
- —
- Chance of flooding over 30 yrs
- 0.0%
- Est. flood insurance / yr
- —
Fire risk 3/10 · Minor
- Est. fire insurance / yr
- $804 – $1,492
Heat risk 4/10 · Minor
- Hot days now (above 105°F)
- 7 days/yr
- Hot days in 30 yrs
- 20 days/yr
Wind risk 2/10 · Minimal
- Chance of severe wind over 30 yrs
- 2.0%
Air-quality risk 2/10 · Minimal
- Unhealthy air days now
- 1 days/yr
- Unhealthy air days in 30 yrs
- 2 days/yr
Risk factors via First Street. Map © Google.
Why this score? — see what drove the B grade
The composite is a weighted blend of 9 inputs, each scored 0–100. Each bar is that input's sub-score; the figure is the points it added to the 100-point composite (weight × sub-score).
- Cash flow +30.0/30.0
- ARV discount +10.6/15.0
- 1% rule +10.0/10.0
- DSCR +10.0/10.0
- Livability +3.5/5.0
- Schools +2.8/10.0
- Rent growth +2.5/5.0
- Condition / age +2.5/5.0
- Appreciation +0.0/10.0
$79,900
🖨 Deal sheet 📄 Offer letter ✓ Due diligence
Listing remarks
Step into a home full of character, charm, and endless possibilities. Currently configured as a single-family residence, this spacious two-story property offers the potential for conversion into a multi-family home with the right vision and improvements. The inviting open front porch creates a warm first impression and is the perfect place to relax and enjoy the neighborhood. Inside, the main floor features a large living room, family room, dining room, kitchen, laundry room, and a main-level bedroom with a full bathroom — offering flexible living arrangements and convenience. An enclosed side porch provides excellent additional storage space. Upstairs, you’ll find four large be
Key facts
- Enclosed side porch
- Spacious backyard
- Open front porch
Tags
Property features AI
Exterior
- Parking: Detached 2-car garage
- Utilities: Public water; Public sewer
- Home design: Single-family residence; Two stories
- Construction: Vinyl siding; Rubber and shingle roof; Built with a crawl space foundation
- Exterior features: Asphalt road access; Front porch
Interior
- Kitchen: Range; Refrigerator
- Bathrooms: Two full bathrooms
- Heating & cooling: Natural gas forced air heating; No central cooling
- Interior features: Two fireplaces; Unfinished, partial crawl space basement; Accessible entrance; Front porch
- Laundry & utility: Laundry on main level; Gas water heater
Neighborhood map
What this means for you Summary
Snapshot
- This is a 5-bed/2.0-bath single-family listed at $80k.
Deal economics
- At list price, monthly cash flow is $511 ($6k/yr) — positive.
- The deal already cash-flows at list — no discount required.
- Meets the 1% rule at list price ($1k rent vs $80k).
- Recommended offer: $79k (1.5% below list) — sets the bar for market timing.
- Cap rate 14.0% vs local median 5.0% in Shelbyville — top-decile yield for the area; either an underpriced asset or a hidden risk that comps aren't pricing in. Stress-test before assuming the spread holds.
Location & tenants
- Location reads 70/100 on livability (#355 in IL) — a middle-class / working-renter tenant base. Strengths: crime A+, cost of living A+, housing A+; Watch: employment D+, amenities F, commute F.
- Shelbyville CUSD 4 (town): math 25% / reading 41% proficiency, ranked #225 of 620 in IL (top 36%) — families likely to look elsewhere, expect single-tenant / working-renter base with shorter leases.
- Market conditions: 53 active listings in the ZIP; 41 units permitted in Shelby County in 2024 (0 in 5+ unit buildings).
Forward outlook
- Local home prices are declining (-3.0%/yr); year-one equity from $552 of loan paydown is wiped out by about $2k of value loss. Plan a longer hold.
- Shelby County population projected at -22% by 2050 — secular population decline; favor cash flow + early exit over multi-decade hold.
- At projected returns (-3.0% appreciation + 3.0% rent growth), your $22k cash investment doubles in ~5 years — after that, you're playing with house money.
Negotiation context
- It's been on market 15 days — a 2% lower offer ($79k) is reasonable based on typical stale-listing flexibility.
Risks & watch-outs
- Watch-outs: built in 1875 — expect roof / HVAC / electrical / plumbing capex.
Questions for the listing agent
- Built in 1875 — when were the roof, HVAC, electrical panel, plumbing, and water heater last replaced?
- Is there a deadline driving the sale (1031 exchange, divorce, estate, relocation)? That informs how much negotiation room exists.
- What's the average days-on-market for RENTAL listings here right now (not sales)? A rising rental-DOM trend means longer vacancies and softer asking-rent achievability than the comps imply.
- What's the recent tenant-quality profile in this submarket — average credit score on applications, eviction rate, late-payment / NSF rate, and stable-employment percentage? A property-management company in the area should have these aggregated.
- How much new for-sale + rental construction is in the pipeline within 1–3 miles? Heavy new supply typically softens prices + rents 12–24 months out; constrained supply supports both.
Investment metrics
- 1% rule
- 1.59% ✓
- Cap rate
- 13.97%
- Cash-on-cash
- 27.43%
- DSCR
- 2.22
- GRM
- 5.3
CMA / ARV
- ARV (on-the-fly)
- $85,800
- Comps found
- 1
Show comp detail 1 sale within ~0.75 mi
| Address | Dist | Beds/Ba | Sqft | Sold | Price | $/sf | Match |
|---|---|---|---|---|---|---|---|
| 514 W South 1st St | 0.16mi | 4/1.5 (-1) | 1,450 (+1%) | 14mo | $87,500 | $60 | 72 |
Match score weights: distance 35% · size 25% · config 20% · recency 20%. Top-matched comps best support the ARV.
Projected returns pro-forma
-3.0% appreciation · 3.0% rent growth · sell at horizon
- IRR
- 21.4%
- Equity multiple
- 1.88×
- Total profit
- $19,606
- Equity at exit
- $11,913
- IRR
- 29.5%
- Equity multiple
- 3.63×
- Total profit
- $58,936
- Equity at exit
- $6,908
Cash invested: $22,372 (down + closing). Projections, not guarantees.
Landlord ↔ Tenant lean methodology
- Overall (STATE)
- 43 Moderately Tenant-Leaning
- State Illinois
- 43 Moderately Tenant-Leaning · D+7
- County
- — inherits STATE
- City
- — inherits STATE
ZIP-level market 62565
- Home prices YoY
- -11.6%
- Active inventory
- 53
- Price-to-rent
- 5.3×
Monthly cashflow live
- Estimated rent
- $1,267 medium interval (Pro) →
- Mortgage (P&I)
- −$419
- Tax from tax record
- −$37 /mo · $444/yr
- Insurance
- −$33
- HOA
- −$0
- Vacancy / Maint / Mgmt
- −$266
- Net cashflow
- $511
Break-even live
UW: 25.0% down · 7.5% · 30yr · 1.5% tax · 5.0% vac · 8.0% maint · 8.0% mgmt
Financing live
Cash to close
- Down payment
- $19,975
- Closing costs
- $2,397
- Reserves months
- —
- Total cash needed
- —
Loan-product check · same deal, 3 products live
Conventional
25% down · 7.5% · 30yr
- Down + closing
- —
- Monthly P&I
- —
- Monthly cashflow
- —
- DSCR
- —
- Eligible?
- —
Personal DTI + credit; lowest rate.
DSCR
20% down · 8.5% · 30yr
- Down + closing
- —
- Monthly P&I
- —
- Monthly cashflow
- —
- DSCR
- —
- Eligible?
- —
No personal income docs; deal must DSCR.
Hard money
10% down · 12.0% · 12mo
- Down + closing
- —
- Monthly P&I
- —
- Monthly cashflow
- —
- DSCR
- —
- Eligible?
- —
Short-term bridge; refi at stabilization.
Listing history 11 events
-
2026-06-16statusdays on market $79,900 Pending 15 DOM
-
2026-06-15days on market $79,900 Active Under Contract 14 DOM
-
2026-06-13days on market $79,900 Active Under Contract 12 DOM
-
2026-06-12days on market $79,900 Active Under Contract 11 DOM
-
2026-06-09days on market $79,900 Active Under Contract 8 DOM
-
2026-06-08days on market $79,900 Active Under Contract 7 DOM
-
2026-06-07days on market $79,900 Active Under Contract 6 DOM
-
2026-06-04days on market $79,900 Active Under Contract 2 DOM
-
2026-06-03status $79,900 Active Under Contract 1 DOM
-
2026-06-01remarks 687-char remark
-
2026-06-01$79,900 Active 1 DOM
ⓘ Source: listings_history table (triggers on properties + properties_extension) + one-shot
backfill from property_details.listing_events for pre-trigger history.
Tax reassessment forecast IL · Partial reset (capped growth)
- Current annual tax
- $444 · $37/mo
- Projected year-2 tax
- $1,129 · $94/mo
- Expected delta
- +$685/yr (+$57/mo · 154.5%)
ⓘ Screening estimate from a state-policy table — verify with the county assessor before closing.
Climate risk First Street
- Flood 1/10 Low 0% chance over 30 yrs
- Wildfire 3/10 Moderate
- Heat 4/10 Moderate 7 d/yr ≥105°F today · 20 d/yr by 30 yrs out
- Wind 2/10 Low 2% chance of damaging wind over 30 yrs
- Air quality 2/10 Low 1 unhealthy d/yr today · 2 by 30 yrs out
Nearby sold comps map
Loading sold comps map…
Walkable amenities ~0.75 mi
Loading nearby amenities…
Taxation est. · year 1
- Rental income
- $15,200
- − Mortgage interest
- −$4,476
- − Property taxes
- −$444
- − Insurance
- −$400
- − Repairs & maintenance
- −$1,216
- − Management
- −$1,216
- − Depreciation
- −$2,324
- Taxable income
- $5,125
- Est. tax owed @ 24.0%
- −$1,230
- After-tax cash flow
- $4,907/yr
For passive investors: Depreciation is non-cash, so a rental often shows a tax loss while cash-flowing — sheltering income. Rental losses are passive: they offset passive income freely, and up to $25,000/yr can offset ordinary (W-2) income if you actively participate and your MAGI is under $100k (phasing out to $0 by $150k); unused losses carry forward. On sale, claimed depreciation is recaptured at up to 25%, and gains may owe capital-gains tax (a 1031 exchange can defer both). Figures are a year-1 estimate at your 24.0% rate — not tax advice; consult a CPA.
Schools (NCES district)
- District
- Shelbyville CUSD 4
- NCES district ID
- 1736090
- Math proficiency
- 25% ▼ -10.00%
- Reading proficiency
- 41% ▼ -12.00%
- Median HH income
- $44,461
- Composite
- 28.1/100
- National rank
- #6827
- State rank
- #225 of 620 in IL
Livability — Shelbyville
- Score
- 70/100
- State rank
- #355
- US rank
- #7321
Category grades
Schools grade is shown separately in the Schools card above.
Census & demographics
- Census place
- Shelbyville, IL
- City population
- 7,422
- Population (ZIP)
- 7,422
Population outlook (Shelby County) Hauer SSP2
- Today (2025)
- 20,512 people
- By 2030
- 19,675 · -4.1%
- By 2040
- 17,851 · -13.0%
- By 2050
- 15,973 · -22.1%
- By 2075
- 11,799 · -42.5%
- By 2100
- 8,030 · -60.9%
Race, ethnicity, and origin ACS 2023
- Neighborhood character
- Predominantly White (97%)
- Race & ethnicity
- White 97% Two or more races 2%
- Common ancestry
- Lithuanian 4% Romanian 3% Slovak 2%
- Foreign-born
- 2% · Canada, South Korea
- Languages at home
- 97% English-only · Russian/Polish/Slavic 2% Spanish 1%
Political lean MEDSL · Shelby
- 2024 margin
- Solid R (+60.2) · D 19.2% · R 79.5% · Other 1.4%
- 2008→2024 swing
- -40.5pp toward R · 2008: -19.8pp · 2024: -60.2pp
- All cycles
- 2024: R+60.2 2020: R+57.2 2016: R+54.3 2012: R+33.7 2008: R+19.8
Not yet ingested
- Civics
- —
Market trends
- HPI YoY
- ▼ -23.35%
- Current HPI
- 178.3002
- Rent YoY
- —
- Metro
- —
- State GDP YoY
- ▲ 1.59%
- F500 in state
- 60
Industry mix (Fortune 500 HQ in IL)
| Industry | F500 HQs | Revenue |
|---|---|---|
| Insurance | 4 | $201B |
|
||
| Consumer Goods | 4 | $87B |
|
||
| Industrial Machinery | 3 | $64B |
|
||
| Healthcare | 2 | $55B |
|
||
| Retail / Pharmacy | 1 | $148B |
|
||
| Agriculture / Food | 1 | $86B |
|
||
Price history
1 event — show timeline
- 2026-06-01 Listed $79,900 CIBR
Property tax history
-1.8%/yrLatest (2024): $444 · -5.1% YoY. Source: county tax records.
Cash-flow waterfall
monthlySold comps — $/sqft
last 12 mo · ≤1 miLoading sold comps…