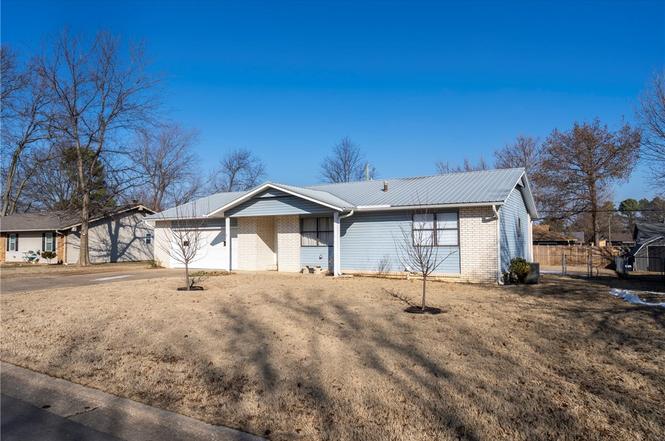
2019 W Tulsa St · Siloam Springs, AR
Flood risk 1/10 · Minimal
- FEMA flood zone
- X (unshaded)
- Chance of flooding over 30 yrs
- 0.0%
- Est. flood insurance / yr
- $507 – $1,088
Fire risk 7/10 · Major
- Est. fire insurance / yr
- $1,499 – $2,785
Heat risk 6/10 · Moderate
- Hot days now (above 107°F)
- 7 days/yr
- Hot days in 30 yrs
- 21 days/yr
Wind risk 2/10 · Minimal
- Chance of severe wind over 30 yrs
- 2.0%
Air-quality risk 2/10 · Minimal
- Unhealthy air days now
- 1 days/yr
- Unhealthy air days in 30 yrs
- 1 days/yr
Risk factors via First Street. Map © Google.
Why this score? — see what drove the D grade
The composite is a weighted blend of 9 inputs, each scored 0–100. Each bar is that input's sub-score; the figure is the points it added to the 100-point composite (weight × sub-score).
- Cash flow +14.8/30.0
- ARV discount +6.5/15.0
- DSCR +4.5/10.0
- Livability +3.7/5.0
- Schools +3.6/10.0
- 1% rule +3.0/10.0
- Rent growth +2.5/5.0
- Condition / age +2.5/5.0
- Appreciation +0.0/10.0
$246,000
🖨 Deal sheet (PDF) 📄 Offer letter ✓ Due diligence
Listing remarks MLS
Beautifully updated 3 bedroom, 2 bath home centrally located near shopping, entertainment and healthcare. Enjoy new luxury vinyl tile flooring in the main living areas, new carpet in the bedrooms, fresh paint, granite counters in the kitchen and baths, a cozy fireplace in the large living room, separate dining area, and a fantastic kitchen with all new appliances. The list goes on so you just need to see this one for yourself.
Key facts
- Gas log fireplace
- Tile flooring
- New dishwasher
Tags
Property features AI
Finance
- HOA & community: Monthly association fee
Exterior
- Parking: Attached garage; Garage with door opener; Workshop space in garage; 2 covered parking spaces
- Utilities: Cable available; Electricity available; Natural gas available; Public sewer; Public water
- Home design: Single-story; Faces south; Residential zoning; Slab foundation
- Construction: Brick and frame construction; Metal roof; Built with slab foundation
- Exterior features: Concrete driveway; Deck; Back yard fencing; Public paved road access; Located in a subdivision; Cleared city lot; Central business district location
Interior
- Kitchen: Dishwasher; Electric range; Self-cleaning oven; Plumbed for ice maker
- Flooring: Carpet; Vinyl
- Bathrooms: 2 full bathrooms
- Heating & cooling: Central heating (gas); Electric cooling
- Interior features: Ceiling fans; Eat-in kitchen; Granite counters; Programmable thermostat; Walk-in closet(s); Window treatments; Double pane windows; Blinds
- Laundry & utility: Washer hookup; Dryer hookup; Gas water heater
Neighborhood map
What this means for you Summary
Snapshot
- This is a 3-bed/2.0-bath single-family listed at $246k.
Deal economics
- At list price, monthly cash flow is $68 ($820/yr) — positive.
- The deal already cash-flows at list — no discount required.
- To meet the 1% rule (rent ≥ 1% of price), the offer needs to be $197k (19.7% below list).
- Recommended offer: $197k (19.7% below list) — sets the bar for 1% rule.
- Cap rate 6.6% vs local median 3.8% in Siloam Springs — top-decile yield for the area; either an underpriced asset or a hidden risk that comps aren't pricing in. Stress-test before assuming the spread holds.
Location & tenants
- Location reads 74/100 on livability (#17 in AR, #4,621 nationally) — a middle-class / working-renter tenant base. Strengths: cost of living A+, housing A+, health & safety A+; Watch: crime D, amenities F, commute F.
- Siloam Springs School District (town): math 44% / reading 40% proficiency, ranked #53 of 238 in AR (top 22%) — families likely to look elsewhere, expect single-tenant / working-renter base with shorter leases.
- Zoned schools: Delbert Pete & Pat Allen Ele (667 students, 62% FRL); Siloam Springs Intermediate School (math 44% / reading 42%, grade D-, #70 of 201 statewide, top 38%, 700 students, 59% FRL); Siloam Springs High School Conversion Charter (math 33% / reading 37%, grade F, #90 of 292 statewide, top 31%, 1,402 students, 49% FRL, charter).
- Market conditions: 371 active listings in the ZIP; 10 comparable units currently listed for rent nearby; rentals at typical pace (median 16d on market — plan ~3-4 weeks tenant-placement turnaround); solid renter incomes; 4,359 units permitted in Benton County in 2024 (402 in 5+ unit buildings).
- This rent runs 31% of the median local income ($76k/yr) — at the standard rent-burdened threshold; future hikes will face affordability resistance.
Forward outlook
- Local home prices are declining (-3.0%/yr); year-one equity from $2k of loan paydown is wiped out by about $7k of value loss. Plan a longer hold.
- Benton County population projected at +56% by 2050 — long-run rental-demand tailwind backs the buy-and-hold thesis.
Negotiation context
- It's been on market 39 days — a 3% lower offer ($239k) is reasonable based on typical stale-listing flexibility.
- 5 sale attempts since 6y ago with the ask held roughly flat each time — persistent listings suggest the price (not the market) is what's stuck; bring a comps-based counter.
- Current owner paid $168k; 47% above their basis — modest negotiation headroom, anchor on the comps not their cost.
Risks & watch-outs
- Climate carrying-cost: major wildfire risk; extreme-heat days projected 7→21/yr by 2055 (HVAC capex compounding) — expect insurance premiums to compound above CPI over the hold.
Questions for the listing agent
- It's been on market 39 days. Have you received any prior offers? Is the seller open to a 20% concession, seller financing, or rate buy-down credit?
- Built in 1975 — when were the roof, HVAC, electrical panel, plumbing, and water heater last replaced?
- Is there a deadline driving the sale (1031 exchange, divorce, estate, relocation)? That informs how much negotiation room exists.
- Schools are D-rated, which usually means shorter tenancies and higher turnover. Who's the typical renter profile here, and what's been the actual vacancy rate?
- Crime grade is D in this area — have there been break-ins, vandalism, or insurance claims at this property in the last 3 years? What carrier currently insures it and at what premium?
- The area grade is low — what's the realistic commute time and amenity access for the typical tenant pool here? Any planned neighborhood developments (good or bad) we should know about?
- What's the average days-on-market for RENTAL listings here right now (not sales)? A rising rental-DOM trend means longer vacancies and softer asking-rent achievability than the comps imply.
- What's the recent tenant-quality profile in this submarket — average credit score on applications, eviction rate, late-payment / NSF rate, and stable-employment percentage? A property-management company in the area should have these aggregated.
- How much new for-sale + rental construction is in the pipeline within 1–3 miles? Heavy new supply typically softens prices + rents 12–24 months out; constrained supply supports both.
Investment metrics
- 1% rule
- 0.80% ✗
- Cap rate
- 6.63%
- Cash-on-cash
- 1.19%
- DSCR
- 1.05
- GRM
- 10.4
CMA / ARV
- ARV (on-the-fly)
- $240,534
- Comps found
- 12
Show comp detail 12 sales within ~0.75 mi
| Address | Dist | Beds/Ba | Sqft | Sold | Price | $/sf | Match |
|---|---|---|---|---|---|---|---|
| 2019 W Tulsa St | 0.00mi | 3/2.0 | 1,494 (0%) | 1mo | $246,000 | $165 | 99 |
| 1990 W Twin Springs St | 0.23mi | 2/2.0 (-1) | 1,484 (-1%) | 1mo | $219,000 | $148 | 82 |
| 2111 W Twin Springs St | 0.27mi | 3/2.0 | 1,624 (+9%) | 8mo | $240,000 | $148 | 66 |
| 313 Rodric Cir | 0.36mi | 3/2.0 | 1,380 (-8%) | 10mo | $172,000 | $125 | 62 |
| 130 Dogwood Pl | 0.61mi | 3/3.0 | 1,521 (+2%) | 6mo | $290,000 | $191 | 60 |
| 2326 Alpine Cir | 0.33mi | 3/1.5 | 1,314 (-12%) | 4mo | $220,000 | $167 | 59 |
| 323 Western Hills Dr | 0.66mi | 3/2.0 | 1,566 (+5%) | 3mo | $252,000 | $161 | 59 |
| 328 Rodric Cir | 0.32mi | 3/2.0 | 1,277 (-14%) | 8mo | $199,000 | $156 | 54 |
| 1008 W Jefferson St | 0.63mi | 3/2.0 | 1,410 (-6%) | 10mo | $235,000 | $167 | 53 |
| 920 W Granite St | 0.66mi | 3/1.5 | 1,380 (-8%) | 2mo | $172,000 | $125 | 53 |
| 1205 Jo Lynn St | 0.61mi | 3/1.5 | 1,296 (-13%) | 10mo | $215,000 | $166 | 39 |
| 1208 Jo Lynn St | 0.61mi | 4/2.0 (+1) | 1,708 (+14%) | 7mo | $235,000 | $138 | 37 |
Match score weights: distance 35% · size 25% · config 20% · recency 20%. Top-matched comps best support the ARV.
Projected returns pro-forma
-3.0% appreciation · 3.0% rent growth · sell at horizon
- IRR
- -14.5%
- Equity multiple
- 0.48×
- Total profit
- $-35,611
- Equity at exit
- $36,679
- IRR
- -5.8%
- Equity multiple
- 0.63×
- Total profit
- $-25,807
- Equity at exit
- $21,270
Cash invested: $68,880 (down + closing). Projections, not guarantees.
Landlord ↔ Tenant lean methodology
- Overall (STATE)
- 92 Strongly Landlord-Friendly
- State Arkansas
- 92 Strongly Landlord-Friendly · R+14
- County
- — inherits STATE
- City
- — inherits STATE
ZIP-level market 72761
- Home prices YoY
- -13.6%
- Active inventory
- 371
- Price-to-rent
- 10.4×
Monthly cashflow live
- Estimated rent
- $1,975 high interval (Pro) →
- Mortgage (P&I)
- −$1,290
- Tax from tax record
- −$99 /mo · $1,190/yr
- Insurance
- −$102
- HOA
- −$0
- Vacancy / Maint / Mgmt
- −$415
- Net cashflow
- $68
Break-even live
Sensitivity live
| Price | -10% $208 | -5% $138 | +0% $68 | +5% $-1 | +10% $-71 |
|---|---|---|---|---|---|
| Rent | -10% $-88 | -5% $-10 | +0% $68 | +5% $146 | +10% $224 |
| Rate | -1.0pp $192 | -0.5pp $131 | base $68 | +0.5pp $5 | +1.0pp $-60 |
UW: 25.0% down · 7.5% · 30yr · 1.5% tax · 5.0% vac · 8.0% maint · 8.0% mgmt
Financing live
Cash to close
- Down payment
- $61,500
- Closing costs
- $7,380
- Reserves months
- —
- Total cash needed
- —
Loan-product check · same deal, 3 products live
Conventional
25% down · 7.5% · 30yr
- Down + closing
- —
- Monthly P&I
- —
- Monthly cashflow
- —
- DSCR
- —
- Eligible?
- —
Personal DTI + credit; lowest rate.
DSCR
20% down · 8.5% · 30yr
- Down + closing
- —
- Monthly P&I
- —
- Monthly cashflow
- —
- DSCR
- —
- Eligible?
- —
No personal income docs; deal must DSCR.
Hard money
10% down · 12.0% · 12mo
- Down + closing
- —
- Monthly P&I
- —
- Monthly cashflow
- —
- DSCR
- —
- Eligible?
- —
Short-term bridge; refi at stabilization.
Rent comps 10 comps
| Address | Beds | Baths | Sqft | Rent | $/sqft | DOM | Units | Dist |
|---|---|---|---|---|---|---|---|---|
| 605 W Benton St Unit C Siloam Springs, AR | 2.0 | 1.5 | 1120 | $1,050 | $0.94 | 16d | 1 | 1.05mi |
| 460 N Garrett St Unit D Siloam Springs, AR | 2.0 | 1.0 | 1020 | $1,000 | $0.98 | 25d | 1 | 1.07mi |
| 2010 S Elm St Siloam Springs, AR | 3.0 | 2.0 | 1566 | $1,750 | $1.12 | 16d | 1 | 1.10mi |
| 703 W Garland St Unit A Siloam Springs, AR | 2.0 | 1.5 | 1220 | $1,200 | $0.98 | 16d | 1 | 1.17mi |
| 111 W Tahlequah St Unit 1520930P Siloam Springs, AR | 3.0 | 2.0 | 1345 | $3,827 | $2.85 | 16d | 1 | 1.33mi |
| 400 E Twin Springs St Unit 1 Siloam Springs, AR | 2.0 | 1.0 | 1000 | $1,400 | $1.40 | 25d | 1 | 1.34mi |
| 413 S Madison St Unit 1520928P Siloam Springs, AR | 4.0 | 2.0 | 1700 | $3,735 | $2.20 | 16d | 1 | 1.34mi |
| 250 N Madison St Unit c Siloam Springs, AR | 2.0 | 1.5 | 960 | $1,095 | $1.14 | 25d | 1 | 1.38mi |
| 426 S Washington St Unit 1520937P Siloam Springs, AR | 3.0 | 2.0 | 1582 | $4,358 | $2.75 | 16d | 1 | 1.39mi |
| 207 E Franklin St Unit 1520952P Siloam Springs, AR | 2.0 | 2.0 | 1119 | $2,901 | $2.59 | 16d | 1 | 1.45mi |
Listing history 15 events
-
2026-05-01status Pending
-
2026-04-12price $246,000
-
2026-04-12status Active
-
2026-03-08status Pending
-
2026-02-26price $247,400
-
2026-02-23status Active
-
2026-02-13status Pending
-
2026-02-02$249,900 Active
-
2020-12-31soldstatus $167,500 430-char remark
Show marketing remark (430 chars)
Beautifully updated 3 bedroom, 2 bath home centrally located near shopping, entertainment and healthcare. Enjoy new luxury vinyl tile flooring in the main living areas, new carpet in the bedrooms, fresh paint, granite counters in the kitchen and baths, a cozy fireplace in the large living room, separate dining area, and a fantastic kitchen with all new appliances. The list goes on so you just need to see this one for yourself.
-
2020-10-14soldstatus $167,500
-
2020-08-31$167,500 430-char remark
Show marketing remark (430 chars)
Beautifully updated 3 bedroom, 2 bath home centrally located near shopping, entertainment and healthcare. Enjoy new luxury vinyl tile flooring in the main living areas, new carpet in the bedrooms, fresh paint, granite counters in the kitchen and baths, a cozy fireplace in the large living room, separate dining area, and a fantastic kitchen with all new appliances. The list goes on so you just need to see this one for yourself.
-
2020-07-15soldstatus $123,500
-
2020-07-13soldstatus $123,500 801-char remark
Show marketing remark (801 chars)
Located in a desirable neighborhood near John Brown University. Nice comfortable floor plan. Three large bedrooms, walk-in closets. Two baths, One full hall bath and master bathroom has shower only (considered 3/4 bath). Big living room with fireplace. Marketing in "as is" condition. Seller cannot make any repairs. Due to needed repairs, this property will not qualify for secondary market mortgage loans, no Conventional, FHA, or VA financing. Buyer will need to have cash or be able to get an "in house" mortgage requiring no repairs to purchase. Needs a number of repairs including roof repair/replacement. Good opportunity for an investor. Has potential for a nice rental property or good for resale after repairs. Seller property disclosure provided in documents on the MLS.
-
2020-06-15$125,000 801-char remark
Show marketing remark (801 chars)
Located in a desirable neighborhood near John Brown University. Nice comfortable floor plan. Three large bedrooms, walk-in closets. Two baths, One full hall bath and master bathroom has shower only (considered 3/4 bath). Big living room with fireplace. Marketing in "as is" condition. Seller cannot make any repairs. Due to needed repairs, this property will not qualify for secondary market mortgage loans, no Conventional, FHA, or VA financing. Buyer will need to have cash or be able to get an "in house" mortgage requiring no repairs to purchase. Needs a number of repairs including roof repair/replacement. Good opportunity for an investor. Has potential for a nice rental property or good for resale after repairs. Seller property disclosure provided in documents on the MLS.
-
1977-04-08soldstatus $34,000
ⓘ Source: listings_history table (triggers on properties + properties_extension) + one-shot
backfill from property_details.listing_events for pre-trigger history.
Tax reassessment forecast AR · Resets to sale price
- Current annual tax
- $1,190 · $99/mo
- Projected year-2 tax
- $1,574 · $131/mo
- Expected delta
- +$385/yr (+$32/mo · 32.3%)
ⓘ Screening estimate from a state-policy table — verify with the county assessor before closing.
Climate risk First Street
- Flood 1/10 Low FEMA zone X (unshaded) · 0% chance over 30 yrs
- Wildfire 7/10 Severe
- Heat 6/10 Major 7 d/yr ≥107°F today · 21 d/yr by 30 yrs out
- Wind 2/10 Low 2% chance of damaging wind over 30 yrs
- Air quality 2/10 Low 1 unhealthy d/yr today · 1 by 30 yrs out
Nearby sold comps map
Loading sold comps map…
Walkable amenities ~0.75 mi
Loading nearby amenities…
Taxation est. · year 1
- Rental income
- $23,696
- − Mortgage interest
- −$13,780
- − Property taxes
- −$1,190
- − Insurance
- −$1,230
- − Repairs & maintenance
- −$1,896
- − Management
- −$1,896
- − Depreciation
- −$7,156
- Taxable loss
- −$3,451
- Est. tax savings @ 24.0%
- +$828
- After-tax cash flow
- $1,648/yr
For passive investors: Depreciation is non-cash, so a rental often shows a tax loss while cash-flowing — sheltering income. Rental losses are passive: they offset passive income freely, and up to $25,000/yr can offset ordinary (W-2) income if you actively participate and your MAGI is under $100k (phasing out to $0 by $150k); unused losses carry forward. On sale, claimed depreciation is recaptured at up to 25%, and gains may owe capital-gains tax (a 1031 exchange can defer both). Figures are a year-1 estimate at your 24.0% rate — not tax advice; consult a CPA.
Schools (NCES district)
- District
- Siloam Springs School District
- NCES district ID
- 0512450
- Math proficiency
- 44% ▼ -7.00%
- Reading proficiency
- 40% ▼ -2.00%
- Median HH income
- $46,222
- Composite
- 35.81/100
- National rank
- #4828
- State rank
- #53 of 238 in AR
Livability — Siloam Springs
- Score
- 74/100
- State rank
- #17
- US rank
- #4621
Category grades
Schools grade is shown separately in the Schools card above.
Census & demographics
- Census place
- Siloam Springs, AR
- County
- Benton County · 259,241 people
- City population
- 24,745
- Metro
- Fayetteville-Springdale-Rogers, AR
- Population (ZIP)
- 24,745
- Household income
- $76,122
- Rent vs Own
- Severe rent burden
- 176.0
Population outlook (Benton County) Hauer SSP2
- Today (2025)
- 318,683 people
- By 2030
- 353,481 · +10.9%
- By 2040
- 425,280 · +33.4%
- By 2050
- 497,239 · +56.0%
- By 2075
- 662,114 · +107.8%
- By 2100
- 776,431 · +143.6%
Race, ethnicity, and origin ACS 2023
- Neighborhood character
- Diverse neighborhood (Simpson 0.63)
- Race & ethnicity
- White 58% Two or more races 24% Hispanic / Latino 19% Native American 4% Asian 3%
- Hispanic origin (detail)
- Mexican 8% Puerto Rican 2%
- Common ancestry
- Italian 2% Slovak 1% Serbian 1%
- Foreign-born
- 11% · Canada
- Languages at home
- 85% English-only · Spanish 13% Other Indo-European 1%
Political lean MEDSL · Benton
- 2024 margin
- Strong R (+27.0) · D 35.2% · R 62.1% · Other 2.7%
- 2008→2024 swing
- +9.6pp toward D · 2008: -36.5pp · 2024: -27.0pp
- All cycles
- 2024: R+27.0 2020: R+26.4 2016: R+34.9 2012: R+40.4 2008: R+36.5
Not yet ingested
- Civics
- —
Market trends
- HPI YoY
- ▼ -45.93%
- Current HPI
- 291.1062
- Rent YoY
- —
- Metro
- Fayetteville-Springdale-Rogers, AR
- State GDP YoY
- ▲ 3.80%
- F500 in state
- 10
Industry mix (Fortune 500 HQ in AR)
| Industry | F500 HQs | Revenue |
|---|---|---|
| Retail | 1 | $681B |
|
||
| Food / Agriculture | 1 | $53B |
|
||
| Retail / Energy | 1 | $22B |
|
||
| Transportation / Logistics | 1 | $12B |
|
||
| Energy | 1 | $4B |
|
||
Price history
+623.5% since first listed15 events — show timeline
- 2026-05-01 Pending — NWARMLS
- 2026-04-12 Price Changed $246,000 NWARMLS
- 2026-04-12 Relisted — NWARMLS
- 2026-03-08 Pending — NWARMLS
- 2026-02-26 Price Changed $247,400 NWARMLS
- 2026-02-23 Relisted — NWARMLS
- 2026-02-13 Pending — NWARMLS
- 2026-02-02 Listed $249,900 NWARMLS
- 2020-12-31 Sold (MLS) $167,500 NWARMLS
- 2020-10-14 Sold (Public Records) $167,500 Public Records
- 2020-08-31 Listed $167,500 NWARMLS
- 2020-07-15 Sold (Public Records) $123,500 Public Records
- 2020-07-13 Sold (MLS) $123,500 NWARMLS
- 2020-06-15 Listed $125,000 NWARMLS
- 1977-04-08 Sold (Public Records) $34,000 Public Records
Property tax history
+7.4%/yrLatest (2025): $1,190 · -6.4% YoY. Source: county tax records.
Cash-flow waterfall
monthlySold comps — $/sqft
last 12 mo · ≤1 miLoading sold comps…