 🏗️ New Construction
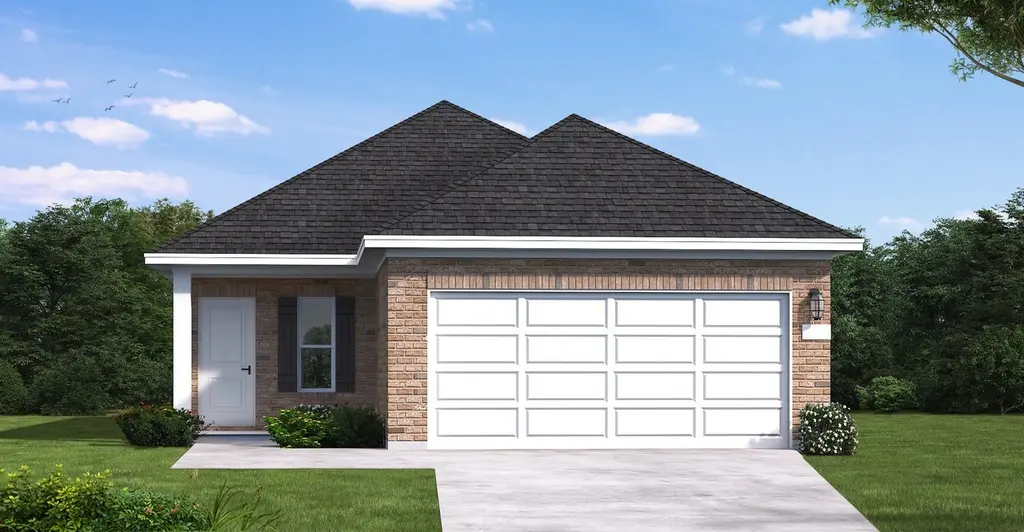
Gray Plan · Houston, TX
Flood risk No data
- FEMA flood zone
- —
- Chance of flooding over 30 yrs
- —
- Est. flood insurance / yr
- —
Fire risk No data
- Est. fire insurance / yr
- —
Heat risk No data
- Hot days now (above threshold)
- —
- Hot days in 30 yrs
- —
Wind risk No data
- Chance of severe wind over 30 yrs
- —
Air-quality risk No data
- Unhealthy air days now
- —
- Unhealthy air days in 30 yrs
- —
Risk factors via First Street. Map © Google.
Why this score? — see what drove the D+ grade
The composite is a weighted blend of 9 inputs, each scored 0–100. Each bar is that input's sub-score; the figure is the points it added to the 100-point composite (weight × sub-score).
- Cash flow +15.3/30.0
- ARV discount +7.5/15.0
- DSCR +4.7/10.0
- 1% rule +4.2/10.0
- Condition / age +4.0/5.0
- Livability +3.7/5.0
- Schools +3.5/10.0
- Rent growth +2.9/5.0
- Appreciation +0.0/10.0
$249,990
🖨 Deal sheet 📄 Offer letter ✓ Due diligence
Listing remarks
The Gray floor plan is a well-designed one-story home that offers three bedrooms, two bathrooms, and a spacious two-car garage. This layout emphasizes an open-concept design, seamlessly connecting the kitchen, dining, and living areas for effortless entertaining. The primary suite is positioned for privacy and includes a well-equipped ensuite bathroom. Two additional bedrooms provide ample space for family, guests, or a home office. With modern features and a smart, functional layout, the Gray floor plan is perfect for comfortable everyday living.
Key facts
- 2 garage spots
- Listed 4 days
Property features AI
Finance
- Financial info: List price $249,990
- HOA & community: Located in a community (Sundance Cove)
Exterior
- Parking: Detached or attached 2-car garage (2 parking spaces total)
- Home design: Single-family plan home (Gray plan); New construction — Plan inventory type
- Construction: Built as part of 2026 inventory
- Exterior features: Located in the Sundance Cove community; Living area approximately 1,433
Interior
- Kitchen: Plan-design kitchen (Gray plan)
- Bedrooms: 3 bedrooms
- Bathrooms: 2 full bathrooms
- Interior features: Open living area layout
Neighborhood map
What this means for you Summary
Snapshot
- This is a 3-bed/2.0-bath single-family listed at $250k. Condition is rated good.
Deal economics
- At list price, monthly cash flow is $85 ($1k/yr) — positive.
- To cash-flow at today's rent, offer at most $247k (1.1% below list).
- To meet the 1% rule (rent ≥ 1% of price), the offer needs to be $216k (13.5% below list).
- Recommended offer: $216k (13.5% below list) — sets the bar for 1% rule.
- Cap rate 6.7% vs local median 3.2% in Houston — top-decile yield for the area; either an underpriced asset or a hidden risk that comps aren't pricing in. Stress-test before assuming the spread holds.
Location & tenants
- Location reads 74/100 on livability (#184 in TX, #4,771 nationally) — a middle-class / working-renter tenant base. Strengths: amenities A+, cost of living A+, housing A+; Watch: schools D, crime F.
- Crosby ISD (rural): math 39% / reading 40% proficiency, ranked #369 of 826 in TX (top 45%) — families likely to look elsewhere, expect single-tenant / working-renter base with shorter leases.
- Market conditions: Rents rising (+1.5%/yr); 1172 active listings in the ZIP; 2 comparable units currently listed for rent nearby; solid renter incomes; 29,883 units permitted in Harris County in 2024 (8,621 in 5+ unit buildings).
Forward outlook
- Local home prices are declining (-3.0%/yr); year-one equity from $2k of loan paydown is wiped out by about $7k of value loss. Plan a longer hold.
- Harris County population projected at +47% by 2050 — long-run rental-demand tailwind backs the buy-and-hold thesis.
Negotiation context
- Only 4 days on market — expect competitive offers; lowballing is unlikely to land.
Questions for the listing agent
- Is there a deadline driving the sale (1031 exchange, divorce, estate, relocation)? That informs how much negotiation room exists.
- Schools are D-rated, which usually means shorter tenancies and higher turnover. Who's the typical renter profile here, and what's been the actual vacancy rate?
- Crime grade is F in this area — have there been break-ins, vandalism, or insurance claims at this property in the last 3 years? What carrier currently insures it and at what premium?
- The area grade is low — what's the realistic commute time and amenity access for the typical tenant pool here? Any planned neighborhood developments (good or bad) we should know about?
- What's the average days-on-market for RENTAL listings here right now (not sales)? A rising rental-DOM trend means longer vacancies and softer asking-rent achievability than the comps imply.
- What's the recent tenant-quality profile in this submarket — average credit score on applications, eviction rate, late-payment / NSF rate, and stable-employment percentage? A property-management company in the area should have these aggregated.
- How much new for-sale + rental construction is in the pipeline within 1–3 miles? Heavy new supply typically softens prices + rents 12–24 months out; constrained supply supports both.
Investment metrics
- 1% rule
- 0.92% ✗
- Cap rate
- 6.72%
- Cash-on-cash
- 1.54%
- DSCR
- 1.07
- GRM
- 9.1
CMA / ARV
- ARV (on-the-fly)
- $235,012
- Comps found
- 12
Show comp detail 12 sales within ~0.75 mi
| Address | Dist | Beds/Ba | Sqft | Sold | Price | $/sf | Match |
|---|---|---|---|---|---|---|---|
| 2603 Cactus Ranch Ln | 0.36mi | 3/2.0 | 1,414 (-1%) | 1mo | $232,540 | $164 | 80 |
| 2522 Cactus Ranch Ln | 0.41mi | 3/2.0 | 1,449 (+1%) | 1mo | $239,940 | $166 | 78 |
| 2550 Cactus Ranch Ln | 0.40mi | 3/2.0 | 1,440 (+0%) | 3mo | $211,790 | $147 | 78 |
| 2535 Paloverde Canyon Ct | 0.43mi | 3/2.0 | 1,449 (+1%) | 0mo | $243,940 | $168 | 78 |
| 2619 Cactus Ranch Ln | 0.38mi | 3/2.0 | 1,414 (-1%) | 3mo | $215,540 | $152 | 77 |
| 2543 Cactus Ranch Ln | 0.37mi | 3/2.0 | 1,405 (-2%) | 3mo | $237,540 | $169 | 77 |
| 2519 Cactus Ranch Ln | 0.38mi | 3/2.0 | 1,405 (-2%) | 2mo | $235,540 | $168 | 77 |
| 2602 Cactus Ranch Ln | 0.42mi | 3/2.0 | 1,449 (+1%) | 2mo | $239,940 | $166 | 77 |
| 2530 Cactus Ranch Ln | 0.42mi | 3/2.0 | 1,449 (+1%) | 3mo | $232,940 | $161 | 76 |
| 2534 Cactus Ranch Ln | 0.41mi | 3/2.0 | 1,414 (-1%) | 3mo | $215,540 | $152 | 76 |
| 18815 Deer Trace Dr | 0.27mi | 3/2.0 | 1,570 (+10%) | 3mo | $257,900 | $164 | 69 |
| 2515 Cactus Ranch Ln | 0.38mi | 4/2.0 (+1) | 1,557 (+9%) | 3mo | $249,040 | $160 | 60 |
Match score weights: distance 35% · size 25% · config 20% · recency 20%. Top-matched comps best support the ARV.
Projected returns pro-forma
-3.0% appreciation · 1.48% rent growth · sell at horizon
- IRR
- -15.6%
- Equity multiple
- 0.45×
- Total profit
- $-35,926
- Equity at exit
- $35,041
- IRR
- -9.9%
- Equity multiple
- 0.43×
- Total profit
- $-37,189
- Equity at exit
- $20,320
Cash invested: $65,803 (down + closing). Projections, not guarantees.
Landlord ↔ Tenant lean methodology
- Overall (STATE)
- 87 Strongly Landlord-Friendly
- State Texas
- 87 Strongly Landlord-Friendly · R+5
- County
- — inherits STATE
- City
- — inherits STATE
ZIP-level market 77532
- Home prices YoY
- -28.6%
- Rents YoY
- 1.5%
- Active inventory
- 1172
- Price-to-rent
- 9.6×
Monthly cashflow live
- Estimated rent
- $2,163 medium interval (Pro) →
- Mortgage (P&I)
- −$1,232
- Tax est. 1.5%
- −$294 /mo · $3,525/yr
- Insurance
- −$98
- HOA
- −$0
- Vacancy / Maint / Mgmt
- −$454
- Net cashflow
- $85
Break-even live
UW: 25.0% down · 7.5% · 30yr · 1.5% tax · 5.0% vac · 8.0% maint · 8.0% mgmt
Financing live
Cash to close
- Down payment
- $58,753
- Closing costs
- $7,050
- Reserves months
- —
- Total cash needed
- —
Loan-product check · same deal, 3 products live
Conventional
25% down · 7.5% · 30yr
- Down + closing
- —
- Monthly P&I
- —
- Monthly cashflow
- —
- DSCR
- —
- Eligible?
- —
Personal DTI + credit; lowest rate.
DSCR
20% down · 8.5% · 30yr
- Down + closing
- —
- Monthly P&I
- —
- Monthly cashflow
- —
- DSCR
- —
- Eligible?
- —
No personal income docs; deal must DSCR.
Hard money
10% down · 12.0% · 12mo
- Down + closing
- —
- Monthly P&I
- —
- Monthly cashflow
- —
- DSCR
- —
- Eligible?
- —
Short-term bridge; refi at stabilization.
Rent comps 2 comps
| Address | Beds | Baths | Sqft | Rent | $/sqft | DOM | Units | Dist |
|---|---|---|---|---|---|---|---|---|
| 1519 Gardenia Grove Ln Crosby, TX | 3.0 | 2.0 | 1461 | $1,800 | $1.23 | 24d | 1 | 1.18mi |
| 20034 White Dove Dr Crosby, TX | 3.0 | 2.0 | 1273 | $1,850 | $1.45 | 12d | 1 | 1.32mi |
Listing history 5 events
-
2026-06-17days on market $249,990 Active 4 DOM
-
2026-06-16days on market $249,990 Active 3 DOM
-
2026-06-15days on market $249,990 Active 2 DOM
-
2026-06-13remarks 553-char remark
-
2026-06-13$249,990 Active 1 DOM
ⓘ Source: listings_history table (triggers on properties + properties_extension) + one-shot
backfill from property_details.listing_events for pre-trigger history.
Nearby sold comps map
Loading sold comps map…
Walkable amenities ~0.75 mi
Loading nearby amenities…
Taxation est. · year 1
- Rental income
- $25,954
- − Mortgage interest
- −$13,164
- − Property taxes
- −$3,525
- − Insurance
- −$1,175
- − Repairs & maintenance
- −$2,076
- − Management
- −$2,076
- − Depreciation
- −$6,837
- Taxable loss
- −$2,900
- Est. tax savings @ 24.0%
- +$696
- After-tax cash flow
- $1,710/yr
For passive investors: Depreciation is non-cash, so a rental often shows a tax loss while cash-flowing — sheltering income. Rental losses are passive: they offset passive income freely, and up to $25,000/yr can offset ordinary (W-2) income if you actively participate and your MAGI is under $100k (phasing out to $0 by $150k); unused losses carry forward. On sale, claimed depreciation is recaptured at up to 25%, and gains may owe capital-gains tax (a 1031 exchange can defer both). Figures are a year-1 estimate at your 24.0% rate — not tax advice; consult a CPA.
Condition & rehab AI · 12 photos
This well-maintained, move-in-ready home with a modern design and good condition is ready for immediate occupancy. It offers a spacious floor plan, modern kitchen, and a good curb appeal. Potential buyers and tenants will appreciate the home's functionality and curb appeal.
Value-add opportunities
- Both Painting the exterior and interior walls — Fresh paint can enhance curb appeal and interior aesthetics.
- Both Landscaping improvements — Enhanced landscaping can improve curb appeal and attract potential buyers/tenants.
- Both Adding smart home features — Smart home features can increase the home's value and appeal to tech-savvy buyers/tenants.
- Both Upgrading the kitchen appliances — Modern, energy-efficient appliances can improve the home's functionality and appeal to buyers/tenants.
- Both Adding a smart thermostat — A smart thermostat can improve energy efficiency and comfort for potential buyers/tenants.
Renovation cost estimate screening
Value-add ROI direction
- Both Painting the exterior and interior walls — Fresh paint can enhance curb appeal and interior aesthetics. ↑
- Both Landscaping improvements — Enhanced landscaping can improve curb appeal and attract potential buyers/tenants. ↑
- Both Adding smart home features — Smart home features can increase the home's value and appeal to tech-savvy buyers/tenants. ↑
- Both Upgrading the kitchen appliances — Modern, energy-efficient appliances can improve the home's functionality and appeal to buyers/tenants. ↑
- Both Adding a smart thermostat — A smart thermostat can improve energy efficiency and comfort for potential buyers/tenants. ↑
ⓘ Cost ranges are severity-bucket heuristics (US national rule-of-thumb). Get contractor quotes + a written scope before underwriting a rehab budget.
Schools (NCES district)
- District
- Crosby ISD
- NCES district ID
- 4815750
- Math proficiency
- 39% ▼ -13.00%
- Reading proficiency
- 40% ▼ -5.00%
- Median HH income
- $61,079
- Composite
- 35.14/100
- National rank
- #5012
- State rank
- #369 of 826 in TX
Livability — Houston
- Score
- 74/100
- State rank
- #184
- US rank
- #4771
Category grades
Schools grade is shown separately in the Schools card above.
Census & demographics
- County
- Harris County · 4,702,590 people
- City population
- 3,226,434
- Metro
- Houston-The Woodlands-Sugar Land, TX
- Population (ZIP)
- 33,780
- Household income
- $92,201
- Rent vs Own
- Severe rent burden
- 382.0
Population outlook (Harris County) Hauer SSP2
- Today (2025)
- 5,571,493 people
- By 2030
- 6,089,821 · +9.3%
- By 2040
- 7,142,806 · +28.2%
- By 2050
- 8,185,864 · +46.9%
- By 2075
- 10,574,329 · +89.8%
- By 2100
- 12,109,958 · +117.4%
Race, ethnicity, and origin ACS 2023
- Neighborhood character
- Diverse neighborhood (Simpson 0.60)
- Race & ethnicity
- White 54% Hispanic / Latino 31% Two or more races 16% Black 9%
- Hispanic origin (detail)
- Mexican 24%
- Common ancestry
- Lithuanian 4% Romanian 3% Italian 2%
- Foreign-born
- 10% · Canada
- Languages at home
- 78% English-only · Spanish 21%
Political lean MEDSL · Harris
- 2024 margin
- Lean D (+5.5) · D 52.0% · R 46.4% · Other 1.6%
- 2008→2024 swing
- +3.9pp toward D · 2008: 1.6pp · 2024: 5.5pp
- All cycles
- 2024: D+5.5 2020: D+13.3 2016: D+12.4 2012: D+0.1 2008: D+1.6
Not yet ingested
- Civics
- —
Market trends
- HPI YoY
- ▼ -105.63%
- Current HPI
- 264.0126
- Rent YoY
- ▲ 1.48%
- Metro
- Houston-The Woodlands-Sugar Land, TX
- State GDP YoY
- ▲ 3.95%
- F500 in state
- 110
Industry mix (Fortune 500 HQ in TX)
| Industry | F500 HQs | Revenue |
|---|---|---|
| Energy | 16 | $1,198B |
|
||
| Technology | 5 | $198B |
|
||
| Engineering / Construction | 4 | $72B |
|
||
| Energy Services | 3 | $60B |
|
||
| Utilities | 3 | $41B |
|
||
| Healthcare | 2 | $330B |
|
||
Cash-flow waterfall
monthlySold comps — $/sqft
last 12 mo · ≤1 miLoading sold comps…