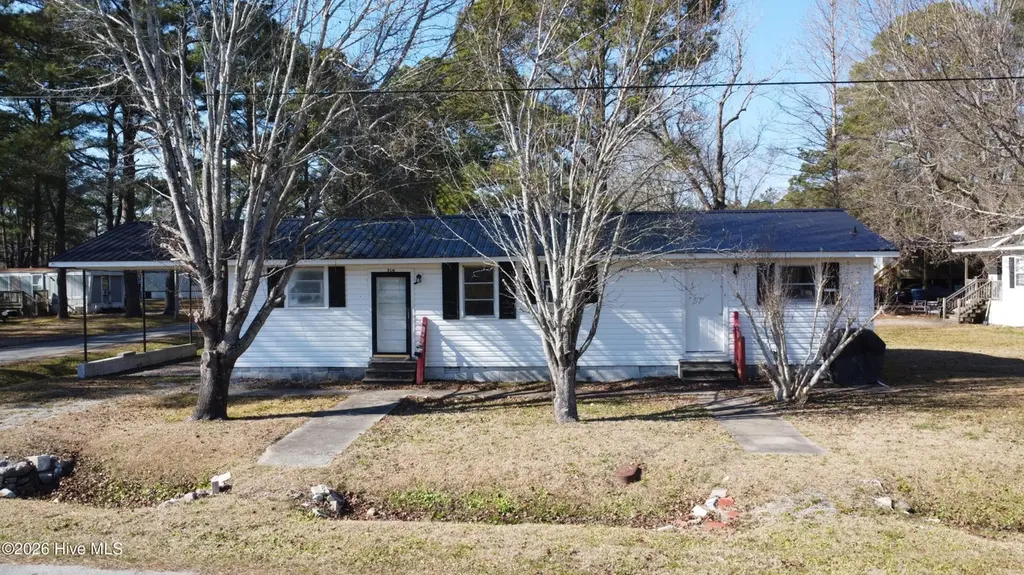
719 Washington St · Belhaven, NC
Flood risk 9/10 · Severe
- FEMA flood zone
- AE
- Chance of flooding over 30 yrs
- 0.99%
- Est. flood insurance / yr
- $1,737 – $8,500
Fire risk 2/10 · Minimal
- Est. fire insurance / yr
- $906 – $1,684
Heat risk 9/10 · Severe
- Hot days now (above 107°F)
- 7 days/yr
- Hot days in 30 yrs
- 19 days/yr
Wind risk 8/10 · Major
- Chance of severe wind over 30 yrs
- 99.0%
Air-quality risk 2/10 · Minimal
- Unhealthy air days now
- 0 days/yr
- Unhealthy air days in 30 yrs
- 1 days/yr
Risk factors via First Street. Map © Google.
Why this score? — see what drove the B- grade
The composite is a weighted blend of 9 inputs, each scored 0–100. Each bar is that input's sub-score; the figure is the points it added to the 100-point composite (weight × sub-score).
- Cash flow +30.0/30.0
- 1% rule +10.0/10.0
- DSCR +10.0/10.0
- ARV discount +7.5/15.0
- Livability +3.5/5.0
- Schools +3.4/10.0
- Rent growth +2.5/5.0
- Condition / age +2.5/5.0
- Appreciation +0.0/10.0
$69,000
🖨 Deal sheet 📄 Offer letter ✓ Due diligence
Listing remarks MLS
Welcome to an exciting investment opportunity in the heart of Belhaven, North Carolina! This charming property boasts three bedrooms and one bathroom, making it an ideal canvas for investors looking to create a profitable real estate venture. With a little TLC and some strategic upgrades, this property has the potential to generate a strong rental income or serve as a promising fix-and-flip project. Your investment journey begins here!
Key facts
- 0.23 acre lot
- Built 1959
- Listed 106 days
Tags
Property features AI
Exterior
- Parking: Unpaved parking
- Utilities: Public water; Sewer connected; Water connected
- Home design: Single-family residence; One story
- Construction: Block and vinyl siding construction; Built on crawl space
- Exterior features: Metal roof; No patio or porch; No fencing; Paved road access
Interior
- Bedrooms: 3 total rooms (includes bedrooms and living areas)
- Bathrooms: 1 full bathroom
- Heating & cooling: Electric forced-air heating; Wall/window cooling unit(s)
- Interior features: Crawl space basement; Has a view
Neighborhood map
What this means for you Summary
Snapshot
- This is a 2-bed/1.0-bath single-family listed at $69k.
Deal economics
- At list price, monthly cash flow is $118 ($1k/yr) — positive.
- The deal already cash-flows at list — no discount required.
- Meets the 1% rule at list price ($1k rent vs $69k).
- Recommended offer: $63k (9.0% below list) — sets the bar for market timing.
- Cap rate 15.8% vs local median 0.7% in Belhaven — top-decile yield for the area; either an underpriced asset or a hidden risk that comps aren't pricing in. Stress-test before assuming the spread holds.
Location & tenants
- Location reads 70/100 on livability (#127 in NC) — a middle-class / working-renter tenant base. Strengths: cost of living A+, health & safety A+, crime A; Watch: amenities F, commute F, employment F.
- Beaufort County Schools (rural): math 39% / reading 42% proficiency, ranked #112 of 178 in NC (top 63%) — families likely to look elsewhere, expect single-tenant / working-renter base with shorter leases; 67% free/reduced lunch — lower-income household profile, screen leases tightly.
- Zoned schools: Northeast Elementary (math 33% / reading 31%, grade F, #908 of 1,410 statewide, top 67%, 388 students, 99% FRL); Northside High (math 54% / reading 52%, grade C-, #280 of 535 statewide, top 52%, 376 students, 99% FRL) — zoned schools average 99% FRL vs 67% district-wide (32 pts higher); higher-poverty schools than district average — tighter screening recommended.
- Market conditions: 124 active listings in the ZIP; 1 comparable units currently listed for rent nearby; 216 units permitted in Beaufort County in 2024 (0 in 5+ unit buildings).
Forward outlook
- Local home prices are declining (-3.0%/yr); year-one equity from $477 of loan paydown is wiped out by about $2k of value loss. Plan a longer hold.
- Beaufort County population projected at -10% by 2050 — secular population decline; favor cash flow + early exit over multi-decade hold.
Negotiation context
- It's been on market 107 days — a 9% lower offer ($63k) is reasonable based on typical stale-listing flexibility.
- 2 sale attempts since 3y ago; this cycle's ask has dropped $20k (22%) from the opening price — seller is motivated, your offer sets the floor, not the list.
- Current owner paid $35k; list at $69k implies a 97% gain — meaningful room to come down on a strong offer.
Risks & watch-outs
- Watch-outs: flood insurance adds $427/mo; built in 1959 — expect roof / HVAC / electrical / plumbing capex.
- Climate carrying-cost: in FEMA flood zone AE (mandatory federal flood insurance); severe wind risk, 99% chance of damaging wind over 30y; extreme-heat days projected 7→19/yr by 2055 (HVAC capex compounding) — expect insurance premiums to compound above CPI over the hold.
Questions for the listing agent
- It's been on market 107 days. Have you received any prior offers? Is the seller open to a 9% concession, seller financing, or rate buy-down credit?
- Built in 1959 — when were the roof, HVAC, electrical panel, plumbing, and water heater last replaced?
- What's the actual annual flood-insurance premium (NFIP or private), and is the property in a SFHA with mandatory coverage?
- Why hasn't it sold? Are there any deal-killer items the seller is aware of (foundation, flood, title, zoning, code violations)?
- Is there a deadline driving the sale (1031 exchange, divorce, estate, relocation)? That informs how much negotiation room exists.
- Schools are F-rated, which usually means shorter tenancies and higher turnover. Who's the typical renter profile here, and what's been the actual vacancy rate?
- What's the average days-on-market for RENTAL listings here right now (not sales)? A rising rental-DOM trend means longer vacancies and softer asking-rent achievability than the comps imply.
- What's the recent tenant-quality profile in this submarket — average credit score on applications, eviction rate, late-payment / NSF rate, and stable-employment percentage? A property-management company in the area should have these aggregated.
- How much new for-sale + rental construction is in the pipeline within 1–3 miles? Heavy new supply typically softens prices + rents 12–24 months out; constrained supply supports both.
Investment metrics
- 1% rule
- 1.74% ✓
- Cap rate
- 15.76%
- Cash-on-cash
- 33.81%
- DSCR
- 2.50
- GRM
- 4.8
CMA / ARV
- ARV (on-the-fly)
- $148,400
- Comps found
- 4
Show comp detail 4 sales within ~0.75 mi
| Address | Dist | Beds/Ba | Sqft | Sold | Price | $/sf | Match |
|---|---|---|---|---|---|---|---|
| 958 W Pantego St | 0.63mi | 3/1.0 (+1) | 1,050 (-1%) | 3mo | $45,000 | $43 | 61 |
| 964 W Main St | 0.72mi | 3/1.5 (+1) | 1,070 (+1%) | 13mo | $168,000 | $157 | 47 |
| 930 W Main St | 0.70mi | 3/1.0 (+1) | 1,092 (+3%) | 13mo | $125,000 | $114 | 46 |
| 324 Harbinger St | 0.74mi | 2/1.0 | 916 (-14%) | 6mo | $128,000 | $140 | 38 |
Match score weights: distance 35% · size 25% · config 20% · recency 20%. Top-matched comps best support the ARV.
Projected returns pro-forma
-3.0% appreciation · 3.0% rent growth · sell at horizon
- IRR
- -4.8%
- Equity multiple
- 0.82×
- Total profit
- $-3,447
- Equity at exit
- $10,288
- IRR
- 5.3%
- Equity multiple
- 1.39×
- Total profit
- $7,610
- Equity at exit
- $5,966
Cash invested: $19,320 (down + closing). Projections, not guarantees.
Landlord ↔ Tenant lean methodology
- Overall (STATE)
- 85 Strongly Landlord-Friendly
- State North Carolina
- 85 Strongly Landlord-Friendly · R+3
- County
- — inherits STATE
- City
- — inherits STATE
ZIP-level market 27810
- Home prices YoY
- -24.1%
- Active inventory
- 124
- Price-to-rent
- 4.8×
Monthly cashflow live
- Estimated rent
- $1,200 medium interval (Pro) →
- Mortgage (P&I)
- −$362
- Tax from tax record
- −$13 /mo · $158/yr
- Insurance
- −$29
- Flood insurance flood zone
- −$427 /mo · $5,118/yr
- HOA
- −$0
- Vacancy / Maint / Mgmt
- −$252
- Net cashflow
- $118
Break-even live
UW: 25.0% down · 7.5% · 30yr · 1.5% tax · 5.0% vac · 8.0% maint · 8.0% mgmt
Financing live
Cash to close
- Down payment
- $17,250
- Closing costs
- $2,070
- Reserves months
- —
- Total cash needed
- —
Loan-product check · same deal, 3 products live
Conventional
25% down · 7.5% · 30yr
- Down + closing
- —
- Monthly P&I
- —
- Monthly cashflow
- —
- DSCR
- —
- Eligible?
- —
Personal DTI + credit; lowest rate.
DSCR
20% down · 8.5% · 30yr
- Down + closing
- —
- Monthly P&I
- —
- Monthly cashflow
- —
- DSCR
- —
- Eligible?
- —
No personal income docs; deal must DSCR.
Hard money
10% down · 12.0% · 12mo
- Down + closing
- —
- Monthly P&I
- —
- Monthly cashflow
- —
- DSCR
- —
- Eligible?
- —
Short-term bridge; refi at stabilization.
Rent comps 1 comps
| Address | Beds | Baths | Sqft | Rent | $/sqft | DOM | Units | Dist |
|---|---|---|---|---|---|---|---|---|
| 728 Elm St Belhaven, NC | 3.0 | 2.0 | 1200 | $1,200 | $1.00 | 20d | 1 | 0.42mi |
Listing history 21 events
-
2026-06-19days on market $69,000 Active 107 DOM
-
2026-06-18days on market $69,000 Active 106 DOM
-
2026-06-17days on market $69,000 Active 105 DOM
-
2026-06-16days on market $69,000 Active 104 DOM
-
2026-06-15days on market $69,000 Active 103 DOM
-
2026-06-14days on market $69,000 Active 101 DOM
-
2026-06-13days on market $69,000 Active 100 DOM
-
2026-06-10days on market $69,000 Active 98 DOM
-
2026-06-09days on market $69,000 Active 97 DOM
-
2026-06-08days on market $69,000 Active 96 DOM
-
2026-06-07pricedays on market $69,000 Active 95 DOM
-
2026-06-03days on market $79,000 Active 91 DOM
-
2026-06-02days on market $79,000 Active 90 DOM
-
2026-06-01days on market $79,000 Active 89 DOM
-
2026-05-31days on market $79,000 Active 88 DOM
-
2026-05-30days on market $79,000 Active 87 DOM
-
2026-04-13price $79,000
-
2026-03-03$89,000 Active
-
2023-11-22soldstatus $35,000 Closed 439-char remark
Show marketing remark (439 chars)
Welcome to an exciting investment opportunity in the heart of Belhaven, North Carolina! This charming property boasts three bedrooms and one bathroom, making it an ideal canvas for investors looking to create a profitable real estate venture. With a little TLC and some strategic upgrades, this property has the potential to generate a strong rental income or serve as a promising fix-and-flip project. Your investment journey begins here!
-
2023-11-07status Pending 439-char remark
Show marketing remark (439 chars)
Welcome to an exciting investment opportunity in the heart of Belhaven, North Carolina! This charming property boasts three bedrooms and one bathroom, making it an ideal canvas for investors looking to create a profitable real estate venture. With a little TLC and some strategic upgrades, this property has the potential to generate a strong rental income or serve as a promising fix-and-flip project. Your investment journey begins here!
-
2023-10-31$35,000 Active 439-char remark
Show marketing remark (439 chars)
Welcome to an exciting investment opportunity in the heart of Belhaven, North Carolina! This charming property boasts three bedrooms and one bathroom, making it an ideal canvas for investors looking to create a profitable real estate venture. With a little TLC and some strategic upgrades, this property has the potential to generate a strong rental income or serve as a promising fix-and-flip project. Your investment journey begins here!
ⓘ Source: listings_history table (triggers on properties + properties_extension) + one-shot
backfill from property_details.listing_events for pre-trigger history.
Tax reassessment forecast NC · Resets to sale price
- Current annual tax
- $158 · $13/mo
- Projected year-2 tax
- $566 · $47/mo
- Expected delta
- +$408/yr (+$34/mo · 259.2%)
ⓘ Screening estimate from a state-policy table — verify with the county assessor before closing.
Climate risk First Street
- Flood 9/10 Extreme FEMA zone AE · 99% chance over 30 yrs
- Wildfire 2/10 Low
- Heat 9/10 Extreme 7 d/yr ≥107°F today · 19 d/yr by 30 yrs out
- Wind 8/10 Severe 99% chance of damaging wind over 30 yrs
- Air quality 2/10 Low 0 unhealthy d/yr today · 1 by 30 yrs out
Nearby sold comps map
Loading sold comps map…
Walkable amenities ~0.75 mi
Loading nearby amenities…
Taxation est. · year 1
- Rental income
- $14,400
- − Mortgage interest
- −$3,865
- − Property taxes
- −$158
- − Insurance
- −$5,464
- − Repairs & maintenance
- −$1,152
- − Management
- −$1,152
- − Depreciation
- −$2,007
- Taxable income
- $603
- Est. tax owed @ 24.0%
- −$145
- After-tax cash flow
- $1,268/yr
For passive investors: Depreciation is non-cash, so a rental often shows a tax loss while cash-flowing — sheltering income. Rental losses are passive: they offset passive income freely, and up to $25,000/yr can offset ordinary (W-2) income if you actively participate and your MAGI is under $100k (phasing out to $0 by $150k); unused losses carry forward. On sale, claimed depreciation is recaptured at up to 25%, and gains may owe capital-gains tax (a 1031 exchange can defer both). Figures are a year-1 estimate at your 24.0% rate — not tax advice; consult a CPA.
Schools (NCES district)
- District
- Beaufort County Schools
- NCES district ID
- 3700330
- Math proficiency
- 39% ▬ 0.00%
- Reading proficiency
- 42% ▲ 3.00%
- Median HH income
- $40,486
- Composite
- 33.99/100
- National rank
- #5320
- State rank
- #112 of 178 in NC
Livability — Belhaven
- Score
- 70/100
- State rank
- #127
- US rank
- #7447
Category grades
Schools grade is shown separately in the Schools card above.
Census & demographics
- Census place
- Belhaven, NC
- Population (ZIP)
- 3,637
Population outlook (Beaufort County) Hauer SSP2
- Today (2025)
- 47,069 people
- By 2030
- 46,417 · -1.4%
- By 2040
- 44,455 · -5.6%
- By 2050
- 42,239 · -10.3%
- By 2075
- 37,349 · -20.7%
- By 2100
- 32,434 · -31.1%
Race, ethnicity, and origin ACS 2023
- Neighborhood character
- Predominantly White (74%)
- Race & ethnicity
- White 74% Black 20% Hispanic / Latino 5% Two or more races 3% Native American 1%
- Common ancestry
- Italian 5% Serbian 3% Iranian 3%
- Foreign-born
- 2% · Canada
- Languages at home
- 96% English-only · Spanish 3%
Political lean MEDSL · Beaufort
- 2024 margin
- Solid R (+31.1) · D 34.1% · R 65.2%
- 2008→2024 swing
- -13.7pp toward R · 2008: -17.4pp · 2024: -31.1pp
- All cycles
- 2024: R+31.1 2020: R+25.9 2016: R+24.5 2012: R+19.3 2008: R+17.4
Not yet ingested
- Civics
- —
Market trends
- HPI YoY
- ▼ -55.05%
- Current HPI
- 173.3725
- Rent YoY
- —
- Metro
- —
- State GDP YoY
- ▲ 3.28%
- F500 in state
- 26
Industry mix (Fortune 500 HQ in NC)
| Industry | F500 HQs | Revenue |
|---|---|---|
| Financial Services | 2 | $213B |
|
||
| Retail | 2 | $95B |
|
||
| Industrial Conglomerate | 1 | $38B |
|
||
| Metals / Steel | 1 | $35B |
|
||
| Utilities | 1 | $30B |
|
||
| Industrial Machinery | 1 | $19B |
|
||
Price history
+125.7% since first listed5 events — show timeline
- 2026-04-13 Price Changed $79,000 Hive MLS
- 2026-03-03 Listed $89,000 Hive MLS
- 2023-11-22 Sold (MLS) $35,000 Hive MLS
- 2023-11-07 Pending — Hive MLS
- 2023-10-31 Listed $35,000 Hive MLS
Property tax history
-6.7%/yrLatest (2025): $158 · -69.2% YoY. Source: county tax records.
Cash-flow waterfall
monthlySold comps — $/sqft
last 12 mo · ≤1 miLoading sold comps…