6700 SW Dignity Ave · Bentonville, AR
Flood risk 1/10 · Minimal
- FEMA flood zone
- X (unshaded)
- Chance of flooding over 30 yrs
- 0.0%
- Est. flood insurance / yr
- $507 – $1,088
Fire risk 5/10 · Moderate
- Est. fire insurance / yr
- $1,499 – $2,785
Heat risk 5/10 · Moderate
- Hot days now (above 105°F)
- 7 days/yr
- Hot days in 30 yrs
- 18 days/yr
Wind risk 3/10 · Minor
- Chance of severe wind over 30 yrs
- 5.0%
Air-quality risk 1/10 · Minimal
- Unhealthy air days now
- 0 days/yr
- Unhealthy air days in 30 yrs
- 0 days/yr
Risk factors via First Street. Map © Google.
Why this score? — see what drove the D+ grade
The composite is a weighted blend of 9 inputs, each scored 0–100. Each bar is that input's sub-score; the figure is the points it added to the 100-point composite (weight × sub-score).
- Appreciation +10.0/10.0
- Cash flow +9.2/30.0
- ARV discount +7.5/15.0
- Schools +5.2/10.0
- Livability +4.2/5.0
- 1% rule +2.8/10.0
- DSCR +2.6/10.0
- Rent growth +2.6/5.0
- Condition / age +2.5/5.0
$218,450
🖨 Deal sheet 📄 Offer letter ✓ Due diligence
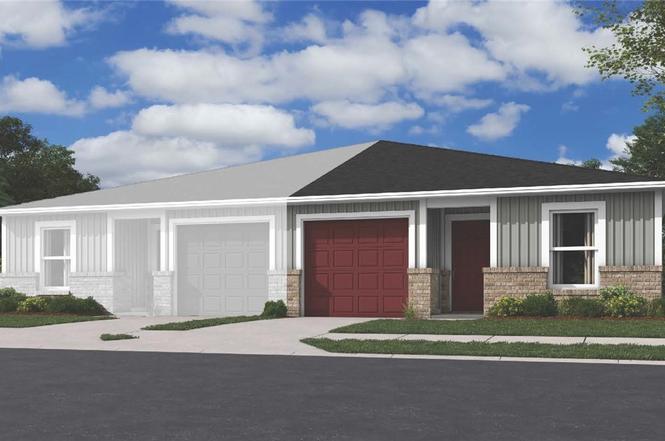
Listing remarks
Welcome to The Langford, a stunning duplex in a brand-new community! This modern 3-bedroom, 2-bath home boasts an inviting open floor plan, perfect for both relaxing and entertaining. The spacious kitchen features sleek appliances and ample counter space, seamlessly flowing into the bright living area. Retreat to the serene master suite, complete with a luxurious en-suite bathroom and a generous walk-in closet that offers plenty of storage. Two additional bedrooms provide flexibility for guests, a home office, or a growing family. Enjoy the convenience of a one-car garage and a charming backyard, ideal for outdoor gatherings. Located in a vibrant community with easy access to parks, shoppin
Key facts
- Master suite
- Open floor plan
- Bright living area
Tags
Neighborhood map
What this means for you Summary
Snapshot
- This is a 3-bed/2.0-bath land listed at $218k.
Deal economics
- At list price, monthly cash flow is $-166 ($-2k/yr) — negative.
- To cash-flow at today's rent, offer at most $194k (11.0% below list).
- To meet the 1% rule (rent ≥ 1% of price), the offer needs to be $170k (22.1% below list).
- Recommended offer: $170k (22.1% below list) — sets the bar for 1% rule.
- Cap rate 5.4% vs local median 2.6% in Bentonville — top-decile yield for the area; either an underpriced asset or a hidden risk that comps aren't pricing in. Stress-test before assuming the spread holds.
Location & tenants
- Location reads 83/100 on livability (#2 in AR, #864 nationally) — a professional / high-income tenant draw. Strengths: employment A+, housing A+, health & safety A+; Watch: amenities F.
- Bentonville School District (urban): math 59% / reading 59% proficiency, ranked #3 of 238 in AR (top 1%) — acceptable for families but not a draw, mixed tenant base, ~2y average lease.
- Market conditions: Rents flat; 690 active listings in the ZIP; 34 comparable units currently listed for rent nearby; rentals at typical pace (median 24d on market — plan ~3-4 weeks tenant-placement turnaround); high-income renter base; 4,359 units permitted in Benton County in 2024 (402 in 5+ unit buildings).
- This rent is only 17% of the median local income ($120k/yr) — well below the 30% rent-burden line; pricing power to push rent on renewal without tenant pushback.
Forward outlook
- In year one you build about $23k of equity ($2k loan paydown + $22k appreciation (10.0% local appreciation)).
- Benton County population projected at +56% by 2050 — long-run rental-demand tailwind backs the buy-and-hold thesis.
- By year 2, paydown + projected appreciation supports a ~$38k cash-out refi (75% LTV) — recoverable capital for the next deal without selling this one.
Negotiation context
- Only 14 days on market — expect competitive offers; lowballing is unlikely to land.
Risks & watch-outs
- Climate carrying-cost: moderate wildfire risk; extreme-heat days projected 7→18/yr by 2055 (HVAC capex compounding) — expect insurance premiums to compound above CPI over the hold.
Questions for the listing agent
- What do current leases actually rent for vs. the listed asking? Can we see a recent rent roll and the last 12 months of T-12 income?
- Is there a deadline driving the sale (1031 exchange, divorce, estate, relocation)? That informs how much negotiation room exists.
- Schools are A-rated — typically a magnet for longer-tenancy family renters. What's the average tenant stay here, and is there a school-zone premium baked into asking?
- The area grade is low — what's the realistic commute time and amenity access for the typical tenant pool here? Any planned neighborhood developments (good or bad) we should know about?
- What's the average days-on-market for RENTAL listings here right now (not sales)? A rising rental-DOM trend means longer vacancies and softer asking-rent achievability than the comps imply.
- What's the recent tenant-quality profile in this submarket — average credit score on applications, eviction rate, late-payment / NSF rate, and stable-employment percentage? A property-management company in the area should have these aggregated.
- How much new for-sale + rental construction is in the pipeline within 1–3 miles? Heavy new supply typically softens prices + rents 12–24 months out; constrained supply supports both.
Investment metrics
- 1% rule
- 0.78% ✗
- Cap rate
- 5.38%
- Cash-on-cash
- -3.25%
- DSCR
- 0.86
- GRM
- 10.7
CMA / ARV
No comps found within radius.
Projected returns pro-forma
10.0% appreciation · 0.39% rent growth · sell at horizon
- IRR
- 21.2%
- Equity multiple
- 2.70×
- Total profit
- $104,090
- Equity at exit
- $196,797
- IRR
- 18.6%
- Equity multiple
- 6.02×
- Total profit
- $306,952
- Equity at exit
- $424,400
Cash invested: $61,166 (down + closing). Projections, not guarantees.
Landlord ↔ Tenant lean methodology
- Overall (STATE)
- 92 Strongly Landlord-Friendly
- State Arkansas
- 92 Strongly Landlord-Friendly · R+14
- County
- — inherits STATE
- City
- — inherits STATE
ZIP-level market 72713
- Home prices YoY
- 3.5%
- Rents YoY
- 0.4%
- Active inventory
- 690
- Price-to-rent
- 10.7×
Monthly cashflow live
- Estimated rent
- $1,701 high interval (Pro) →
- Mortgage (P&I)
- −$1,146
- Tax est. 1.5%
- −$273 /mo · $3,277/yr
- Insurance
- −$91
- HOA
- −$0
- Vacancy / Maint / Mgmt
- −$357
- Net cashflow
- $-166
Break-even live
UW: 25.0% down · 7.5% · 30yr · 1.5% tax · 5.0% vac · 8.0% maint · 8.0% mgmt
Financing live
Cash to close
- Down payment
- $54,612
- Closing costs
- $6,554
- Reserves months
- —
- Total cash needed
- —
Loan-product check · same deal, 3 products live
Conventional
25% down · 7.5% · 30yr
- Down + closing
- —
- Monthly P&I
- —
- Monthly cashflow
- —
- DSCR
- —
- Eligible?
- —
Personal DTI + credit; lowest rate.
DSCR
20% down · 8.5% · 30yr
- Down + closing
- —
- Monthly P&I
- —
- Monthly cashflow
- —
- DSCR
- —
- Eligible?
- —
No personal income docs; deal must DSCR.
Hard money
10% down · 12.0% · 12mo
- Down + closing
- —
- Monthly P&I
- —
- Monthly cashflow
- —
- DSCR
- —
- Eligible?
- —
Short-term bridge; refi at stabilization.
Rent comps 34 comps
| Address | Beds | Baths | Sqft | Rent | $/sqft | DOM | Units | Dist |
|---|---|---|---|---|---|---|---|---|
| 6604 SW Dignity Ave Bentonville, AR | 3.0 | 3.0 | 1430 | $1,550 | $1.08 | 14d | 1 | 0.03mi |
| 221 Williams Ct Bentonville, AR | 3.0 | 2.0 | 1410 | $1,725 | $1.22 | 23d | 1 | 0.06mi |
| 621-623 Cosmos St Centerton, AR | 3.0 | 2.0 | 1475 | $1,795 | $1.22 | 14d | 1 | 0.67mi |
| 831 Massachusetts Ave Bentonville, AR | 2.0 | 2.0 | 1250 | $1,718 | $1.37 | 23d | 1 | 1.06mi |
| 840 States Ave Bentonville, AR | 3.0 | 2.0 | 1100 | $1,624 | $1.48 | 23d | 1 | 1.07mi |
| 830 Massachusetts Ave Bentonville, AR | 2.0 | 2.0 | 1250 | $1,718 | $1.37 | 23d | 1 | 1.08mi |
| 860 States Ave Bentonville, AR | 2.0 | 2.0 | 1250 | $1,718 | $1.37 | 23d | 1 | 1.08mi |
| 841 Tennessee Ave Bentonville, AR | 2.0 | 2.5 | 1250 | $1,640 | $1.31 | 23d | 1 | 1.09mi |
| 891 States Ave Bentonville, AR | 2.0 | 2.0 | 1250 | $1,718 | $1.37 | 23d | 1 | 1.09mi |
| 931 States Ave Bentonville, AR | 2.0 | 2.0 | 1250 | $1,718 | $1.37 | 23d | 1 | 1.11mi |
| 890 Tennessee Ave Bentonville, AR | 3.0 | 2.5 | 1250 | $1,595 | $1.28 | 21d | 1 | 1.12mi |
| 821 Arctic Ave Bentonville, AR | 2.0 | 2.0 | 1250 | $1,726 | $1.38 | 23d | 1 | 1.14mi |
| 831 Ventnor Ave Bentonville, AR | 3.0 | 2.0 | 1100 | $1,525 | $1.39 | 23d | 1 | 1.14mi |
| 830 Ventnor Ave Bentonville, AR | 2.0 | 2.5 | 1100 | $1,350 | $1.23 | 21d | 1 | 1.15mi |
| 1021 States Ave Bentonville, AR | 2.0 | 2.5 | 1250 | $1,850 | $1.48 | 14d | 1 | 1.15mi |
| 861 Ventnor Ave Bentonville, AR | 2.0 | 2.5 | 1100 | $1,350 | $1.23 | 23d | 1 | 1.16mi |
| 1020 States Ave Bentonville, AR | 3.0 | 2.0 | 1100 | $1,624 | $1.48 | 23d | 1 | 1.16mi |
| 860 Ventnor Ave Bentonville, AR | 2.0 | 2.5 | 1100 | $1,350 | $1.23 | 23d | 1 | 1.16mi |
| 820 Boardwalk Ave Bentonville, AR | 3.0 | 2.0 | 1100 | $1,450 | $1.32 | 23d | 1 | 1.16mi |
| 881 Ventnor Ave Centerton, AR | 3.0 | 2.5 | 1250 | $1,550 | $1.24 | 23d | 1 | 1.17mi |
| 840 Boardwalk Ave Bentonville, AR | 2.0 | 2.5 | 1100 | $1,465 | $1.33 | 23d | 1 | 1.17mi |
| 1060 States Ave Bentonville, AR | 3.0 | 2.0 | 1100 | $1,624 | $1.48 | 23d | 1 | 1.19mi |
| 1031 Kentucky Ave Bentonville, AR | 3.0 | 2.0 | 1100 | $1,700 | $1.55 | 23d | 1 | 1.19mi |
| 1040 Indiana Ave Bentonville, AR | 3.0 | 2.0 | 1100 | $1,624 | $1.48 | 23d | 1 | 1.19mi |
| 1061 Indiana Ave Bentonville, AR | 3.0 | 2.0 | 1100 | $1,624 | $1.48 | 23d | 1 | 1.19mi |
| 1050 Indiana Ave Bentonville, AR | 3.0 | 2.0 | 1100 | $1,624 | $1.48 | 23d | 1 | 1.20mi |
| 1090 States Ave Bentonville, AR | 2.0 | 2.0 | 1250 | $1,718 | $1.37 | 23d | 1 | 1.21mi |
| 1061 Kentucky Ave Bentonville, AR | 3.0 | 2.5 | 1250 | $1,550 | $1.24 | 23d | 1 | 1.21mi |
| 1091 Indiana Ave Bentonville, AR | 2.0 | 2.0 | 1250 | $1,718 | $1.37 | 23d | 1 | 1.21mi |
| 1080 Indiana Ave Bentonville, AR | 3.0 | 2.0 | 1100 | $1,624 | $1.48 | 23d | 1 | 1.22mi |
| 960 Ventnor Ave Centerton, AR | 3.0 | 2.5 | 1250 | $1,750 | $1.40 | 23d | 1 | 1.23mi |
| 1071 Ventnor Ave Centerton, AR | 3.0 | 2.0 | 1100 | $1,400 | $1.27 | 23d | 1 | 1.28mi |
| 501 E Centerton Blvd Centerton, AR | 1.0–2.0 | 1.0–2.0 | 835 | $1,292 | $1.55 | 14d | 25 | 1.31mi |
| 811 Meadowlands Dr Centerton, AR | 3.0 | 2.0 | 1474 | $1,225 | $0.83 | 23d | 1 | 1.43mi |
Listing history 5 events
-
2026-04-17soldstatus $763,650
-
2026-03-16status Pending
-
2026-03-12price $218,450
-
2026-03-02$220,500 Active
-
2025-12-15soldstatus $1,118,320
ⓘ Source: listings_history table (triggers on properties + properties_extension) + one-shot
backfill from property_details.listing_events for pre-trigger history.
Climate risk First Street
- Flood 1/10 Low FEMA zone X (unshaded) · 0% chance over 30 yrs
- Wildfire 5/10 Major
- Heat 5/10 Major 7 d/yr ≥105°F today · 18 d/yr by 30 yrs out
- Wind 3/10 Moderate 5% chance of damaging wind over 30 yrs
- Air quality 1/10 Low 0 unhealthy d/yr today · 0 by 30 yrs out
Nearby sold comps map
Loading sold comps map…
Walkable amenities ~0.75 mi
Loading nearby amenities…
Taxation est. · year 1
- Rental income
- $20,414
- − Mortgage interest
- −$12,237
- − Property taxes
- −$3,277
- − Insurance
- −$1,092
- − Repairs & maintenance
- −$1,633
- − Management
- −$1,633
- − Depreciation
- −$6,355
- Taxable loss
- −$5,813
- Est. tax savings @ 24.0%
- +$1,395
- After-tax cash flow
- $-594/yr
For passive investors: Depreciation is non-cash, so a rental often shows a tax loss while cash-flowing — sheltering income. Rental losses are passive: they offset passive income freely, and up to $25,000/yr can offset ordinary (W-2) income if you actively participate and your MAGI is under $100k (phasing out to $0 by $150k); unused losses carry forward. On sale, claimed depreciation is recaptured at up to 25%, and gains may owe capital-gains tax (a 1031 exchange can defer both). Figures are a year-1 estimate at your 24.0% rate — not tax advice; consult a CPA.
Schools (NCES district)
- District
- Bentonville School District
- NCES district ID
- 0503060
- Math proficiency
- 59% ▼ -8.00%
- Reading proficiency
- 59% ▼ -6.00%
- Median HH income
- $66,721
- Composite
- 51.85/100
- National rank
- #1661
- State rank
- #3 of 238 in AR
Livability — Bentonville
- Score
- 83/100
- State rank
- #2
- US rank
- #864
Category grades
Schools grade is shown separately in the Schools card above.
Census & demographics
- Census place
- Bentonville, AR
- County
- Benton County · 259,241 people
- City population
- 67,689
- Metro
- Fayetteville-Springdale-Rogers, AR
- Population (ZIP)
- 28,999
- Household income
- $119,853
- Rent vs Own
- Severe rent burden
- 508.0
Population outlook (Benton County) Hauer SSP2
- Today (2025)
- 318,683 people
- By 2030
- 353,481 · +10.9%
- By 2040
- 425,280 · +33.4%
- By 2050
- 497,239 · +56.0%
- By 2075
- 662,114 · +107.8%
- By 2100
- 776,431 · +143.6%
Race, ethnicity, and origin ACS 2023
- Neighborhood character
- Diverse neighborhood (Simpson 0.66)
- Race & ethnicity
- White 54% Asian 20% Two or more races 16% Hispanic / Latino 11% Black 3%
- Hispanic origin (detail)
- Mexican 8%
- Common ancestry
- Italian 2% Slovak 2% Romanian 1%
- Foreign-born
- 22% · Canada, China, Vietnam
- Languages at home
- 79% English-only · Other Asian/Pacific 8% Spanish 6% Other Indo-European 5%
Political lean MEDSL · Benton
- 2024 margin
- Strong R (+27.0) · D 35.2% · R 62.1% · Other 2.7%
- 2008→2024 swing
- +9.6pp toward D · 2008: -36.5pp · 2024: -27.0pp
- All cycles
- 2024: R+27.0 2020: R+26.4 2016: R+34.9 2012: R+40.4 2008: R+36.5
Not yet ingested
- Civics
- —
Market trends
- HPI YoY
- ▲ 10.77%
- Current HPI
- 319.3081
- Rent YoY
- ▲ 0.39%
- Metro
- Fayetteville-Springdale-Rogers, AR
- State GDP YoY
- ▲ 3.80%
- F500 in state
- 10
Industry mix (Fortune 500 HQ in AR)
| Industry | F500 HQs | Revenue |
|---|---|---|
| Retail | 1 | $681B |
|
||
| Food / Agriculture | 1 | $53B |
|
||
| Retail / Energy | 1 | $22B |
|
||
| Transportation / Logistics | 1 | $12B |
|
||
| Energy | 1 | $4B |
|
||
Price history
-31.7% since first listed5 events — show timeline
- 2026-04-17 Sold (Public Records) $763,650 Public Records
- 2026-03-16 Pending — NWARMLS
- 2026-03-12 Price Changed $218,450 NWARMLS
- 2026-03-02 Listed $220,500 NWARMLS
- 2025-12-15 Sold (Public Records) $1,118,320 Public Records
Cash-flow waterfall
monthlySold comps — $/sqft
last 12 mo · ≤1 miLoading sold comps…