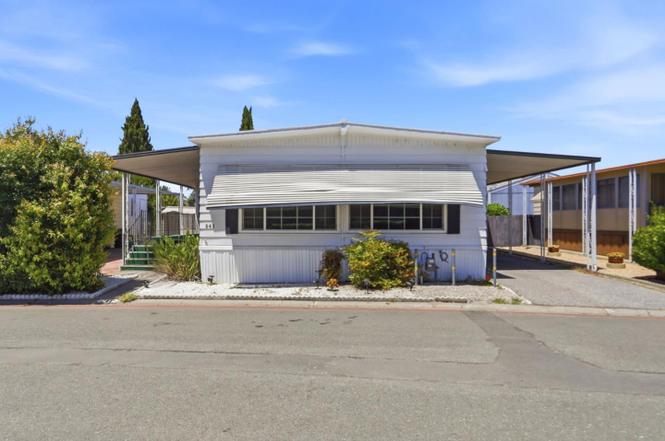
1220 Tasman Dr #241 · Sunnyvale, CA
Flood risk 3/10 · Minor
- FEMA flood zone
- X
- Chance of flooding over 30 yrs
- 0.2%
- Est. flood insurance / yr
- $507 – $1,088
Fire risk 1/10 · Minimal
- Est. fire insurance / yr
- $659 – $1,223
Heat risk 5/10 · Moderate
- Hot days now (above 91°F)
- 7 days/yr
- Hot days in 30 yrs
- 15 days/yr
Wind risk 1/10 · Minimal
- Chance of severe wind over 30 yrs
- —
Air-quality risk 7/10 · Major
- Unhealthy air days now
- 13 days/yr
- Unhealthy air days in 30 yrs
- 13 days/yr
Risk factors via First Street. Map © Google.
Why this score? — see what drove the A- grade
The composite is a weighted blend of 9 inputs, each scored 0–100. Each bar is that input's sub-score; the figure is the points it added to the 100-point composite (weight × sub-score).
- Cash flow +30.0/30.0
- ARV discount +15.0/15.0
- 1% rule +10.0/10.0
- DSCR +10.0/10.0
- Schools +5.3/10.0
- Livability +4.1/5.0
- Appreciation +3.2/10.0
- Rent growth +3.2/5.0
- Condition / age +2.8/5.0
$259,888
🖨 Deal sheet 📄 Offer letter ✓ Due diligence
Listing remarks MLS
Location, Location, Location! Welcome to this spacious 3 bedroom, 2 bathroom home offering approximately 1,440 sq. ft. of living space in the highly desirable Adobe Wells all-age community. Perfectly situated directly across from the main clubhouse, this home enjoys one of the best locations in the park with plenty guest parking and convenient access to all community amenities. Thoughtful updates throughout, including dual-pane windows, laminate flooring, updated light fixtures, and all appliances included, washer, dryer, and even two refrigerators. A screened-in room and additional bonus room provide flexible living space that can be used as a home office, hobby room, or potential fourth bedroom. The spacious carport can accommodate up to 4 vehicles, providing plenty of parking for family and guests. Enjoy resort-style living just steps from your front door with an impressive array of community amenities, including a swimming pool, hot tub, fitness center, sauna, billiards room, ping pong tables, card rooms, reading and TV lounges, a large event hall with a commercial kitchen, laundry facilities, a spacious outdoor deck, a beautiful pond, playground, and so much more. The amenities and activities are endless, creating a welcoming lifestyle for residents of all ages!
Key facts
- Laminate flooring
- Hot tub
- Dual-pane windows
Tags
Property features AI
Finance
- Other: Space rent listed (management info)
- Financial info: In-lieu-of-tax (ILT) tax type
- HOA & community: Community amenities include clubhouse, community pool, gym/exercise facility, playground, recreation room, game court (outdoor), tennis court, putting green, billiard room, barbecue area, car wash area, garden/greenbelt/trails, RV/boat storage, common utility room, and trash chute; Park rules include board approval and various pet/parking restrictions; age: no restrictions; family park
Exterior
- Parking: Carport with 4 spaces (minimum); Covered parking; Tandem parking; Common parking area; On-street parking; Guest/visitor parking; Assigned space number 241
- Utilities: Public sewer (connected); Individual electric meter; Individual gas meter; Individual water meter; Water on site; Primary meter
- Home design: Manufactured home in a community setting
- Construction: Assessor listed living area
- Exterior features: Metal roof; Other roof details (see remarks); Leased land – unit will remain
Interior
- Kitchen: Electric cooktop; Double oven; Dishwasher; Garbage disposal; Exhaust fan; Gas hookups
- Bedrooms: 3 bedrooms
- Flooring: Hardwood; Laminate; Tile; Vinyl/linoleum; Other (See Remarks)
- Bathrooms: 2 full bathrooms
- Heating & cooling: Central forced air heating
- Interior features: Dining area open to family room; Additional rooms include laundry room, storage, and a room listed as 'Other (See Remarks)'
- Laundry & utility: Washer and dryer provided
Neighborhood map
What this means for you Summary
Snapshot
- This is a 3-bed/2.0-bath manufactured listed at $260k. Condition is rated average.
Deal economics
- At list price, monthly cash flow is $2k ($23k/yr) — positive.
- The deal already cash-flows at list — no discount required.
- Meets the 1% rule at list price ($5k rent vs $260k).
- Cap rate 15.1% vs local median 1.2% in Sunnyvale — top-decile yield for the area; either an underpriced asset or a hidden risk that comps aren't pricing in. Stress-test before assuming the spread holds.
Location & tenants
- Location reads 82/100 on livability (#37 in CA, #1,258 nationally) — a professional / high-income tenant draw. Strengths: amenities A+, commute A+, employment A+; Watch: cost of living F.
- Santa Clara Unified (urban): math 49% / reading 66% proficiency, ranked #75 of 517 in CA (top 14%) — acceptable for families but not a draw, mixed tenant base, ~2y average lease.
- Zoned schools: George Mayne Elementary (300 students, 65% FRL); Adrian Wilcox High (math 55% / reading 72%, grade B-, #182 of 1,170 statewide, top 16%, 1,859 students, 40% FRL) — zoned schools average 52% FRL vs 33% district-wide (20 pts higher); higher-poverty schools than district average — tighter screening recommended.
- Market conditions: Rents rising (+2.6%/yr); 69 active listings in the ZIP; 14 comparable units currently listed for rent nearby; rentals leasing fast (median 2d on market — plan ~1-2 weeks tenant-placement turnaround); high-income renter base; 3,838 units permitted in Santa Clara County in 2024 (1,886 in 5+ unit buildings).
- This rent runs 36% of the median local income ($158k/yr) — at the standard rent-burdened threshold; future hikes will face affordability resistance.
Forward outlook
- Local home prices are declining (-3.0%/yr); year-one equity from $2k of loan paydown is wiped out by about $8k of value loss. Plan a longer hold.
- Santa Clara County population projected at +24% by 2050 — long-run rental-demand tailwind backs the buy-and-hold thesis.
- At projected returns (-3.0% appreciation + 2.6% rent growth), your $73k cash investment doubles in ~4 years — after that, you're playing with house money.
Negotiation context
- Only 8 days on market — expect competitive offers; lowballing is unlikely to land.
- 2 sale attempts with the ask held roughly flat each time — persistent listings suggest the price (not the market) is what's stuck; bring a comps-based counter.
Risks & watch-outs
- Climate carrying-cost: extreme-heat days projected 7→15/yr by 2055 (HVAC capex compounding) — expect insurance premiums to compound above CPI over the hold.
Questions for the listing agent
- Built in 1968 — when were the roof, HVAC, electrical panel, plumbing, and water heater last replaced?
- Is there a deadline driving the sale (1031 exchange, divorce, estate, relocation)? That informs how much negotiation room exists.
- Schools are B-rated — typically a magnet for longer-tenancy family renters. What's the average tenant stay here, and is there a school-zone premium baked into asking?
- What's the average days-on-market for RENTAL listings here right now (not sales)? A rising rental-DOM trend means longer vacancies and softer asking-rent achievability than the comps imply.
- What's the recent tenant-quality profile in this submarket — average credit score on applications, eviction rate, late-payment / NSF rate, and stable-employment percentage? A property-management company in the area should have these aggregated.
- How much new for-sale + rental construction is in the pipeline within 1–3 miles? Heavy new supply typically softens prices + rents 12–24 months out; constrained supply supports both.
Investment metrics
- 1% rule
- 1.81% ✓
- Cap rate
- 15.11%
- Cash-on-cash
- 31.51%
- DSCR
- 2.40
- GRM
- 4.6
CMA / ARV
- ARV (on-the-fly)
- $342,720
- Comps found
- 12
Show comp detail 12 sales within ~0.75 mi
| Address | Dist | Beds/Ba | Sqft | Sold | Price | $/sf | Match |
|---|---|---|---|---|---|---|---|
| 1085 Tasman Dr #708 | 0.41mi | 3/2.0 | 1,440 (0%) | 0mo | $313,000 | $217 | 81 |
| 1220 Tasman Dr #124 | 0.12mi | 3/2.0 | 1,336 (-7%) | 2mo | $320,000 | $240 | 81 |
| 1220 Tasman Dr #142 | 0.03mi | 3/2.0 | 1,590 (+10%) | 3mo | $355,000 | $223 | 79 |
| 1225 Vienna Dr #370 | 0.40mi | 2/2.0 (-1) | 1,440 (0%) | 1mo | $210,000 | $146 | 75 |
| 1085 Tasman Dr #413 | 0.45mi | 2/2.0 (-1) | 1,440 (0%) | 3mo | $225,000 | $156 | 72 |
| 1225 Vienna Dr #150 | 0.43mi | 3/2.0 | 1,521 (+6%) | 3mo | $374,000 | $246 | 68 |
| 1225 Vienna Dr #925 | 0.43mi | 2/2.0 (-1) | 1,490 (+4%) | 1mo | $305,000 | $205 | 68 |
| 1085 Tasman Dr #96 | 0.45mi | 3/2.0 | 1,517 (+5%) | 4mo | $365,000 | $241 | 67 |
| 1225 Vienna Dr #114 | 0.35mi | 3/2.0 | 1,600 (+11%) | 2mo | $380,000 | $238 | 64 |
| 1225 Vienna Dr #938 | 0.35mi | 2/2.0 (-1) | 1,296 (-10%) | 1mo | $245,500 | $189 | 61 |
| 1220 Vienna Dr #464 | 0.29mi | 3/2.0 | 1,228 (-15%) | 1mo | $315,000 | $257 | 61 |
| 1085 Tasman Dr #124 | 0.45mi | 3/2.0 | 1,230 (-15%) | 0mo | $315,000 | $256 | 55 |
Match score weights: distance 35% · size 25% · config 20% · recency 20%. Top-matched comps best support the ARV.
Projected returns pro-forma
-3.0% appreciation · 2.63% rent growth · sell at horizon
- IRR
- 26.0%
- Equity multiple
- 2.07×
- Total profit
- $77,903
- Equity at exit
- $38,750
- IRR
- 33.4%
- Equity multiple
- 3.99×
- Total profit
- $217,726
- Equity at exit
- $22,470
Cash invested: $72,769 (down + closing). Projections, not guarantees.
Landlord ↔ Tenant lean methodology
- Overall (STATE)
- 18 Strongly Tenant-Friendly
- State California
- 18 Strongly Tenant-Friendly · D+13
- County
- — inherits STATE
- City
- — inherits STATE
ZIP-level market 94089
- Home prices YoY
- -1.1%
- Rents YoY
- 2.6%
- Active inventory
- 69
- Price-to-rent
- 4.6×
Monthly cashflow live
- Estimated rent
- $4,692 high interval (Pro) →
- Mortgage (P&I)
- −$1,363
- Tax est. 1.5%
- −$325 /mo · $3,898/yr
- Insurance
- −$108
- HOA
- −$0
- Vacancy / Maint / Mgmt
- −$985
- Net cashflow
- $1,911
Break-even live
UW: 25.0% down · 7.5% · 30yr · 1.5% tax · 5.0% vac · 8.0% maint · 8.0% mgmt
Financing live
Cash to close
- Down payment
- $64,972
- Closing costs
- $7,797
- Reserves months
- —
- Total cash needed
- —
Loan-product check · same deal, 3 products live
Conventional
25% down · 7.5% · 30yr
- Down + closing
- —
- Monthly P&I
- —
- Monthly cashflow
- —
- DSCR
- —
- Eligible?
- —
Personal DTI + credit; lowest rate.
DSCR
20% down · 8.5% · 30yr
- Down + closing
- —
- Monthly P&I
- —
- Monthly cashflow
- —
- DSCR
- —
- Eligible?
- —
No personal income docs; deal must DSCR.
Hard money
10% down · 12.0% · 12mo
- Down + closing
- —
- Monthly P&I
- —
- Monthly cashflow
- —
- DSCR
- —
- Eligible?
- —
Short-term bridge; refi at stabilization.
Rent comps 14 comps
| Address | Beds | Baths | Sqft | Rent | $/sqft | DOM | Units | Dist |
|---|---|---|---|---|---|---|---|---|
| 1271 Lawrence Station Rd Sunnyvale, CA | 1.0–2.0 | 1.0–2.5 | 1417 | $5,197 | $3.67 | 1d | 7 | 0.38mi |
| 1235 Wildwood Ave Sunnyvale, CA | 1.0–3.0 | 1.0–2.0 | 910 | $3,377 | $3.71 | 1d | 12 | 0.73mi |
| 1220 N Fair Oaks Ave Sunnyvale, CA | 1.0–2.0 | 1.0–2.0 | 887 | $4,780 | $5.39 | 1d | 4 | 0.87mi |
| 621 Tasman Dr Sunnyvale, CA | 1.0–2.0 | 1.0–2.0 | 959 | $4,557 | $4.75 | 1d | 9 | 0.89mi |
| 725 San Simeon St #1617 Sunnyvale, CA | 3.0 | 2.0 | 1008 | $5,400 | $5.36 | 1d | 1 | 0.91mi |
| 1257 Lakeside Dr Sunnyvale, CA | 3.0 | 1.0–3.0 | 903 | $5,075 | $5.62 | 1d | 1 | 0.96mi |
| 568 Saco Ter Sunnyvale, CA | 4.0 | 3.0 | 1720 | $5,200 | $3.02 | 1d | 1 | 1.03mi |
| 550 E Weddell Dr Sunnyvale, CA | 1.0–3.0 | 1.0–2.0 | 1255 | $5,966 | $4.75 | 1d | 8 | 1.11mi |
| 1030 Indian Wells Ave Sunnyvale, CA | 1.0–2.0 | 1.0–2.0 | 1039 | $6,915 | $6.66 | 1d | 1 | 1.21mi |
| 676 Johanna Ave Unit 2 Sunnyvale, CA | 2.0 | 1.0 | 892 | $2,650 | $2.97 | 1d | 1 | 1.31mi |
| 1063 Morse Ave Sunnyvale, CA | 1.0–2.0 | 1.0–2.0 | 844 | $5,014 | $5.94 | 1d | 14 | 1.31mi |
| 785 N Fair Oaks Ave #8 Sunnyvale, CA | 2.0 | 1.0 | 926 | $3,300 | $3.56 | 10d | 1 | 1.38mi |
| 781 N Fair Oaks Ave #6 Sunnyvale, CA | 3.0 | 2.0 | 1134 | $3,795 | $3.35 | 16d | 1 | 1.39mi |
| 4554 Lakeshore Dr Santa Clara, CA | 2.0 | 1.0 | 944 | $3,195 | $3.38 | 43d | 1 | 1.43mi |
Listing history 7 events
-
2026-06-18days on market $259,888 Active 8 DOM
-
2026-06-17days on market $259,888 Active 7 DOM
-
2026-06-16days on market $259,888 Active 6 DOM
-
2026-06-15days on market $259,888 Active 5 DOM
-
2026-06-13days on market $259,888 Active 3 DOM
-
2026-06-13remarks 699-char remark
-
2026-06-13$259,888 Active 2 DOM
ⓘ Source: listings_history table (triggers on properties + properties_extension) + one-shot
backfill from property_details.listing_events for pre-trigger history.
Climate risk First Street
- Flood 3/10 Moderate FEMA zone X · 20% chance over 30 yrs
- Wildfire 1/10 Low
- Heat 5/10 Major 7 d/yr ≥91°F today · 15 d/yr by 30 yrs out
- Wind 1/10 Low
- Air quality 7/10 Severe 13 unhealthy d/yr today · 13 by 30 yrs out
Nearby sold comps map
Loading sold comps map…
Walkable amenities ~0.75 mi
Loading nearby amenities…
Taxation est. · year 1
- Rental income
- $56,303
- − Mortgage interest
- −$14,558
- − Property taxes
- −$3,898
- − Insurance
- −$1,299
- − Repairs & maintenance
- −$4,504
- − Management
- −$4,504
- − Depreciation
- −$7,560
- Taxable income
- $19,979
- Est. tax owed @ 24.0%
- −$4,795
- After-tax cash flow
- $18,132/yr
For passive investors: Depreciation is non-cash, so a rental often shows a tax loss while cash-flowing — sheltering income. Rental losses are passive: they offset passive income freely, and up to $25,000/yr can offset ordinary (W-2) income if you actively participate and your MAGI is under $100k (phasing out to $0 by $150k); unused losses carry forward. On sale, claimed depreciation is recaptured at up to 25%, and gains may owe capital-gains tax (a 1031 exchange can defer both). Figures are a year-1 estimate at your 24.0% rate — not tax advice; consult a CPA.
Condition & rehab AI · 14 photos
This home is in average condition with cosmetic updates needed, particularly in painting and landscaping. It offers a good location and is move-in ready.
Repairs flagged
- Minor Paint — Paint appears faded on exterior siding and porch.
- Minor Landscaping — Bushes and garden areas could benefit from trimming and maintenance.
Value-add opportunities
- Resale Paint exterior siding — Fresh paint can enhance curb appeal and home value.
- Resale Landscaping improvements — Well-maintained landscaping can increase home value and attract buyers.
Renovation cost estimate screening
| Repair item | Severity | Est. cost |
|---|---|---|
| Paint · Paint appears faded on exterior siding and porch. | Minor | $500–3,000 |
| Landscaping · Bushes and garden areas could benefit from trimming and maintenance. | Minor | $500–3,000 |
| Total estimated repair cost · 2 items | $1,000–6,000 |
Value-add ROI direction
- Resale Paint exterior siding — Fresh paint can enhance curb appeal and home value. ↑
- Resale Landscaping improvements — Well-maintained landscaping can increase home value and attract buyers. ↑
ⓘ Cost ranges are severity-bucket heuristics (US national rule-of-thumb). Get contractor quotes + a written scope before underwriting a rehab budget.
Schools (NCES district)
- District
- Santa Clara Unified
- NCES district ID
- 0635430
- Math proficiency
- 49% ▼ -3.00%
- Reading proficiency
- 66% ▲ 4.00%
- Median HH income
- $97,320
- Composite
- 53.46/100
- National rank
- #1459
- State rank
- #75 of 517 in CA
Livability — Sunnyvale
- Score
- 82/100
- State rank
- #37
- US rank
- #1258
Category grades
Schools grade is shown separately in the Schools card above.
Census & demographics
- Census place
- Sunnyvale, CA
- County
- Santa Clara County · 1,806,974 people
- City population
- 154,236
- Metro
- San Jose-Sunnyvale-Santa Clara, CA
- Population (ZIP)
- 22,699
- Household income
- $158,304
- Rent vs Own
- Severe rent burden
- 558.0
Population outlook (Santa Clara County) Hauer SSP2
- Today (2025)
- 2,179,074 people
- By 2030
- 2,301,297 · +5.6%
- By 2040
- 2,528,195 · +16.0%
- By 2050
- 2,712,135 · +24.5%
- By 2075
- 2,998,701 · +37.6%
- By 2100
- 2,931,429 · +34.5%
Race, ethnicity, and origin ACS 2023
- Neighborhood character
- Diverse neighborhood (Simpson 0.68)
- Race & ethnicity
- Asian 45% White 24% Hispanic / Latino 24% Two or more races 9% Black 2%
- Hispanic origin (detail)
- Mexican 17%
- Common ancestry
- Scotch-Irish 2% Lithuanian 1% Estonian 1%
- Foreign-born
- 51% · Canada, China, Vietnam
- Languages at home
- 40% English-only · Spanish 18% Chinese 12% Other Asian/Pacific 8%
Political lean MEDSL · Santa Clara
- 2024 margin
- Solid D (+40.0) · D 68.1% · R 28.1% · Other 3.8%
- 2008→2024 swing
- -0.9pp no change · 2008: 40.9pp · 2024: 40.0pp
- All cycles
- 2024: D+40.0 2020: D+47.4 2016: D+52.5 2012: D+42.1 2008: D+40.9
Not yet ingested
- Civics
- —
Market trends
- HPI YoY
- ▼ -3.70%
- Current HPI
- 338.6935
- Rent YoY
- ▲ 2.63%
- Metro
- San Jose-Sunnyvale-Santa Clara, CA
- State GDP YoY
- ▲ 3.21%
- F500 in state
- 116
Industry mix (Fortune 500 HQ in CA)
| Industry | F500 HQs | Revenue |
|---|---|---|
| Technology | 27 | $1,492B |
|
||
| Financial Services | 3 | $174B |
|
||
| Retail | 3 | $44B |
|
||
| Insurance | 3 | $26B |
|
||
| Media / Entertainment | 2 | $115B |
|
||
| Pharmaceuticals / Biotech | 2 | $62B |
|
||
Price history
+0.0% since first listed2 events — show timeline
- 2026-06-10 Listed $259,888 MLSListings
- 2026-06-10 Listed $259,888 bridgeMLS, Bay East AOR, or Contra Costa AOR
Cash-flow waterfall
monthlySold comps — $/sqft
last 12 mo · ≤1 miLoading sold comps…