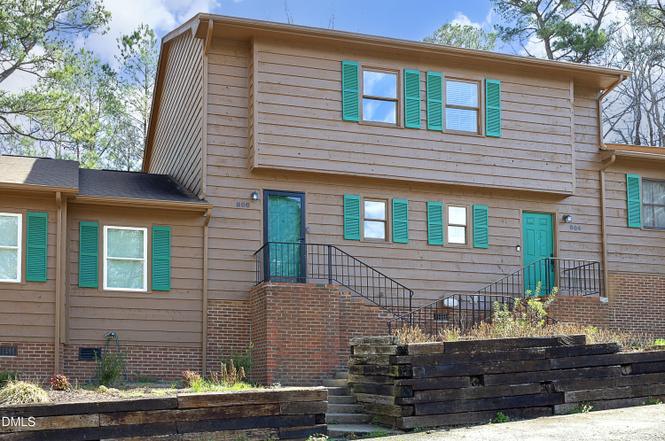
806 Kendall Dr #502 · Durham, NC
Flood risk No data
- FEMA flood zone
- —
- Chance of flooding over 30 yrs
- —
- Est. flood insurance / yr
- —
Fire risk No data
- Est. fire insurance / yr
- —
Heat risk No data
- Hot days now (above threshold)
- —
- Hot days in 30 yrs
- —
Wind risk No data
- Chance of severe wind over 30 yrs
- —
Air-quality risk No data
- Unhealthy air days now
- —
- Unhealthy air days in 30 yrs
- —
Risk factors via First Street. Map © Google.
Why this score? — see what drove the D grade
The composite is a weighted blend of 9 inputs, each scored 0–100. Each bar is that input's sub-score; the figure is the points it added to the 100-point composite (weight × sub-score).
- Cash flow +14.0/30.0
- ARV discount +7.5/15.0
- 1% rule +4.8/10.0
- DSCR +4.3/10.0
- Livability +4.0/5.0
- Schools +3.0/10.0
- Rent growth +2.7/5.0
- Condition / age +2.5/5.0
- Appreciation +0.0/10.0
$164,999
🖨 Deal sheet (PDF) 📄 Offer letter ✓ Due diligence
Listing remarks
Charming 2-bedroom, 2-bath condo in a convenient Durham location! This well-maintained unit offers a comfortable layout with spacious living areas and plenty of natural light. The kitchen provides ample cabinet space and flows nicely into the dining and living areas, making it great for everyday living or entertaining. The primary bedroom features a private bath and generous closet space. Enjoy low-maintenance living with exterior upkeep handled by the homeowners association. Conveniently located near shopping, dining, major highways, and just a short drive to RTP, downtown Durham, and RDU Airport. A great opportunity for homeowners or investors alike. Home is priced with condition in mind
Key facts
- Near shopping
- Private bath
- Ample cabinet space
Tags
Property features AI
Finance
- Other: Private maintained road with asphalt surface; County: Durham
- HOA & community: Condo association (Park Place of Durham Condo Association Inc.); Monthly association fee (maintenance, grounds, management, parking, snow removal); Association fee includes insurance, maintenance of grounds, road maintenance, snow removal
Exterior
- Parking: 2 open parking spaces; Asphalt parking lot / outside parking
- Utilities: Public water; Public sewer; Electricity connected; Cable available; Phone available; Sewer connected; Water connected
- Home design: Two levels; Residence structure; Shingle roof; Wood siding construction; Unit 502 (multi-unit building)
- Construction: Wood siding; Shingle roof; Other structure type
- Exterior features: Deck; Front porch; Balcony; Private entrance; 2+ shared walls; Lot approximately 0.27 acres; Zoned R-10
Interior
- Kitchen: Built-in electric oven; Built-in electric range; Dishwasher; Refrigerator; Stainless steel appliances
- Bedrooms: 2 bedrooms
- Flooring: Laminate / simulated wood flooring
- Bathrooms: 1 full bathroom; 1 half bathroom
- Heating & cooling: Heat pump heating; Central air; Electric cooling; Ceiling fan(s)
- Interior features: Ceiling fan(s); Entrance foyer; Storage; Walk-in closet(s); Bathtub/shower combination; Soaking tub; French doors; Storm door(s); Shutters; Private entrance; Balcony
- Laundry & utility: Washer hookup; Electric dryer hookup; Laundry closet (main level, in hall, inside)
Neighborhood map
What this means for you Summary
Snapshot
- This is a 2-bed/1.5-bath condo listed at $165k.
Deal economics
- At list price, monthly cash flow is $22 ($261/yr) — positive.
- The deal already cash-flows at list — no discount required.
- To meet the 1% rule (rent ≥ 1% of price), the offer needs to be $162k (1.9% below list).
- Recommended offer: $150k (9.0% below list) — sets the bar for market timing.
- Cap rate 6.5% vs local median 3.0% in Durham — top-decile yield for the area; either an underpriced asset or a hidden risk that comps aren't pricing in. Stress-test before assuming the spread holds.
Location & tenants
- Location reads 81/100 on livability (#15 in NC, #1,411 nationally) — a professional / high-income tenant draw. Strengths: amenities A+, commute A+, housing A+; Watch: crime F.
- Durham Public Schools (urban): math 29% / reading 39% proficiency, ranked #132 of 178 in NC (top 74%) — families likely to look elsewhere, expect single-tenant / working-renter base with shorter leases.
- Zoned schools: Pearsontown Elementary (math 64% / reading 73%, grade B+, #111 of 1,410 statewide, top 8%, 726 students, 27% FRL); Neal Middle (math 6% / reading 19%, grade F, #468 of 475 statewide, top 99%, 789 students, 100% FRL); Southern School of Energy And Sustainabi (math 28% / reading 30%, grade F, #465 of 535 statewide, top 87%, 1,283 students, 100% FRL) — zoned schools average 75% FRL vs 58% district-wide (18 pts higher); higher-poverty schools than district average — tighter screening recommended.
- Market conditions: Rents flat; 1122 active listings in the ZIP; 15 comparable units currently listed for rent nearby; rentals at typical pace (median 26d on market — plan ~3-4 weeks tenant-placement turnaround); solid renter incomes; 2,905 units permitted in Durham County in 2024 (955 in 5+ unit buildings).
Forward outlook
- Local home prices are declining (-3.0%/yr); year-one equity from $1k of loan paydown is wiped out by about $5k of value loss. Plan a longer hold.
- Durham County population projected at +44% by 2050 — long-run rental-demand tailwind backs the buy-and-hold thesis.
Negotiation context
- It's been on market 100 days — a 9% lower offer ($150k) is reasonable based on typical stale-listing flexibility.
- Current owner paid $60k; list at $165k implies a 175% gain — meaningful room to come down on a strong offer.
Questions for the listing agent
- It's been on market 100 days. Have you received any prior offers? Is the seller open to a 9% concession, seller financing, or rate buy-down credit?
- What does the HOA fee cover, when was the last increase, and are there any pending special assessments or reserve-fund shortfalls?
- Any open or pending special assessments — roof, HVAC, plumbing, elevator, façade? What's the per-unit balance and payoff schedule, and is the seller paying it off at close or rolling it to the buyer?
- Why hasn't it sold? Are there any deal-killer items the seller is aware of (foundation, flood, title, zoning, code violations)?
- Is there a deadline driving the sale (1031 exchange, divorce, estate, relocation)? That informs how much negotiation room exists.
- Schools are D-rated, which usually means shorter tenancies and higher turnover. Who's the typical renter profile here, and what's been the actual vacancy rate?
- Crime grade is F in this area — have there been break-ins, vandalism, or insurance claims at this property in the last 3 years? What carrier currently insures it and at what premium?
- The area grade is low — what's the realistic commute time and amenity access for the typical tenant pool here? Any planned neighborhood developments (good or bad) we should know about?
- What's the average days-on-market for RENTAL listings here right now (not sales)? A rising rental-DOM trend means longer vacancies and softer asking-rent achievability than the comps imply.
- What's the recent tenant-quality profile in this submarket — average credit score on applications, eviction rate, late-payment / NSF rate, and stable-employment percentage? A property-management company in the area should have these aggregated.
- How much new apartment / multifamily construction is in the pipeline within 1–3 miles? Heavy new supply (>2% of stock underway) typically softens rents 12–24 months out; light construction supports rent growth.
Investment metrics
- 1% rule
- 0.98% ✗
- Cap rate
- 6.45%
- Cash-on-cash
- 0.56%
- DSCR
- 1.03
- GRM
- 8.5
CMA / ARV
No comps found within radius.
Projected returns pro-forma
-3.0% appreciation · 0.84% rent growth · sell at horizon
- IRR
- -18.0%
- Equity multiple
- 0.38×
- Total profit
- $-28,698
- Equity at exit
- $24,602
- IRR
- -15.6%
- Equity multiple
- 0.21×
- Total profit
- $-36,343
- Equity at exit
- $14,266
Cash invested: $46,200 (down + closing). Projections, not guarantees.
Landlord ↔ Tenant lean methodology
- Overall (STATE)
- 85 Strongly Landlord-Friendly
- State North Carolina
- 85 Strongly Landlord-Friendly · R+3
- County
- — inherits STATE
- City
- — inherits STATE
ZIP-level market 27703
- Rents YoY
- 0.8%
- Active inventory
- 1122
- Price-to-rent
- 8.5×
Monthly cashflow live
- Estimated rent
- $1,618 high interval (Pro) →
- Mortgage (P&I)
- −$865
- Tax from tax record
- −$122 /mo · $1,469/yr
- Insurance
- −$69
- HOA
- −$200
- Vacancy / Maint / Mgmt
- −$340
- Net cashflow
- $22
Break-even live
Sensitivity live
| Price | -10% $115 | -5% $68 | +0% $22 | +5% $-25 | +10% $-72 |
|---|---|---|---|---|---|
| Rent | -10% $-106 | -5% $-42 | +0% $22 | +5% $86 | +10% $150 |
| Rate | -1.0pp $105 | -0.5pp $64 | base $22 | +0.5pp $-21 | +1.0pp $-65 |
UW: 25.0% down · 7.5% · 30yr · 1.5% tax · 5.0% vac · 8.0% maint · 8.0% mgmt
Financing live
Cash to close
- Down payment
- $41,250
- Closing costs
- $4,950
- Reserves months
- —
- Total cash needed
- —
Loan-product check · same deal, 3 products live
Conventional
25% down · 7.5% · 30yr
- Down + closing
- —
- Monthly P&I
- —
- Monthly cashflow
- —
- DSCR
- —
- Eligible?
- —
Personal DTI + credit; lowest rate.
DSCR
20% down · 8.5% · 30yr
- Down + closing
- —
- Monthly P&I
- —
- Monthly cashflow
- —
- DSCR
- —
- Eligible?
- —
No personal income docs; deal must DSCR.
Hard money
10% down · 12.0% · 12mo
- Down + closing
- —
- Monthly P&I
- —
- Monthly cashflow
- —
- DSCR
- —
- Eligible?
- —
Short-term bridge; refi at stabilization.
Rent comps 15 comps
| Address | Beds | Baths | Sqft | Rent | $/sqft | DOM | Units | Dist |
|---|---|---|---|---|---|---|---|---|
| 612 Kendall Dr Durham, NC | 2.0 | 2.0 | 970 | $1,325 | $1.37 | 25d | 1 | 0.03mi |
| 1218 Kendall Dr Durham, NC | 3.0 | 2.5 | 1408 | $1,820 | $1.29 | 25d | 1 | 0.20mi |
| 3290 Ivey Wood Ln Unit 1 Durham, NC | 2.0 | 2.5 | 1150 | $1,495 | $1.30 | 25d | 1 | 0.26mi |
| 3290 Ivey Wood Ln Durham, NC | 2.0 | 3.0 | 1150 | $1,495 | $1.30 | 25d | 1 | 0.26mi |
| 3004 Forrestal Dr Durham, NC | 3.0 | 3.0 | 1500 | $1,875 | $1.25 | 25d | 1 | 0.27mi |
| 3262 Ivey Wood Ln Unit 1 Durham, NC | 3.0 | 2.5 | 1380 | $1,675 | $1.21 | 16d | 1 | 0.31mi |
| 818 Riverbark Ln Durham, NC | 3.0 | 2.0 | 1252 | $1,875 | $1.50 | 25d | 1 | 0.37mi |
| 3004 Ivey Wood Ln Durham, NC | 2.0–3.0 | 1.0–2.0 | 988 | $1,399 | $1.42 | 16d | 12 | 0.41mi |
| 3107 Ivey Wood Ln Durham, NC | 2.0 | 1.5 | 1008 | $1,625 | $1.61 | 25d | 1 | 0.44mi |
| 3216 Hursey St Durham, NC | 2.0 | 2.0 | 1064 | $1,700 | $1.60 | 16d | 1 | 0.64mi |
| 205 Spring St Durham, NC | 1.0 | 1.0 | 785 | $1,400 | $1.78 | 25d | 1 | 0.80mi |
| 419 Walton St Durham, NC | 3.0 | 1.5 | 1212 | $1,595 | $1.32 | 16d | 1 | 0.93mi |
| 122 Cushman St Durham, NC | 3.0 | 1.0 | 1000 | $1,650 | $1.65 | 25d | 1 | 1.01mi |
| 70 Lynn Rd Durham, NC | 1.0–3.0 | 1.0–2.0 | 1019 | $1,441 | $1.41 | 25d | 1 | 1.35mi |
| 401 Sparella St Durham, NC | 3.0 | 2.0 | 1046 | $1,620 | $1.55 | 16d | 1 | 1.40mi |
HOA detail condo
- Monthly dues
- $200 · $2,400/yr
- Assessments
- None detected in remarks — confirm with the listing agent.
Listing history 20 events
-
2026-06-22days on market $164,999 Active 100 DOM
-
2026-06-18days on market $164,999 Active 97 DOM
-
2026-06-17days on market $164,999 Active 96 DOM
-
2026-06-16pricedays on market $164,999 Active 95 DOM
-
2026-06-15days on market $169,999 Active 94 DOM
-
2026-06-14days on market $169,999 Active 92 DOM
-
2026-06-10days on market $169,999 Active 89 DOM
-
2026-06-09days on market $169,999 Active 88 DOM
-
2026-06-08days on market $169,999 Active 87 DOM
-
2026-06-07days on market $169,999 Active 86 DOM
-
2026-06-05days on market $169,999 Active 83 DOM
-
2026-06-03days on market $169,999 Active 82 DOM
-
2026-06-02days on market $169,999 Active 81 DOM
-
2026-06-01days on market $169,999 Active 80 DOM
-
2026-05-31days on market $169,999 Active 79 DOM
-
2026-05-30days on market $169,999 Active 78 DOM
-
2026-05-11price $169,999
-
2026-03-12$175,000 Active
-
1995-10-03soldstatus $60,000
-
1995-10-03soldstatus $60,000
ⓘ Source: listings_history table (triggers on properties + properties_extension) + one-shot
backfill from property_details.listing_events for pre-trigger history.
Tax reassessment forecast NC · Resets to sale price
- Current annual tax
- $1,469 · $122/mo
- Projected year-2 tax
- $1,469 · $122/mo
- Expected delta
- $0/yr ($0/mo · 0.0%)
ⓘ Screening estimate from a state-policy table — verify with the county assessor before closing.
Nearby sold comps map
Loading sold comps map…
Walkable amenities ~0.75 mi
Loading nearby amenities…
Taxation est. · year 1
- Rental income
- $19,415
- − Mortgage interest
- −$9,243
- − Property taxes
- −$1,469
- − Insurance
- −$825
- − Repairs & maintenance
- −$1,553
- − Management
- −$1,553
- − HOA
- −$2,400
- − Depreciation
- −$4,800
- Taxable loss
- −$2,427
- Est. tax savings @ 24.0%
- +$583
- After-tax cash flow
- $844/yr
For passive investors: Depreciation is non-cash, so a rental often shows a tax loss while cash-flowing — sheltering income. Rental losses are passive: they offset passive income freely, and up to $25,000/yr can offset ordinary (W-2) income if you actively participate and your MAGI is under $100k (phasing out to $0 by $150k); unused losses carry forward. On sale, claimed depreciation is recaptured at up to 25%, and gains may owe capital-gains tax (a 1031 exchange can defer both). Figures are a year-1 estimate at your 24.0% rate — not tax advice; consult a CPA.
Schools (NCES district)
- District
- Durham Public Schools
- NCES district ID
- 3701260
- Math proficiency
- 29% ▼ -3.00%
- Reading proficiency
- 39% ▲ 2.00%
- Median HH income
- $52,143
- Composite
- 29.69/100
- National rank
- #6457
- State rank
- #132 of 178 in NC
Livability — Durham
- Score
- 81/100
- State rank
- #15
- US rank
- #1411
Category grades
Schools grade is shown separately in the Schools card above.
Census & demographics
- Census place
- Durham, NC
- County
- Durham County · 288,747 people
- City population
- 288,747
- Metro
- Durham-Chapel Hill, NC
- Population (ZIP)
- 63,458
- Household income
- $89,317
- Rent vs Own
- Severe rent burden
- 1685.0
Population outlook (Durham County) Hauer SSP2
- Today (2025)
- 368,962 people
- By 2030
- 402,686 · +9.1%
- By 2040
- 468,677 · +27.0%
- By 2050
- 531,727 · +44.1%
- By 2075
- 660,446 · +79.0%
- By 2100
- 739,971 · +100.6%
Race, ethnicity, and origin ACS 2023
- Neighborhood character
- Diverse neighborhood (Simpson 0.70)
- Race & ethnicity
- Black 40% White 32% Hispanic / Latino 20% Two or more races 9% Asian 5%
- Hispanic origin (detail)
- Mexican 11% Puerto Rican 1%
- Common ancestry
- Swiss 2% Romanian 2% Italian 1%
- Foreign-born
- 15% · Canada, Vietnam, China
- Languages at home
- 77% English-only · Spanish 17% Other Asian/Pacific 1% Other Indo-European 1%
Political lean MEDSL · Durham
- 2024 margin
- Solid D (+61.9) · D 80.2% · R 18.2% · Other 1.6%
- 2008→2024 swing
- +10.0pp toward D · 2008: 51.9pp · 2024: 61.9pp
- All cycles
- 2024: D+61.9 2020: D+62.4 2016: D+60.4 2012: D+52.7 2008: D+51.9
Not yet ingested
- Civics
- —
Market trends
- HPI YoY
- ▼ -129.81%
- Current HPI
- 206.7413
- Rent YoY
- ▲ 0.84%
- Metro
- Durham-Chapel Hill, NC
- State GDP YoY
- ▲ 3.28%
- F500 in state
- 26
Industry mix (Fortune 500 HQ in NC)
| Industry | F500 HQs | Revenue |
|---|---|---|
| Financial Services | 2 | $213B |
|
||
| Retail | 2 | $95B |
|
||
| Industrial Conglomerate | 1 | $38B |
|
||
| Metals / Steel | 1 | $35B |
|
||
| Utilities | 1 | $30B |
|
||
| Industrial Machinery | 1 | $19B |
|
||
Price history
+183.3% since first listed4 events — show timeline
- 2026-05-11 Price Changed $169,999 TMLS
- 2026-03-12 Listed $175,000 TMLS
- 1995-10-03 Sold (Public Records) $60,000 Public Records
- 1995-10-03 Sold (Public Records) $60,000 Public Records
Property tax history
+3.0%/yrLatest (2025): $1,469 · +74.5% YoY. Source: county tax records.
Cash-flow waterfall
monthlySold comps — $/sqft
last 12 mo · ≤1 miLoading sold comps…