 🏷️ Likely Rental
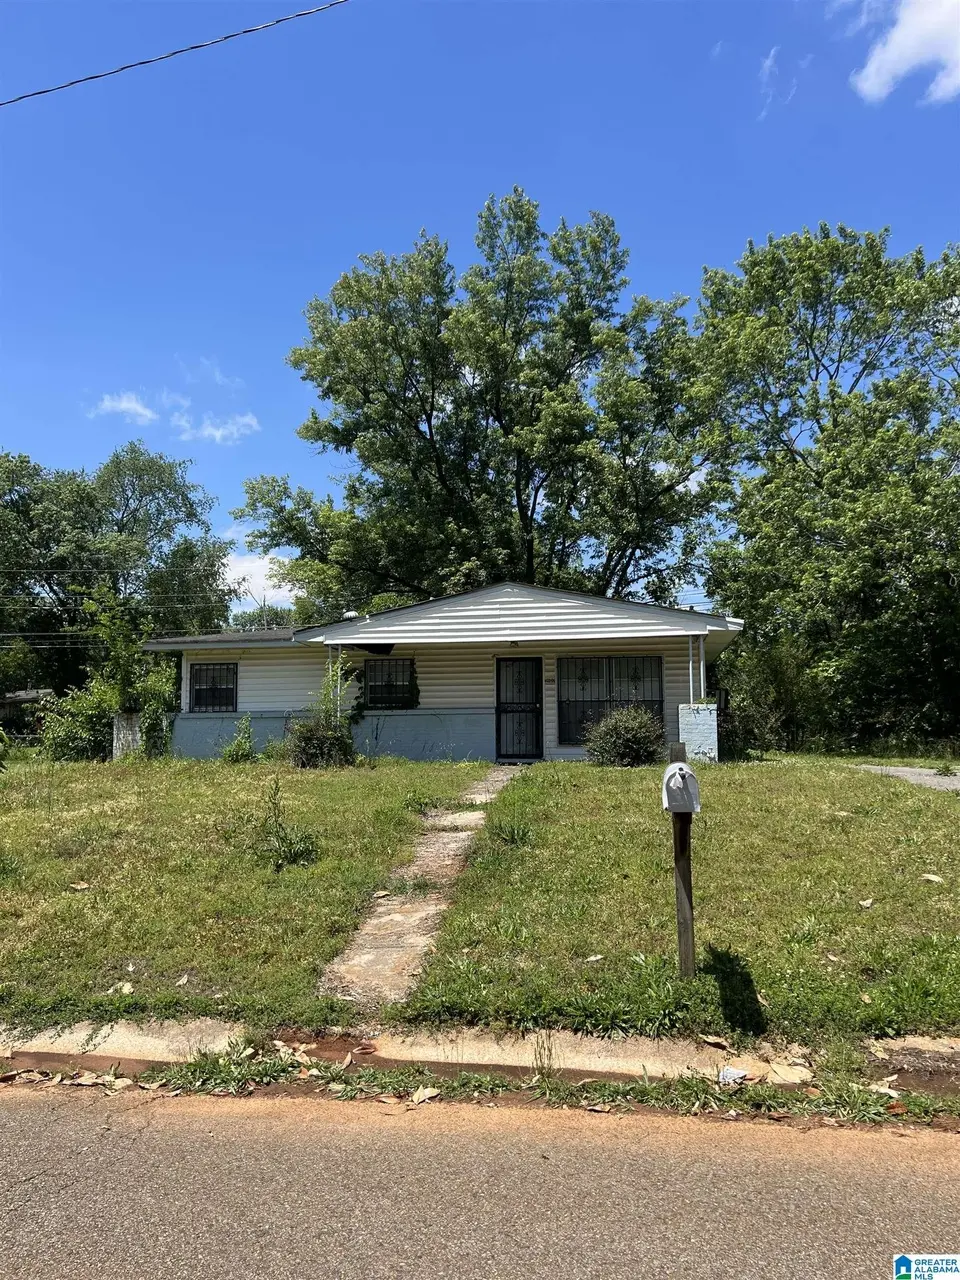
3807 Colton Ln NE · Huntsville, AL
Flood risk 1/10 · Minimal
- FEMA flood zone
- X (unshaded)
- Chance of flooding over 30 yrs
- 0.0%
- Est. flood insurance / yr
- $507 – $1,088
Fire risk 1/10 · Minimal
- Est. fire insurance / yr
- $916 – $1,700
Heat risk 5/10 · Moderate
- Hot days now (above 104°F)
- 7 days/yr
- Hot days in 30 yrs
- 19 days/yr
Wind risk 4/10 · Minor
- Chance of severe wind over 30 yrs
- 16.0%
Air-quality risk 2/10 · Minimal
- Unhealthy air days now
- 1 days/yr
- Unhealthy air days in 30 yrs
- 1 days/yr
Risk factors via First Street. Map © Google.
Why this score? — see what drove the B+ grade
The composite is a weighted blend of 9 inputs, each scored 0–100. Each bar is that input's sub-score; the figure is the points it added to the 100-point composite (weight × sub-score).
- Cash flow +30.0/30.0
- ARV discount +15.0/15.0
- DSCR +10.0/10.0
- 1% rule +7.6/10.0
- Rent growth +4.2/5.0
- Livability +4.1/5.0
- Schools +2.9/10.0
- Condition / age +2.5/5.0
- Appreciation +1.4/10.0
$99,000
🖨 Deal sheet (PDF) 📄 Offer letter ✓ Due diligence
Listing remarks
MOTIVATED SELLER. PROPERTY BEING SOLD AS IS. 3 bedrooms 1 bath 840 sqft Area sales around $170k Estimated rent around $1,200/month The house does need some work, but it’s not far off from being livable either. Could make a solid rental play in one of the fastest-growing cities around! Alabama A & M is basically right up the street. Huntsville keeps bringing in aerospace jobs, tech jobs, and new people every day. They literally build rockets out here! This ain’t no fancy HGTV flip type house. This is more for somebody looking at long-term rental income and upside!
Key facts
- 9,147 sq ft lot
- Built 1959
- Listed 22 days
Property features AI
Finance
- Financial info: No investor or income/expense details provided
- HOA & community: No association fees
Exterior
- Parking: Driveway parking
- Security: No security features listed
- Utilities: Public water; Septic sewer; Underground utilities; Internet availability unknown
- Home design: Existing construction; Single-story entry (all main-level rooms listed)
- Construction: Wood construction; Slab foundation
- Exterior features: Not waterfront; No pool; No patio; No deck; No garden/patio
Interior
- Kitchen: Kitchen on the main level
- Bedrooms: Three bedrooms on the main level
- Flooring: Slate flooring
- Bathrooms: One full bathroom
- Heating & cooling: No central heat; Window air conditioning units
- Interior features: 840 sq ft main living area; Ceilings: Other (see remarks); No additional interior features listed
- Laundry & utility: No laundry details provided
Neighborhood map
What this means for you Summary
Snapshot
- This is a 3-bed/1.0-bath single-family listed at $99k.
Deal economics
- At list price, monthly cash flow is $389 ($5k/yr) — positive.
- The deal already cash-flows at list — no discount required.
- Meets the 1% rule at list price ($1k rent vs $99k).
- Recommended offer: $98k (1.5% below list) — sets the bar for market timing.
- Cap rate 11.0% vs local median 3.8% in Huntsville — top-decile yield for the area; either an underpriced asset or a hidden risk that comps aren't pricing in. Stress-test before assuming the spread holds.
Location & tenants
- Location reads 82/100 on livability (#3 in AL, #1,082 nationally) — a professional / high-income tenant draw. Strengths: commute A+, cost of living A+, housing A+; Watch: crime F.
- Huntsville City (urban): math 21% / reading 46% proficiency, ranked #48 of 129 in AL (top 37%) — families likely to look elsewhere, expect single-tenant / working-renter base with shorter leases.
- Zoned schools: Martin Luther King Jr Elementary School (math 4% / reading 18%, grade F, #560 of 627 statewide, top 90%, 464 students, 89% FRL); Lee High School (math 2% / reading 17%, grade F, #252 of 305 statewide, top 84%, 840 students, 77% FRL) — zoned schools average 83% FRL vs 46% district-wide (36 pts higher); higher-poverty schools than district average — tighter screening recommended.
- Zoned-school proficiency averages 10% at this address vs 34% district-wide (-23 pts) — the specific schools serving this property underperform the Huntsville City average; the district grade overstates school quality for this exact location.
- Market conditions: Rents rising fast (+6.8%/yr); 560 active listings in the ZIP; 15 comparable units currently listed for rent nearby; rentals at typical pace (median 25d on market — plan ~3-4 weeks tenant-placement turnaround); 47% of comp listings sitting > 30 days — soft ceiling on asking rent; solid renter incomes; 4,709 units permitted in Madison County in 2024 (1,186 in 5+ unit buildings).
- This rent is only 16% of the median local income ($91k/yr) — well below the 30% rent-burden line; pricing power to push rent on renewal without tenant pushback.
Forward outlook
- Local home prices are declining (-3.0%/yr); year-one equity from $684 of loan paydown is wiped out by about $3k of value loss. Plan a longer hold.
- Madison County population projected at +18% by 2050 — long-run rental-demand tailwind backs the buy-and-hold thesis.
- At projected returns (-3.0% appreciation + 6.8% rent growth), your $28k cash investment doubles in ~6 years — after that, you're playing with house money.
Negotiation context
- It's been on market 22 days — a 2% lower offer ($98k) is reasonable based on typical stale-listing flexibility.
Risks & watch-outs
- Watch-outs: built in 1959 — expect roof / HVAC / electrical / plumbing capex.
- Climate carrying-cost: extreme-heat days projected 7→19/yr by 2055 (HVAC capex compounding) — expect insurance premiums to compound above CPI over the hold.
Questions for the listing agent
- Built in 1959 — when were the roof, HVAC, electrical panel, plumbing, and water heater last replaced?
- Is there a deadline driving the sale (1031 exchange, divorce, estate, relocation)? That informs how much negotiation room exists.
- Crime grade is F in this area — have there been break-ins, vandalism, or insurance claims at this property in the last 3 years? What carrier currently insures it and at what premium?
- What's the average days-on-market for RENTAL listings here right now (not sales)? A rising rental-DOM trend means longer vacancies and softer asking-rent achievability than the comps imply.
- What's the recent tenant-quality profile in this submarket — average credit score on applications, eviction rate, late-payment / NSF rate, and stable-employment percentage? A property-management company in the area should have these aggregated.
- How much new for-sale + rental construction is in the pipeline within 1–3 miles? Heavy new supply typically softens prices + rents 12–24 months out; constrained supply supports both.
Investment metrics
- 1% rule
- 1.26% ✓
- Cap rate
- 11.01%
- Cash-on-cash
- 16.84%
- DSCR
- 1.75
- GRM
- 6.6
CMA / ARV
- ARV (median comp)
- $150,799
- List price
- $99,000
- Delta
- -34.35%
- Verdict
- UNDERPRICED
- Comps
- 20 within 1.0 mi
Show comp detail 7 sales within ~0.75 mi
| Address | Dist | Beds/Ba | Sqft | Sold | Price | $/sf | Match |
|---|---|---|---|---|---|---|---|
| 153 Wilkenson Dr NE | 0.04mi | 3/1.0 | 864 (+3%) | 12mo | $162,500 | $188 | 83 |
| 133 Wilkenson Dr NE | 0.15mi | 3/1.0 | 864 (+3%) | 8mo | $145,000 | $168 | 81 |
| 3807 Melody Rd NE | 0.13mi | 3/1.0 | 920 (+10%) | 3mo | $151,000 | $164 | 76 |
| 203 Victory Ln NE | 0.09mi | 3/1.0 | 925 (+10%) | 8mo | $166,000 | $179 | 73 |
| 3815 Colton Ln NE | 0.06mi | 3/1.0 | 900 (+7%) | 21mo | $179,900 | $200 | 68 |
| 172 Wilkenson Dr NE | 0.17mi | 3/1.0 | 884 (+5%) | 20mo | $145,000 | $164 | 67 |
| 3803 Melody Rd NE | 0.11mi | 3/1.0 | 931 (+11%) | 20mo | $162,900 | $175 | 60 |
Match score weights: distance 35% · size 25% · config 20% · recency 20%. Top-matched comps best support the ARV.
Projected returns pro-forma
-3.0% appreciation · 6.81% rent growth · sell at horizon
- IRR
- 11.9%
- Equity multiple
- 1.49×
- Total profit
- $13,670
- Equity at exit
- $14,761
- IRR
- 23.5%
- Equity multiple
- 3.37×
- Total profit
- $65,723
- Equity at exit
- $8,560
Cash invested: $27,720 (down + closing). Projections, not guarantees.
Landlord ↔ Tenant lean methodology
- Overall (STATE)
- 90 Strongly Landlord-Friendly
- State Alabama
- 90 Strongly Landlord-Friendly · R+15
- County
- — inherits STATE
- City
- — inherits STATE
ZIP-level market 35811
- Home prices YoY
- -2.1%
- Rents YoY
- 6.8%
- Active inventory
- 560
- Price-to-rent
- 6.6×
Monthly cashflow live
- Estimated rent
- $1,248 high interval (Pro) →
- Mortgage (P&I)
- −$519
- Tax from tax record
- −$37 /mo · $441/yr
- Insurance
- −$41
- HOA
- −$0
- Vacancy / Maint / Mgmt
- −$262
- Net cashflow
- $389
Break-even live
Sensitivity live
| Price | -10% $445 | -5% $417 | +0% $389 | +5% $361 | +10% $333 |
|---|---|---|---|---|---|
| Rent | -10% $290 | -5% $340 | +0% $389 | +5% $438 | +10% $488 |
| Rate | -1.0pp $439 | -0.5pp $414 | base $389 | +0.5pp $363 | +1.0pp $337 |
UW: 25.0% down · 7.5% · 30yr · 1.5% tax · 5.0% vac · 8.0% maint · 8.0% mgmt
Financing live
Cash to close
- Down payment
- $24,750
- Closing costs
- $2,970
- Reserves months
- —
- Total cash needed
- —
Loan-product check · same deal, 3 products live
Conventional
25% down · 7.5% · 30yr
- Down + closing
- —
- Monthly P&I
- —
- Monthly cashflow
- —
- DSCR
- —
- Eligible?
- —
Personal DTI + credit; lowest rate.
DSCR
20% down · 8.5% · 30yr
- Down + closing
- —
- Monthly P&I
- —
- Monthly cashflow
- —
- DSCR
- —
- Eligible?
- —
No personal income docs; deal must DSCR.
Hard money
10% down · 12.0% · 12mo
- Down + closing
- —
- Monthly P&I
- —
- Monthly cashflow
- —
- DSCR
- —
- Eligible?
- —
Short-term bridge; refi at stabilization.
Rent comps 15 comps
| Address | Beds | Baths | Sqft | Rent | $/sqft | DOM | Units | Dist |
|---|---|---|---|---|---|---|---|---|
| 3330 Meridian St N Huntsville, AL | 2.0 | 1.0 | 800 | $700 | $0.88 | 14d | 1 | 0.54mi |
| 3328 Meridian St N Apt 114 Huntsville, AL | 2.0 | 1.0 | 800 | $600 | $0.75 | 14d | 1 | 0.56mi |
| 203 N Plymouth Rd NW Huntsville, AL | 2.0 | 1.0 | 796 | $1,310 | $1.65 | 14d | 1 | 0.79mi |
| 4005 Memorial Pkwy NW Huntsville, AL | 3.0 | 1.0 | 1100 | $1,375 | $1.25 | 44d | 1 | 1.02mi |
| 3707 Lakewood Dr NW Huntsville, AL | 3.0 | 1.0 | 1100 | $1,100 | $1.00 | 44d | 1 | 1.02mi |
| 4130 High Mountain Rd NE Huntsville, AL | 1.0–3.0 | 1.0–2.0 | 1119 | $2,061 | $1.84 | 44d | 129 | 1.09mi |
| 2107 Epworth Dr NE Unit H Huntsville, AL | 2.0 | 1.5 | 875 | $1,175 | $1.34 | 14d | 1 | 1.14mi |
| 2117 Griffith Dr NW Huntsville, AL | 3.0 | 1.0 | 1000 | $1,095 | $1.09 | 24d | 1 | 1.22mi |
| 102 Winchester Rd NW Huntsville, AL | 2.0 | 1.0 | 850 | $1,110 | $1.31 | 44d | 4 | 1.28mi |
| 2809 Academy Dr NW Huntsville, AL | 2.0 | 1.5 | 900 | $950 | $1.06 | 44d | 1 | 1.32mi |
| 621 Murray Rd NW Huntsville, AL | 3.0 | 1.5 | 1008 | $1,325 | $1.31 | 14d | 1 | 1.35mi |
| 522 Lisa Ln NW Huntsville, AL | 4.0 | 3.0 | 1025 | $1,695 | $1.65 | 44d | 1 | 1.38mi |
| 2207 Norwood Dr NW Huntsville, AL | 3.0 | 1.0 | 1020 | $1,295 | $1.27 | 14d | 1 | 1.39mi |
| 2200 Norwood Dr NW Huntsville, AL | 3.0 | 1.0 | 1060 | $1,150 | $1.08 | 24d | 1 | 1.43mi |
| 2601 Academy Dr NW Huntsville, AL | 2.0–4.0 | 1.0–2.0 | 971 | $1,262 | $1.30 | 44d | 1 | 1.47mi |
Listing history 7 events
-
2026-06-07statusdays on market $99,000 Pending 22 DOM
-
2026-06-03days on market $99,000 Active 20 DOM
-
2026-06-02days on market $99,000 Active 19 DOM
-
2026-06-01days on market $99,000 Active 18 DOM
-
2026-05-31days on market $99,000 Active 17 DOM
-
2026-05-30days on market $99,000 Active 16 DOM
-
2026-05-13$119,900 Active 607-char remark
ⓘ Source: listings_history table (triggers on properties + properties_extension) + one-shot
backfill from property_details.listing_events for pre-trigger history.
Tax reassessment forecast AL · Resets to sale price
- Current annual tax
- $441 · $37/mo
- Projected year-2 tax
- $441 · $37/mo
- Expected delta
- $0/yr ($0/mo · 0.0%)
ⓘ Screening estimate from a state-policy table — verify with the county assessor before closing.
Climate risk First Street
- Flood 1/10 Low FEMA zone X (unshaded) · 0% chance over 30 yrs
- Wildfire 1/10 Low
- Heat 5/10 Major 7 d/yr ≥104°F today · 19 d/yr by 30 yrs out
- Wind 4/10 Moderate 16% chance of damaging wind over 30 yrs
- Air quality 2/10 Low 1 unhealthy d/yr today · 1 by 30 yrs out
Nearby sold comps map
Loading sold comps map…
Walkable amenities ~0.75 mi
Loading nearby amenities…
Taxation est. · year 1
- Rental income
- $14,980
- − Mortgage interest
- −$5,546
- − Property taxes
- −$441
- − Insurance
- −$495
- − Repairs & maintenance
- −$1,198
- − Management
- −$1,198
- − Depreciation
- −$2,880
- Taxable income
- $3,222
- Est. tax owed @ 24.0%
- −$773
- After-tax cash flow
- $3,895/yr
For passive investors: Depreciation is non-cash, so a rental often shows a tax loss while cash-flowing — sheltering income. Rental losses are passive: they offset passive income freely, and up to $25,000/yr can offset ordinary (W-2) income if you actively participate and your MAGI is under $100k (phasing out to $0 by $150k); unused losses carry forward. On sale, claimed depreciation is recaptured at up to 25%, and gains may owe capital-gains tax (a 1031 exchange can defer both). Figures are a year-1 estimate at your 24.0% rate — not tax advice; consult a CPA.
Schools (NCES district)
- District
- Huntsville City
- NCES district ID
- 0101800
- Math proficiency
- 21% ▼ -23.00%
- Reading proficiency
- 46% ▬ 0.00%
- Median HH income
- $48,264
- Composite
- 28.84/100
- National rank
- #6647
- State rank
- #48 of 129 in AL
Livability — Huntsville
- Score
- 82/100
- State rank
- #3
- US rank
- #1082
Category grades
Schools grade is shown separately in the Schools card above.
Census & demographics
- Census place
- Huntsville, AL
- County
- Madison County · 380,832 people
- City population
- 220,435
- Metro
- Huntsville, AL
- Population (ZIP)
- 31,008
- Household income
- $90,812
- Rent vs Own
- Severe rent burden
- 517.0
Population outlook (Madison County) Hauer SSP2
- Today (2025)
- 392,086 people
- By 2030
- 409,788 · +4.5%
- By 2040
- 440,557 · +12.4%
- By 2050
- 460,990 · +17.6%
- By 2075
- 502,872 · +28.3%
- By 2100
- 513,623 · +31.0%
Race, ethnicity, and origin ACS 2023
- Neighborhood character
- Majority White (64%)
- Race & ethnicity
- White 64% Black 27% Two or more races 5% Hispanic / Latino 3% Asian 2%
- Common ancestry
- Slovak 2% Italian 2% Serbian 2%
- Foreign-born
- 4% · Canada, Vietnam, China
- Languages at home
- 95% English-only · Spanish 3% Vietnamese 1%
Political lean MEDSL · Madison
- 2024 margin
- Lean R (+9.0) · D 44.7% · R 53.7% · Other 1.6%
- 2008→2024 swing
- +6.0pp toward D · 2008: -14.9pp · 2024: -9.0pp
- All cycles
- 2024: R+9.0 2020: R+8.0 2016: R+16.8 2012: R+18.7 2008: R+14.9
Not yet ingested
- Civics
- —
Market trends
- HPI YoY
- ▼ -7.13%
- Current HPI
- 332.9423
- Rent YoY
- ▲ 6.81%
- Metro
- Huntsville, AL
- State GDP YoY
- ▲ 2.94%
- F500 in state
- 4
Industry mix (Fortune 500 HQ in AL)
| Industry | F500 HQs | Revenue |
|---|---|---|
| Financial Services | 1 | $8B |
|
||
| Healthcare | 1 | $5B |
|
||
Price history
-17.4% since first listed3 events — show timeline
- 2026-06-05 Pending — Greater Alabama MLS
- 2026-05-20 Price Changed $99,000 Greater Alabama MLS
- 2026-05-13 Listed $119,900 Greater Alabama MLS
Property tax history
+11.8%/yrLatest (2024): $441 · +20.4% YoY. Source: county tax records.
Cash-flow waterfall
monthlySold comps — $/sqft
last 12 mo · ≤1 miLoading sold comps…