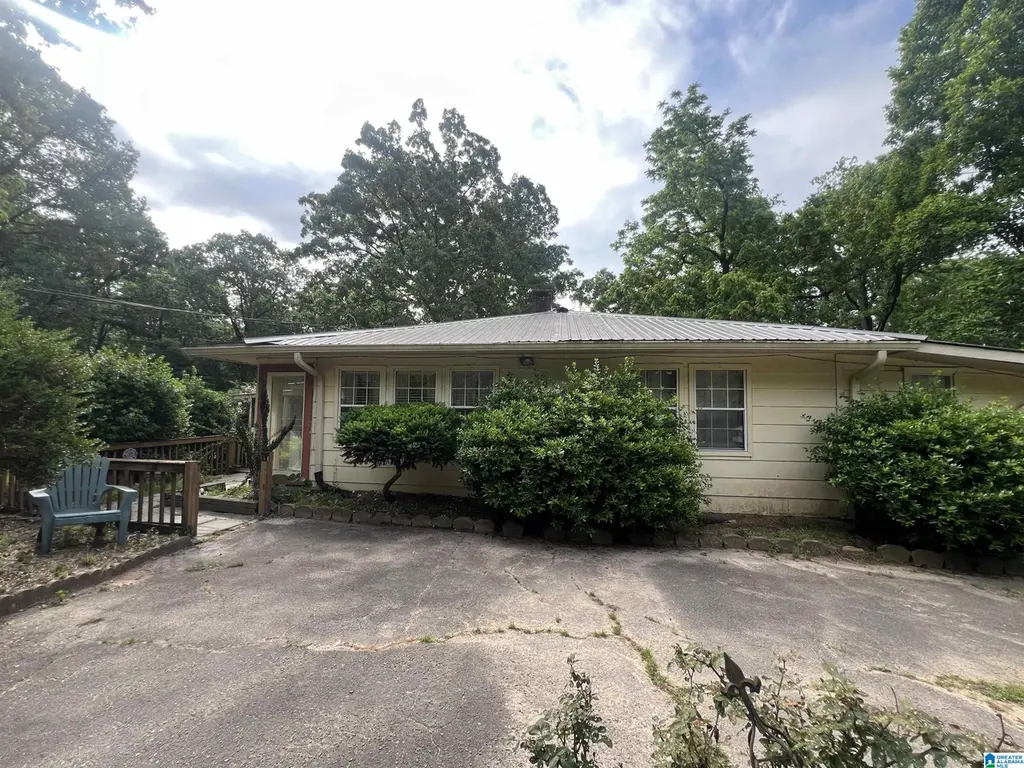
3334 Smith Sims Rd · Trussville, AL
Flood risk 1/10 · Minimal
- FEMA flood zone
- X (unshaded)
- Chance of flooding over 30 yrs
- 0.0%
- Est. flood insurance / yr
- $473 – $860
Fire risk 5/10 · Moderate
- Est. fire insurance / yr
- $916 – $1,700
Heat risk 5/10 · Moderate
- Hot days now (above 106°F)
- 6 days/yr
- Hot days in 30 yrs
- 16 days/yr
Wind risk 6/10 · Moderate
- Chance of severe wind over 30 yrs
- 27.0%
Air-quality risk 4/10 · Minor
- Unhealthy air days now
- 6 days/yr
- Unhealthy air days in 30 yrs
- 7 days/yr
Risk factors via First Street. Map © Google.
Why this score? — see what drove the C+ grade
The composite is a weighted blend of 9 inputs, each scored 0–100. Each bar is that input's sub-score; the figure is the points it added to the 100-point composite (weight × sub-score).
- Cash flow +26.3/30.0
- DSCR +8.9/10.0
- ARV discount +7.5/15.0
- 1% rule +6.1/10.0
- Schools +5.5/10.0
- Livability +4.0/5.0
- Rent growth +2.5/5.0
- Condition / age +2.5/5.0
- Appreciation +0.0/10.0
$189,900
🖨 Deal sheet 📄 Offer letter ✓ Due diligence
Listing remarks
Sitting on just over 2 acres in desirable Trussville schools, this property is nothing but potential! There is so much interior space with endless layout possibilities just waiting on someone with the right vision to bring it back to life. Whether you are an investor, renovator, or buyer looking for acreage and space to grow, this property offers that and more plus the convenience of all that Trussville has to offer. With plenty of room inside and out, the possibilities are endless for making this home into something truly special. Call today to schedule your private showing!
Key facts
- 2 acre lot
- Built 1945
- Listed 43 days
Property features AI
Finance
- Financial info: Down payment assistance available; Quarterly garbage fee (approximately $50); Fire fee and library fee included
- HOA & community: No association fee
Exterior
- Parking: Driveway parking
- Utilities: Public water; Septic system; Electric water heater
- Home design: Existing single-family residence; Basement foundation; No waterfront, pool, or patio reported
- Construction: Siding (other) exterior construction; Basement foundation (concrete block); Year built listed as existing
- Exterior features: Fenced yard; Storage building; Porch; Open deck
Interior
- Kitchen: Laminate countertops; Gas stove
- Bedrooms: Multiple bedrooms on the main level including a master bedroom with walk-in closet
- Flooring: Carpet; Hardwood
- Bathrooms: Three full bathrooms; Combination of separate shower and tub/shower combo
- Heating & cooling: Central heating; Central air conditioning
- Interior features: Carpet and hardwood floors; One woodburning fireplace with brick surround located in the den; Pull-down attic; Full unfinished concrete block basement (finished area noted separately)
- Laundry & utility: Main-level laundry room; Washer hookup and electric dryer hookup; Electric water heater
Neighborhood map
What this means for you Summary
Snapshot
- This is a 3-bed/1.0-bath single-family listed at $190k.
Deal economics
- At list price, monthly cash flow is $489 ($6k/yr) — positive.
- The deal already cash-flows at list — no discount required.
- Meets the 1% rule at list price ($2k rent vs $190k).
- Recommended offer: $184k (3.0% below list) — sets the bar for market timing.
- Cap rate 9.4% vs local median 3.4% in Trussville — top-decile yield for the area; either an underpriced asset or a hidden risk that comps aren't pricing in. Stress-test before assuming the spread holds.
Location & tenants
- Location reads 79/100 on livability (#7 in AL, #2,110 nationally) — a middle-class / working-renter tenant base. Strengths: employment A+, housing A+, crime B+; Watch: commute F.
- Trussville City (suburban): math 49% / reading 74% proficiency, ranked #5 of 129 in AL (top 4%) — acceptable for families but not a draw, mixed tenant base, ~2y average lease; only 7% free/reduced lunch — higher-income household profile.
- Zoned schools: Cahaba Elementary School (math 71% / reading 85%, grade A, #9 of 627 statewide, top 1%, 537 students, 16% FRL); Hewitttrussville High School (math 50% / reading 50%, grade D+, #15 of 305 statewide, top 5%, 1,573 students, 15% FRL).
- Market conditions: 344 active listings in the ZIP; 2,114 units permitted in Jefferson County in 2024 (556 in 5+ unit buildings).
Forward outlook
- Local home prices are declining (-3.0%/yr); year-one equity from $1k of loan paydown is wiped out by about $6k of value loss. Plan a longer hold.
- Jefferson County population projected to shrink 4% by 2050 — rents likely to lag national; underwrite the cash flow, not the appreciation.
- At projected returns (-3.0% appreciation + 3.0% rent growth), your $53k cash investment doubles in ~10 years — after that, you're playing with house money.
Negotiation context
- It's been on market 43 days — a 3% lower offer ($184k) is reasonable based on typical stale-listing flexibility.
Risks & watch-outs
- Watch-outs: built in 1945 — expect roof / HVAC / electrical / plumbing capex.
- Climate carrying-cost: major wind risk, 27% chance of damaging wind over 30y; moderate wildfire risk; extreme-heat days projected 6→16/yr by 2055 (HVAC capex compounding) — expect insurance premiums to compound above CPI over the hold.
Questions for the listing agent
- It's been on market 43 days. Have you received any prior offers? Is the seller open to a 3% concession, seller financing, or rate buy-down credit?
- Built in 1945 — when were the roof, HVAC, electrical panel, plumbing, and water heater last replaced?
- Is there a deadline driving the sale (1031 exchange, divorce, estate, relocation)? That informs how much negotiation room exists.
- Schools are A-rated — typically a magnet for longer-tenancy family renters. What's the average tenant stay here, and is there a school-zone premium baked into asking?
- What's the average days-on-market for RENTAL listings here right now (not sales)? A rising rental-DOM trend means longer vacancies and softer asking-rent achievability than the comps imply.
- What's the recent tenant-quality profile in this submarket — average credit score on applications, eviction rate, late-payment / NSF rate, and stable-employment percentage? A property-management company in the area should have these aggregated.
- How much new for-sale + rental construction is in the pipeline within 1–3 miles? Heavy new supply typically softens prices + rents 12–24 months out; constrained supply supports both.
Investment metrics
- 1% rule
- 1.11% ✓
- Cap rate
- 9.38%
- Cash-on-cash
- 11.03%
- DSCR
- 1.49
- GRM
- 7.5
CMA / ARV
- ARV (median comp)
- $421,331
- List price
- $189,900
- Delta
- -54.93%
- Verdict
- UNDERPRICED
- Comps
- 20 within 1.0 mi
Show comp detail 1 sale within ~0.75 mi
| Address | Dist | Beds/Ba | Sqft | Sold | Price | $/sf | Match |
|---|---|---|---|---|---|---|---|
| 3260 Cahaba Manor Dr | 0.62mi | 4/2.0 (+1) | 2,764 (-11%) | 24mo | $385,000 | $139 | 24 |
Match score weights: distance 35% · size 25% · config 20% · recency 20%. Top-matched comps best support the ARV.
Projected returns pro-forma
-3.0% appreciation · 3.0% rent growth · sell at horizon
- IRR
- 0.2%
- Equity multiple
- 1.01×
- Total profit
- $318
- Equity at exit
- $28,315
- IRR
- 9.8%
- Equity multiple
- 1.76×
- Total profit
- $40,176
- Equity at exit
- $16,419
Cash invested: $53,172 (down + closing). Projections, not guarantees.
Landlord ↔ Tenant lean methodology
- Overall (STATE)
- 90 Strongly Landlord-Friendly
- State Alabama
- 90 Strongly Landlord-Friendly · R+15
- County
- — inherits STATE
- City
- — inherits STATE
ZIP-level market 35173
- Home prices YoY
- -33.4%
- Active inventory
- 344
- Price-to-rent
- 7.5×
Monthly cashflow live
- Estimated rent
- $2,115 medium interval (Pro) →
- Mortgage (P&I)
- −$996
- Tax from tax record
- −$107 /mo · $1,282/yr
- Insurance
- −$79
- HOA
- −$0
- Vacancy / Maint / Mgmt
- −$444
- Net cashflow
- $489
Break-even live
UW: 25.0% down · 7.5% · 30yr · 1.5% tax · 5.0% vac · 8.0% maint · 8.0% mgmt
Financing live
Cash to close
- Down payment
- $47,475
- Closing costs
- $5,697
- Reserves months
- —
- Total cash needed
- —
Loan-product check · same deal, 3 products live
Conventional
25% down · 7.5% · 30yr
- Down + closing
- —
- Monthly P&I
- —
- Monthly cashflow
- —
- DSCR
- —
- Eligible?
- —
Personal DTI + credit; lowest rate.
DSCR
20% down · 8.5% · 30yr
- Down + closing
- —
- Monthly P&I
- —
- Monthly cashflow
- —
- DSCR
- —
- Eligible?
- —
No personal income docs; deal must DSCR.
Hard money
10% down · 12.0% · 12mo
- Down + closing
- —
- Monthly P&I
- —
- Monthly cashflow
- —
- DSCR
- —
- Eligible?
- —
Short-term bridge; refi at stabilization.
Listing history 16 events
-
2026-06-18days on market $189,900 Active 43 DOM
-
2026-06-17days on market $189,900 Active 42 DOM
-
2026-06-16days on market $189,900 Active 41 DOM
-
2026-06-15days on market $189,900 Active 40 DOM
-
2026-06-13days on market $189,900 Active 38 DOM
-
2026-06-13days on market $189,900 Active 37 DOM
-
2026-06-10days on market $189,900 Active 35 DOM
-
2026-06-09days on market $189,900 Active 34 DOM
-
2026-06-08days on market $189,900 Active 33 DOM
-
2026-06-07days on market $189,900 Active 32 DOM
-
2026-06-05days on market $189,900 Active 29 DOM
-
2026-06-03days on market $189,900 Active 28 DOM
-
2026-06-02days on market $189,900 Active 27 DOM
-
2026-06-01days on market $189,900 Active 26 DOM
-
2026-05-31pricedays on market $189,900 Active 25 DOM
-
2026-05-06$219,900 Active 582-char remark
ⓘ Source: listings_history table (triggers on properties + properties_extension) + one-shot
backfill from property_details.listing_events for pre-trigger history.
Tax reassessment forecast AL · Resets to sale price
- Current annual tax
- $1,282 · $107/mo
- Projected year-2 tax
- $1,282 · $107/mo
- Expected delta
- $0/yr ($0/mo · 0.0%)
ⓘ Screening estimate from a state-policy table — verify with the county assessor before closing.
Climate risk First Street
- Flood 1/10 Low FEMA zone X (unshaded) · 0% chance over 30 yrs
- Wildfire 5/10 Major
- Heat 5/10 Major 6 d/yr ≥106°F today · 16 d/yr by 30 yrs out
- Wind 6/10 Major 27% chance of damaging wind over 30 yrs
- Air quality 4/10 Moderate 6 unhealthy d/yr today · 7 by 30 yrs out
Nearby sold comps map
Loading sold comps map…
Walkable amenities ~0.75 mi
Loading nearby amenities…
Taxation est. · year 1
- Rental income
- $25,378
- − Mortgage interest
- −$10,637
- − Property taxes
- −$1,282
- − Insurance
- −$950
- − Repairs & maintenance
- −$2,030
- − Management
- −$2,030
- − Depreciation
- −$5,524
- Taxable income
- $2,924
- Est. tax owed @ 24.0%
- −$702
- After-tax cash flow
- $5,165/yr
For passive investors: Depreciation is non-cash, so a rental often shows a tax loss while cash-flowing — sheltering income. Rental losses are passive: they offset passive income freely, and up to $25,000/yr can offset ordinary (W-2) income if you actively participate and your MAGI is under $100k (phasing out to $0 by $150k); unused losses carry forward. On sale, claimed depreciation is recaptured at up to 25%, and gains may owe capital-gains tax (a 1031 exchange can defer both). Figures are a year-1 estimate at your 24.0% rate — not tax advice; consult a CPA.
Schools (NCES district)
- District
- Trussville City
- NCES district ID
- 0100013
- Math proficiency
- 49% ▼ -27.00%
- Reading proficiency
- 74% ▲ 3.00%
- Median HH income
- $83,473
- Composite
- 55.42/100
- National rank
- #1250
- State rank
- #5 of 129 in AL
Livability — Trussville
- Score
- 79/100
- State rank
- #7
- US rank
- #2110
Category grades
Schools grade is shown separately in the Schools card above.
Census & demographics
- Census place
- Trussville, AL
- City population
- 51,725
- Population (ZIP)
- 32,125
Population outlook (Jefferson County) Hauer SSP2
- Today (2025)
- 669,185 people
- By 2030
- 669,694 · +0.1%
- By 2040
- 661,388 · -1.2%
- By 2050
- 643,086 · -3.9%
- By 2075
- 577,267 · -13.7%
- By 2100
- 474,758 · -29.1%
Race, ethnicity, and origin ACS 2023
- Neighborhood character
- Predominantly White (82%)
- Race & ethnicity
- White 82% Black 10% Hispanic / Latino 5% Two or more races 4%
- Common ancestry
- Slovak 2% Italian 2% Lithuanian 1%
- Foreign-born
- 4% · Canada, Jamaica
- Languages at home
- 95% English-only · Spanish 3%
Political lean MEDSL · Jefferson
- 2024 margin
- D (+10.4) · D 54.6% · R 44.2% · Other 1.2%
- 2008→2024 swing
- +5.4pp toward D · 2008: 5.1pp · 2024: 10.4pp
- All cycles
- 2024: D+10.4 2020: D+13.2 2016: D+7.2 2012: D+6.0 2008: D+5.1
Not yet ingested
- Civics
- —
Market trends
- HPI YoY
- ▼ -104.75%
- Current HPI
- 208.5715
- Rent YoY
- —
- Metro
- —
- State GDP YoY
- ▲ 2.94%
- F500 in state
- 4
Industry mix (Fortune 500 HQ in AL)
| Industry | F500 HQs | Revenue |
|---|---|---|
| Financial Services | 1 | $8B |
|
||
| Healthcare | 1 | $5B |
|
||
Price history
-13.6% since first listed2 events — show timeline
- 2026-05-30 Price Changed $189,900 Greater Alabama MLS
- 2026-05-06 Listed $219,900 Greater Alabama MLS
Property tax history
+5.5%/yrLatest (2025): $1,282 · +4.8% YoY. Source: county tax records.
Cash-flow waterfall
monthlySold comps — $/sqft
last 12 mo · ≤1 miLoading sold comps…