1904 Clifton St · North Charleston, SC
Flood risk 4/10 · Minor
- FEMA flood zone
- X (unshaded)
- Chance of flooding over 30 yrs
- 0.22%
- Est. flood insurance / yr
- $507 – $1,088
Fire risk 1/10 · Minimal
- Est. fire insurance / yr
- $783 – $1,453
Heat risk 10/10 · Severe
- Hot days now (above 106°F)
- 7 days/yr
- Hot days in 30 yrs
- 18 days/yr
Wind risk 8/10 · Major
- Chance of severe wind over 30 yrs
- 99.0%
Air-quality risk 3/10 · Minor
- Unhealthy air days now
- 3 days/yr
- Unhealthy air days in 30 yrs
- 3 days/yr
Risk factors via First Street. Map © Google.
Why this score? — see what drove the C+ grade
The composite is a weighted blend of 9 inputs, each scored 0–100. Each bar is that input's sub-score; the figure is the points it added to the 100-point composite (weight × sub-score).
- Cash flow +25.9/30.0
- DSCR +8.7/10.0
- ARV discount +7.5/15.0
- 1% rule +6.9/10.0
- Schools +4.3/10.0
- Livability +3.3/5.0
- Rent growth +2.8/5.0
- Condition / age +2.5/5.0
- Appreciation +0.0/10.0
$150,000
🖨 Deal sheet (PDF) 📄 Offer letter ✓ Due diligence
Listing remarks
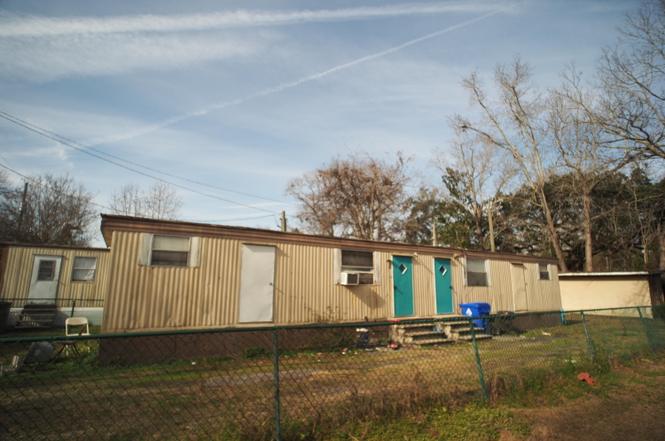
Welcome to small mobile home located in the Ferndale neighborhood of North Charleston. This home presents a solid opportunity for investors, or rehabbers looking to customize a space in a community with convenient access to local amenities and Charleston's vibrant Park Circle community
Key facts
- Convenient access
- Local amenities
- 4,791 sq ft lot
Tags
Property features AI
Exterior
- Utilities: Public sewer
- Home design: Manufactured / Mobile Home; Single wide; One story
- Construction: Vinyl skirting
- Exterior features: Chain link fencing; Lot size under 0.5 acre
Interior
- Bedrooms: 3 bedrooms
- Bathrooms: 2 bathrooms
- Interior features: One level interior
Neighborhood map
What this means for you Summary
Snapshot
- This is a 3-bed/2.0-bath manufactured listed at $150k.
Deal economics
- At list price, monthly cash flow is $369 ($4k/yr) — positive.
- The deal already cash-flows at list — no discount required.
- Meets the 1% rule at list price ($2k rent vs $150k).
- Recommended offer: $136k (9.0% below list) — sets the bar for market timing.
- Cap rate 9.2% vs local median 4.0% in North Charleston — top-decile yield for the area; either an underpriced asset or a hidden risk that comps aren't pricing in. Stress-test before assuming the spread holds.
Location & tenants
- Location reads 66/100 on livability (#122 in SC) — a middle-class / working-renter tenant base. Strengths: housing A+, health & safety A+, cost of living A; Watch: employment C-, crime F, amenities F.
- Charleston 01 (urban): math 48% / reading 53% proficiency, ranked #7 of 80 in SC (top 9%) — acceptable for families but not a draw, mixed tenant base, ~2y average lease.
- Zoned schools: North Charleston Creative Arts Elementary (math 22% / reading 27%, grade F, #452 of 597 statewide, top 78%, 397 students, 100% FRL); Morningside Middle (math 4% / reading 12%, grade F, #226 of 229 statewide, top 99%, 567 students, 100% FRL); North Charleston High (math 27% / reading 57%, grade F, #174 of 196 statewide, top 90%, 768 students, 100% FRL) — zoned schools average 100% FRL vs 44% district-wide (56 pts higher); higher-poverty schools than district average — tighter screening recommended.
- Zoned-school proficiency averages 25% at this address vs 50% district-wide (-26 pts) — the specific schools serving this property underperform the Charleston 01 average; the district grade overstates school quality for this exact location.
- Market conditions: Rents rising (+1.4%/yr); 174 active listings in the ZIP; 17 comparable units currently listed for rent nearby; rentals at typical pace (median 20d on market — plan ~3-4 weeks tenant-placement turnaround); 4,156 units permitted in Charleston County in 2024 (857 in 5+ unit buildings).
- This rent runs 43% of the median local income ($50k/yr) — at the standard rent-burdened threshold; future hikes will face affordability resistance.
Forward outlook
- Local home prices are declining (-3.0%/yr); year-one equity from $1k of loan paydown is wiped out by about $4k of value loss. Plan a longer hold.
- Charleston County population projected at +44% by 2050 — long-run rental-demand tailwind backs the buy-and-hold thesis.
Negotiation context
- It's been on market 94 days — a 9% lower offer ($136k) is reasonable based on typical stale-listing flexibility.
Risks & watch-outs
- Climate carrying-cost: severe wind risk, 99% chance of damaging wind over 30y; extreme-heat days projected 7→18/yr by 2055 (HVAC capex compounding) — expect insurance premiums to compound above CPI over the hold.
Questions for the listing agent
- It's been on market 94 days. Have you received any prior offers? Is the seller open to a 9% concession, seller financing, or rate buy-down credit?
- Built in 1970 — when were the roof, HVAC, electrical panel, plumbing, and water heater last replaced?
- Why hasn't it sold? Are there any deal-killer items the seller is aware of (foundation, flood, title, zoning, code violations)?
- Is there a deadline driving the sale (1031 exchange, divorce, estate, relocation)? That informs how much negotiation room exists.
- Crime grade is F in this area — have there been break-ins, vandalism, or insurance claims at this property in the last 3 years? What carrier currently insures it and at what premium?
- What's the average days-on-market for RENTAL listings here right now (not sales)? A rising rental-DOM trend means longer vacancies and softer asking-rent achievability than the comps imply.
- What's the recent tenant-quality profile in this submarket — average credit score on applications, eviction rate, late-payment / NSF rate, and stable-employment percentage? A property-management company in the area should have these aggregated.
- How much new for-sale + rental construction is in the pipeline within 1–3 miles? Heavy new supply typically softens prices + rents 12–24 months out; constrained supply supports both.
Investment metrics
- 1% rule
- 1.19% ✓
- Cap rate
- 9.25%
- Cash-on-cash
- 10.55%
- DSCR
- 1.47
- GRM
- 7.0
CMA / ARV
No comps found within radius.
Projected returns pro-forma
-3.0% appreciation · 1.37% rent growth · sell at horizon
- IRR
- -2.3%
- Equity multiple
- 0.91×
- Total profit
- $-3,645
- Equity at exit
- $22,365
- IRR
- 5.5%
- Equity multiple
- 1.38×
- Total profit
- $15,800
- Equity at exit
- $12,969
Cash invested: $42,000 (down + closing). Projections, not guarantees.
Landlord ↔ Tenant lean methodology
- Overall (STATE)
- 90 Strongly Landlord-Friendly
- State South Carolina
- 90 Strongly Landlord-Friendly · R+6
- County
- — inherits STATE
- City
- — inherits STATE
ZIP-level market 29406
- Home prices YoY
- -6.7%
- Rents YoY
- 1.4%
- Active inventory
- 174
- Price-to-rent
- 7.0×
Monthly cashflow live
- Estimated rent
- $1,779 high interval (Pro) →
- Mortgage (P&I)
- −$787
- Tax est. 1.5%
- −$188 /mo · $2,250/yr
- Insurance
- −$62
- HOA
- −$0
- Vacancy / Maint / Mgmt
- −$374
- Net cashflow
- $369
Break-even live
Sensitivity live
| Price | -10% $473 | -5% $421 | +0% $369 | +5% $317 | +10% $265 |
|---|---|---|---|---|---|
| Rent | -10% $229 | -5% $299 | +0% $369 | +5% $439 | +10% $510 |
| Rate | -1.0pp $445 | -0.5pp $407 | base $369 | +0.5pp $330 | +1.0pp $291 |
UW: 25.0% down · 7.5% · 30yr · 1.5% tax · 5.0% vac · 8.0% maint · 8.0% mgmt
Financing live
Cash to close
- Down payment
- $37,500
- Closing costs
- $4,500
- Reserves months
- —
- Total cash needed
- —
Loan-product check · same deal, 3 products live
Conventional
25% down · 7.5% · 30yr
- Down + closing
- —
- Monthly P&I
- —
- Monthly cashflow
- —
- DSCR
- —
- Eligible?
- —
Personal DTI + credit; lowest rate.
DSCR
20% down · 8.5% · 30yr
- Down + closing
- —
- Monthly P&I
- —
- Monthly cashflow
- —
- DSCR
- —
- Eligible?
- —
No personal income docs; deal must DSCR.
Hard money
10% down · 12.0% · 12mo
- Down + closing
- —
- Monthly P&I
- —
- Monthly cashflow
- —
- DSCR
- —
- Eligible?
- —
Short-term bridge; refi at stabilization.
Rent comps 17 comps
| Address | Beds | Baths | Sqft | Rent | $/sqft | DOM | Units | Dist |
|---|---|---|---|---|---|---|---|---|
| 2403 Mall Dr North Charleston, SC | 1.0–2.0 | 1.0–2.0 | 911 | $2,470 | $2.71 | 3d | 20 | 0.52mi |
| 2181 Eleanor Dr North Charleston, SC | 2.0 | 1.0 | 644 | $1,640 | $2.55 | 15d | 1 | 0.80mi |
| 2181 Eleanor Dr Unit A North Charleston, SC | 2.0 | 1.0 | 644 | $1,640 | $2.55 | 24d | 1 | 0.80mi |
| 5475 Califf Rd Charleston, SC | 2.0 | 1.0 | 750 | $1,350 | $1.80 | 24d | 1 | 0.98mi |
| 1815 Sumner Ave North Charleston, SC | 2.0 | 1.0 | 625 | $1,500 | $2.40 | 15d | 2 | 1.03mi |
| 5527 Read St Apt 28 North Charleston, SC | 2.0 | 1.0 | 570 | $1,450 | $2.54 | 20d | 1 | 1.08mi |
| 5527 Read St Apt 21 North Charleston, SC | 2.0 | 1.0 | 570 | $1,499 | $2.63 | 20d | 1 | 1.08mi |
| 5555 Mole Ln North Charleston, SC | 2.0 | 1.0 | 625 | $1,620 | $2.59 | 12d | 4 | 1.10mi |
| 5555 Mole Ln Apt B1 North Charleston, SC | 2.0 | 1.0 | 625 | $1,600 | $2.56 | 24d | 1 | 1.10mi |
| 1202 Bexley St Unit C North Charleston, SC | 2.0 | 1.0 | 600 | $1,650 | $2.75 | 24d | 1 | 1.17mi |
| 5607 Aldrich Ave North Charleston, SC | 2.0 | 1.0 | 650 | $1,650 | $2.54 | 24d | 1 | 1.23mi |
| 4251 S Rhett Ave North Charleston, SC | 1.0–3.0 | 1.0–2.5 | 1119 | $2,995 | $2.68 | 3d | 16 | 1.23mi |
| 1441 Remount Rd Unit 14 North Charleston, SC | 2.0 | 1.0 | 625 | $1,500 | $2.40 | 24d | 1 | 1.29mi |
| 1441 Remount Rd North Charleston, SC | 2.0–3.0 | 1.0–2.0 | 837 | $2,030 | $2.42 | 15d | 3 | 1.29mi |
| 2125 Aberdeen Ave Unit 102 North Charleston, SC | 2.0 | 1.0 | 625 | $1,375 | $2.20 | 3d | 1 | 1.35mi |
| 4003 S Rhett Ave Unit C5 North Charleston, SC | 2.0 | 1.0 | 640 | $1,399 | $2.19 | 20d | 1 | 1.47mi |
| 4003 S Rhett Ave Unit B6 North Charleston, SC | 2.0 | 1.0 | 640 | $1,350 | $2.11 | 24d | 1 | 1.47mi |
Listing history 3 events
-
2026-05-09status Pending
-
2026-05-04price $150,000
-
2026-02-04$180,000 Active
ⓘ Source: listings_history table (triggers on properties + properties_extension) + one-shot
backfill from property_details.listing_events for pre-trigger history.
Climate risk First Street
- Flood 4/10 Moderate FEMA zone X (unshaded) · 22% chance over 30 yrs
- Wildfire 1/10 Low
- Heat 10/10 Extreme 7 d/yr ≥106°F today · 18 d/yr by 30 yrs out
- Wind 8/10 Severe 99% chance of damaging wind over 30 yrs
- Air quality 3/10 Moderate 3 unhealthy d/yr today · 3 by 30 yrs out
Nearby sold comps map
Loading sold comps map…
Walkable amenities ~0.75 mi
Loading nearby amenities…
Taxation est. · year 1
- Rental income
- $21,352
- − Mortgage interest
- −$8,402
- − Property taxes
- −$2,250
- − Insurance
- −$750
- − Repairs & maintenance
- −$1,708
- − Management
- −$1,708
- − Depreciation
- −$4,364
- Taxable income
- $2,170
- Est. tax owed @ 24.0%
- −$521
- After-tax cash flow
- $3,908/yr
For passive investors: Depreciation is non-cash, so a rental often shows a tax loss while cash-flowing — sheltering income. Rental losses are passive: they offset passive income freely, and up to $25,000/yr can offset ordinary (W-2) income if you actively participate and your MAGI is under $100k (phasing out to $0 by $150k); unused losses carry forward. On sale, claimed depreciation is recaptured at up to 25%, and gains may owe capital-gains tax (a 1031 exchange can defer both). Figures are a year-1 estimate at your 24.0% rate — not tax advice; consult a CPA.
Schools (NCES district)
- District
- Charleston 01
- NCES district ID
- 4501440
- Math proficiency
- 48% ▼ -2.00%
- Reading proficiency
- 53% ▬ 0.00%
- Median HH income
- $52,376
- Composite
- 43.41/100
- National rank
- #3018
- State rank
- #7 of 80 in SC
Livability — North Charleston
- Score
- 66/100
- State rank
- #122
- US rank
- #12222
Category grades
Schools grade is shown separately in the Schools card above.
Census & demographics
- Census place
- North Charleston, SC
- County
- Charleston County · 366,793 people
- City population
- 108,266
- Metro
- Charleston-North Charleston, SC
- Population (ZIP)
- 32,001
- Household income
- $49,815
- Rent vs Own
- Severe rent burden
- 2054.0
Population outlook (Charleston County) Hauer SSP2
- Today (2025)
- 480,562 people
- By 2030
- 525,921 · +9.4%
- By 2040
- 612,189 · +27.4%
- By 2050
- 691,627 · +43.9%
- By 2075
- 847,979 · +76.5%
- By 2100
- 926,482 · +92.8%
Race, ethnicity, and origin ACS 2023
- Neighborhood character
- Diverse neighborhood (Simpson 0.70)
- Race & ethnicity
- Black 40% White 32% Hispanic / Latino 19% Two or more races 9% Asian 3%
- Hispanic origin (detail)
- Mexican 10% Puerto Rican 1%
- Common ancestry
- Romanian 1% Italian 1% Lithuanian 1%
- Foreign-born
- 15% · Canada, Vietnam
- Languages at home
- 79% English-only · Spanish 17% Vietnamese 1% Tagalog/Filipino 1%
Political lean MEDSL · Charleston
- 2024 margin
- Lean D (+5.7) · D 51.9% · R 46.3% · Other 1.8%
- 2008→2024 swing
- -2.7pp toward R · 2008: 8.3pp · 2024: 5.7pp
- All cycles
- 2024: D+5.7 2020: D+12.9 2016: D+7.9 2012: D+2.4 2008: D+8.3
Not yet ingested
- Civics
- —
Market trends
- HPI YoY
- ▼ -27.09%
- Current HPI
- 374.9164
- Rent YoY
- ▲ 1.37%
- Metro
- Charleston-North Charleston, SC
- State GDP YoY
- ▲ 4.51%
- F500 in state
- 2
Industry mix (Fortune 500 HQ in SC)
| Industry | F500 HQs | Revenue |
|---|---|---|
| Packaging | 1 | $7B |
|
||
Price history
-16.7% since first listed3 events — show timeline
- 2026-05-09 Pending — Charleston Trident MLS
- 2026-05-04 Price Changed $150,000 Charleston Trident MLS
- 2026-02-04 Listed $180,000 Charleston Trident MLS
Cash-flow waterfall
monthlySold comps — $/sqft
last 12 mo · ≤1 miLoading sold comps…