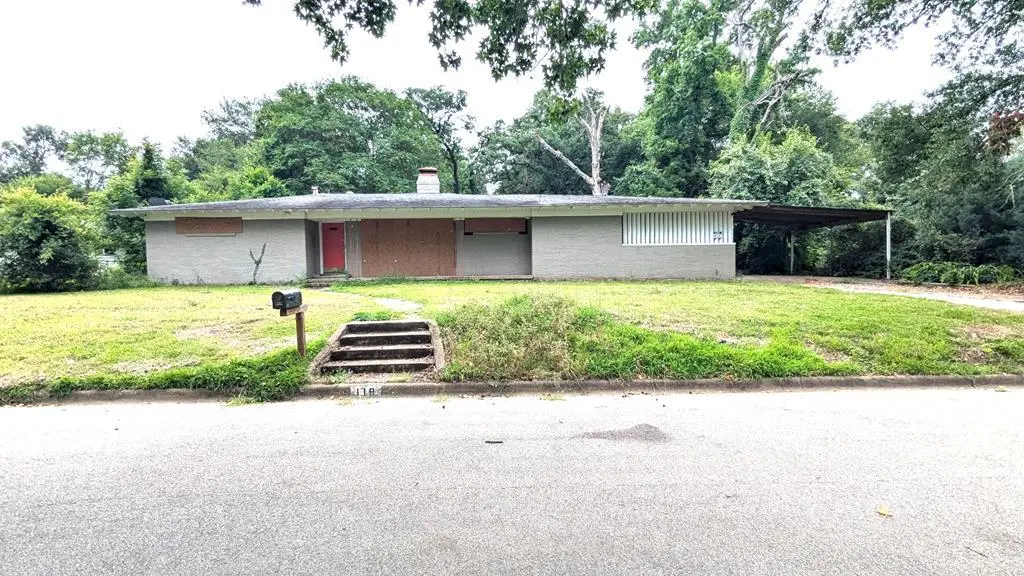
119 Thunderbird Dr · Athens, TX
Flood risk 1/10 · Minimal
- FEMA flood zone
- X (unshaded)
- Chance of flooding over 30 yrs
- 0.0%
- Est. flood insurance / yr
- $507 – $1,088
Fire risk 4/10 · Minor
- Est. fire insurance / yr
- $1,222 – $2,270
Heat risk 7/10 · Major
- Hot days now (above 110°F)
- 7 days/yr
- Hot days in 30 yrs
- 26 days/yr
Wind risk 6/10 · Moderate
- Chance of severe wind over 30 yrs
- 64.0%
Air-quality risk 2/10 · Minimal
- Unhealthy air days now
- 0 days/yr
- Unhealthy air days in 30 yrs
- 1 days/yr
Risk factors via First Street. Map © Google.
Why this score? — see what drove the B- grade
The composite is a weighted blend of 9 inputs, each scored 0–100. Each bar is that input's sub-score; the figure is the points it added to the 100-point composite (weight × sub-score).
- Cash flow +30.0/30.0
- 1% rule +10.0/10.0
- DSCR +10.0/10.0
- ARV discount +7.5/15.0
- Livability +3.6/5.0
- Schools +2.9/10.0
- Rent growth +2.5/5.0
- Condition / age +2.5/5.0
- Appreciation +0.0/10.0
$81,900
🖨 Deal sheet 📄 Offer letter ✓ Due diligence
Listing remarks MLS
Investment Opportunity or a great place to liveyou decide. 3 bedroom, 2 bath home nestled in the heart of Athens. The spacious living area features distinctive brick flooring and a cozy wood-burning fireplace. Past updates before now included a replaced HVAC system, hot water heater, flooring, and roof, which should give added value. This one is a diamond in the rough and need a lot of TLC but its priced right and just waiting on its' next owner. * * This home is being sold "as is".
Key facts
- Hot water heater
- Replaced hvac system
- Brick flooring
Tags
Property features AI
Exterior
- Parking: Carport
- Utilities: Public water; Public sewer
- Home design: Single-family residence; One story
- Construction: Brick veneer construction; Slab foundation; Composition roof; Built in 2026
- Exterior features: Front porch; Chain link fencing; No pool
Interior
- Kitchen: Dishwasher; Disposal; Oven
- Bathrooms: 2 full bathrooms
- Heating & cooling: Central electric cooling; Ceiling fans
- Interior features: Ceiling fans
Neighborhood map
What this means for you Summary
Snapshot
- This is a 3-bed/2.0-bath single-family listed at $82k.
Deal economics
- At list price, monthly cash flow is $532 ($6k/yr) — positive.
- The deal already cash-flows at list — no discount required.
- Meets the 1% rule at list price ($2k rent vs $82k).
- Recommended offer: $81k (1.5% below list) — sets the bar for market timing.
- Cap rate 14.1% vs local median 2.5% in Athens — top-decile yield for the area; either an underpriced asset or a hidden risk that comps aren't pricing in. Stress-test before assuming the spread holds.
Location & tenants
- Location reads 72/100 on livability (#241 in TX) — a middle-class / working-renter tenant base. Strengths: cost of living A+, health & safety A+, housing A; Watch: crime D+, schools D, amenities F.
- Athens ISD (town): math 34% / reading 34% proficiency, ranked #548 of 826 in TX (top 66%) — families likely to look elsewhere, expect single-tenant / working-renter base with shorter leases; 62% free/reduced lunch — lower-income household profile, screen leases tightly.
- Market conditions: 188 active listings in the ZIP; 4 comparable units currently listed for rent nearby; rentals lingering (median 44d on market — plan ~5-8 weeks vacancy on turnover, expect pricing pressure); 75% of comp listings sitting > 30 days — soft ceiling on asking rent; 263 units permitted in Henderson County in 2024 (0 in 5+ unit buildings).
Forward outlook
- Local home prices are declining (-3.0%/yr); year-one equity from $566 of loan paydown is wiped out by about $2k of value loss. Plan a longer hold.
- At projected returns (-3.0% appreciation + 3.0% rent growth), your $23k cash investment doubles in ~5 years — after that, you're playing with house money.
Negotiation context
- It's been on market 15 days — a 2% lower offer ($81k) is reasonable based on typical stale-listing flexibility.
- 13 sale attempts since 15y ago with the ask held roughly flat each time — persistent listings suggest the price (not the market) is what's stuck; bring a comps-based counter.
Risks & watch-outs
- Watch-outs: property tax is 5.0% of price; built in 1955 — expect roof / HVAC / electrical / plumbing capex.
- Climate carrying-cost: major wind risk, 64% chance of damaging wind over 30y; extreme-heat days projected 7→26/yr by 2055 (HVAC capex compounding) — expect insurance premiums to compound above CPI over the hold.
Questions for the listing agent
- Built in 1955 — when were the roof, HVAC, electrical panel, plumbing, and water heater last replaced?
- Property tax is high relative to price — has the assessment been appealed recently, and will the sale trigger a re-assessment?
- Is there a deadline driving the sale (1031 exchange, divorce, estate, relocation)? That informs how much negotiation room exists.
- Schools are D-rated, which usually means shorter tenancies and higher turnover. Who's the typical renter profile here, and what's been the actual vacancy rate?
- Crime grade is D in this area — have there been break-ins, vandalism, or insurance claims at this property in the last 3 years? What carrier currently insures it and at what premium?
- What's the average days-on-market for RENTAL listings here right now (not sales)? A rising rental-DOM trend means longer vacancies and softer asking-rent achievability than the comps imply.
- What's the recent tenant-quality profile in this submarket — average credit score on applications, eviction rate, late-payment / NSF rate, and stable-employment percentage? A property-management company in the area should have these aggregated.
- How much new for-sale + rental construction is in the pipeline within 1–3 miles? Heavy new supply typically softens prices + rents 12–24 months out; constrained supply supports both.
Investment metrics
- 1% rule
- 2.06% ✓
- Cap rate
- 14.09%
- Cash-on-cash
- 27.84%
- DSCR
- 2.24
- GRM
- 4.0
CMA / ARV
- ARV (on-the-fly)
- $199,517
- Comps found
- 12
Show comp detail 12 sales within ~0.75 mi
| Address | Dist | Beds/Ba | Sqft | Sold | Price | $/sf | Match |
|---|---|---|---|---|---|---|---|
| 103 E Cayuga Dr | 0.22mi | 3/2.0 | 1,476 (-6%) | 3mo | $99,900 | $68 | 77 |
| 220 Guadalupe Dr | 0.21mi | 3/2.0 | 1,730 (+10%) | 2mo | $219,900 | $127 | 72 |
| 133 Penny Ln | 0.25mi | 3/2.5 | 1,716 (+9%) | 4mo | $274,500 | $160 | 68 |
| 505 Colonial Dr | 0.42mi | 3/2.0 | 1,702 (+8%) | 0mo | $255,000 | $150 | 66 |
| 404 Lindsey Ln | 0.52mi | 3/1.0 | 1,575 (+0%) | 9mo | $210,000 | $133 | 64 |
| 223 Guadalupe Dr | 0.23mi | 3/2.0 | 1,744 (+11%) | 10mo | $314,400 | $180 | 62 |
| 108 W Clinton Ave | 0.23mi | 3/1.0 | 1,420 (-10%) | 11mo | $140,000 | $99 | 60 |
| 520 Ravenwood Dr | 0.55mi | 3/2.0 | 1,630 (+4%) | 11mo | $175,000 | $107 | 59 |
| 809 S Prairieville St | 0.24mi | 3/2.0 | 1,797 (+14%) | 11mo | $225,000 | $125 | 56 |
| 508 Highland Dr | 0.51mi | 3/2.0 | 1,716 (+9%) | 6mo | $199,000 | $116 | 55 |
| 109 Laird Ln | 0.69mi | 3/1.0 | 1,416 (-10%) | 1mo | $155,900 | $110 | 47 |
| 509 Davis Dr | 0.53mi | 4/2.0 (+1) | 1,774 (+13%) | 7mo | $232,900 | $131 | 42 |
Match score weights: distance 35% · size 25% · config 20% · recency 20%. Top-matched comps best support the ARV.
Projected returns pro-forma
-3.0% appreciation · 3.0% rent growth · sell at horizon
- IRR
- 22.1%
- Equity multiple
- 1.91×
- Total profit
- $20,789
- Equity at exit
- $12,212
- IRR
- 30.2%
- Equity multiple
- 3.72×
- Total profit
- $62,435
- Equity at exit
- $7,081
Cash invested: $22,932 (down + closing). Projections, not guarantees.
Landlord ↔ Tenant lean methodology
- Overall (STATE)
- 87 Strongly Landlord-Friendly
- State Texas
- 87 Strongly Landlord-Friendly · R+5
- County
- — inherits STATE
- City
- — inherits STATE
ZIP-level market 75751
- Home prices YoY
- -33.1%
- Active inventory
- 188
- Price-to-rent
- 4.0×
Monthly cashflow live
- Estimated rent
- $1,689 medium interval (Pro) →
- Mortgage (P&I)
- −$429
- Tax from tax record
- −$339 /mo · $4,065/yr
- Insurance
- −$34
- HOA
- −$0
- Vacancy / Maint / Mgmt
- −$355
- Net cashflow
- $532
Break-even live
UW: 25.0% down · 7.5% · 30yr · 1.5% tax · 5.0% vac · 8.0% maint · 8.0% mgmt
Financing live
Cash to close
- Down payment
- $20,475
- Closing costs
- $2,457
- Reserves months
- —
- Total cash needed
- —
Loan-product check · same deal, 3 products live
Conventional
25% down · 7.5% · 30yr
- Down + closing
- —
- Monthly P&I
- —
- Monthly cashflow
- —
- DSCR
- —
- Eligible?
- —
Personal DTI + credit; lowest rate.
DSCR
20% down · 8.5% · 30yr
- Down + closing
- —
- Monthly P&I
- —
- Monthly cashflow
- —
- DSCR
- —
- Eligible?
- —
No personal income docs; deal must DSCR.
Hard money
10% down · 12.0% · 12mo
- Down + closing
- —
- Monthly P&I
- —
- Monthly cashflow
- —
- DSCR
- —
- Eligible?
- —
Short-term bridge; refi at stabilization.
Rent comps 4 comps
| Address | Beds | Baths | Sqft | Rent | $/sqft | DOM | Units | Dist |
|---|---|---|---|---|---|---|---|---|
| 910 Maryland Dr Athens, TX | 3.0 | 2.5 | 1144 | $1,750 | $1.53 | 43d | 1 | 0.23mi |
| 1004 W Cayuga Dr Athens, TX | 4.0 | 2.0 | 1495 | $1,500 | $1.00 | 43d | 1 | 0.64mi |
| 1100 Meadow Dr Athens, TX | 3.0 | 2.0 | 1396 | $1,900 | $1.36 | 43d | 1 | 0.84mi |
| 900 E Corsicana St Athens, TX | 2.0 | 1.0–2.0 | 767 | $1,339 | $1.74 | 13d | 6 | 1.50mi |
Listing history 13 events
-
2026-06-19days on market $81,900 Active 15 DOM
-
2026-06-18days on market $81,900 Active 14 DOM
-
2026-06-17days on market $81,900 Active 13 DOM
-
2026-06-16days on market $81,900 Active 12 DOM
-
2026-06-15days on market $81,900 Active 11 DOM
-
2026-06-14days on market $81,900 Active 9 DOM
-
2026-06-12days on market $81,900 Active 8 DOM
-
2026-06-09days on market $81,900 Active 5 DOM
-
2026-06-09remarks 557-char remark
-
2026-06-08days on market $81,900 Active 4 DOM
-
2026-06-07days on market $81,900 Active 3 DOM
-
2026-06-05remarks 489-char remark
-
2026-06-05$81,900 Active 1 DOM
ⓘ Source: listings_history table (triggers on properties + properties_extension) + one-shot
backfill from property_details.listing_events for pre-trigger history.
Tax reassessment forecast TX · Resets to sale price
- Current annual tax
- $4,065 · $339/mo
- Projected year-2 tax
- $4,065 · $339/mo
- Expected delta
- $0/yr ($0/mo · 0.0%)
ⓘ Screening estimate from a state-policy table — verify with the county assessor before closing.
Climate risk First Street
- Flood 1/10 Low FEMA zone X (unshaded) · 0% chance over 30 yrs
- Wildfire 4/10 Moderate
- Heat 7/10 Severe 7 d/yr ≥110°F today · 26 d/yr by 30 yrs out
- Wind 6/10 Major 64% chance of damaging wind over 30 yrs
- Air quality 2/10 Low 0 unhealthy d/yr today · 1 by 30 yrs out
Nearby sold comps map
Loading sold comps map…
Walkable amenities ~0.75 mi
Loading nearby amenities…
Taxation est. · year 1
- Rental income
- $20,270
- − Mortgage interest
- −$4,588
- − Property taxes
- −$4,065
- − Insurance
- −$410
- − Repairs & maintenance
- −$1,622
- − Management
- −$1,622
- − Depreciation
- −$2,383
- Taxable income
- $5,582
- Est. tax owed @ 24.0%
- −$1,340
- After-tax cash flow
- $5,045/yr
For passive investors: Depreciation is non-cash, so a rental often shows a tax loss while cash-flowing — sheltering income. Rental losses are passive: they offset passive income freely, and up to $25,000/yr can offset ordinary (W-2) income if you actively participate and your MAGI is under $100k (phasing out to $0 by $150k); unused losses carry forward. On sale, claimed depreciation is recaptured at up to 25%, and gains may owe capital-gains tax (a 1031 exchange can defer both). Figures are a year-1 estimate at your 24.0% rate — not tax advice; consult a CPA.
Schools (NCES district)
- District
- Athens ISD
- NCES district ID
- 4808870
- Math proficiency
- 34% ▼ -9.00%
- Reading proficiency
- 34% ▼ -4.00%
- Median HH income
- $41,617
- Composite
- 28.73/100
- National rank
- #6680
- State rank
- #548 of 826 in TX
Livability — Athens
- Score
- 72/100
- State rank
- #241
- US rank
- #5796
Category grades
Schools grade is shown separately in the Schools card above.
Census & demographics
- Census place
- Athens, TX
- County
- Henderson County · 34,977 people
- City population
- 18,644
- Metro
- Athens, TX
- Population (ZIP)
- 18,644
- Household income
- $70,620
- Rent vs Own
- Severe rent burden
- 535.0
Population outlook (Henderson County) Hauer SSP2
- Today (2025)
- 80,471 people
- By 2030
- 80,608 · +0.2%
- By 2040
- 80,087 · -0.5%
- By 2050
- 78,208 · -2.8%
- By 2075
- 72,423 · -10.0%
- By 2100
- 61,012 · -24.2%
Race, ethnicity, and origin ACS 2023
- Neighborhood character
- Diverse neighborhood (Simpson 0.56)
- Race & ethnicity
- White 60% Hispanic / Latino 24% Two or more races 18% Black 10% Asian 2%
- Hispanic origin (detail)
- Mexican 22%
- Common ancestry
- Slovak 2% Romanian 1% Italian 1%
- Foreign-born
- 8% · Canada
- Languages at home
- 79% English-only · Spanish 19% Other Asian/Pacific 1%
Political lean MEDSL · Henderson
- 2024 margin
- Solid R (+63.5) · D 18.0% · R 81.4%
- 2008→2024 swing
- -18.8pp toward R · 2008: -44.6pp · 2024: -63.5pp
- All cycles
- 2024: R+63.5 2020: R+60.2 2016: R+60.0 2012: R+54.8 2008: R+44.6
Not yet ingested
- Civics
- —
Market trends
- HPI YoY
- ▼ -95.19%
- Current HPI
- 192.3973
- Rent YoY
- —
- Metro
- Athens, TX
- State GDP YoY
- ▲ 3.95%
- F500 in state
- 110
Industry mix (Fortune 500 HQ in TX)
| Industry | F500 HQs | Revenue |
|---|---|---|
| Energy | 16 | $1,198B |
|
||
| Technology | 5 | $198B |
|
||
| Engineering / Construction | 4 | $72B |
|
||
| Energy Services | 3 | $60B |
|
||
| Utilities | 3 | $41B |
|
||
| Healthcare | 2 | $330B |
|
||
Price history
-15.6% since first listed31 events — show timeline
- 2026-06-04 Listed $81,900 HCBOR
- 2026-06-04 Listed $81,900 PAOR
- 2018-01-26 Sold (Public Records) — Public Records
- 2018-01-26 Sold (Public Records) — Public Records
- 2018-01-24 Pending — NTREIS
- 2018-01-24 Listed $140,000 HCBOR
- 2018-01-24 Sold (MLS) — HCBOR
- 2018-01-24 Sold (MLS) — NTREIS
- 2018-01-22 Listed $140,000 NTREIS
- 2016-01-22 Sold (Public Records) — Public Records
- 2016-01-20 Sold (MLS) — HCBOR
- 2016-01-20 Sold (MLS) — GTAR
- 2016-01-20 Sold (MLS) — PAOR
- 2016-01-20 Sold (MLS) — NTREIS
- 2015-12-21 Pending — NTREIS
- 2015-12-21 Listed $78,500 GTAR
- 2015-12-18 Listed $78,500 NTREIS
- 2015-12-17 Listed $78,500 HCBOR
- 2015-12-17 Listed $78,500 PAOR
- 2015-03-27 Listing Removed — NTREIS
- 2014-11-11 Relisted — NTREIS
- 2014-11-06 Pending — NTREIS
- 2014-06-11 Price Changed $80,000 NTREIS
- 2014-02-17 Relisted — NTREIS
- 2014-02-04 Pending — NTREIS
- 2013-08-13 Relisted — NTREIS
- 2013-08-13 Listing Removed — NTREIS
- 2013-02-14 Listed $85,500 NTREIS
- 2011-06-09 Listing Removed — NTREIS
- 2011-02-17 Listed $97,000 NTREIS
- 1991-03-01 Sold (Public Records) — Public Records
Property tax history
+9.3%/yrLatest (2025): $4,065 · +0.2% YoY. Source: county tax records.
Cash-flow waterfall
monthlySold comps — $/sqft
last 12 mo · ≤1 miLoading sold comps…