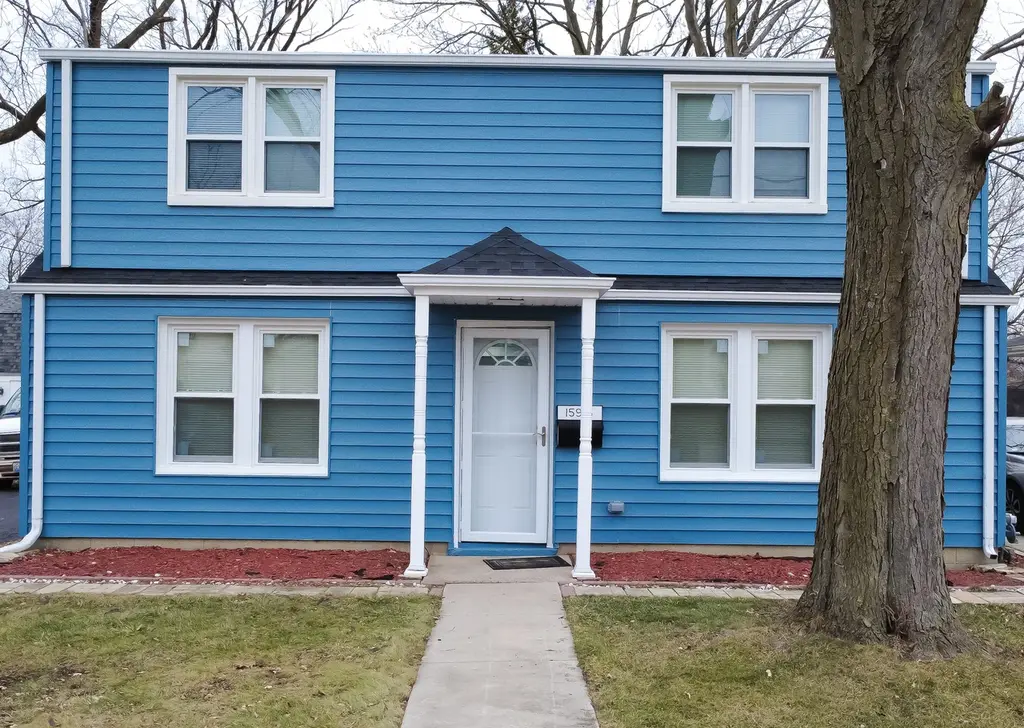
15915 Cottage Grove Ave · South Holland, IL
Flood risk 5/10 · Moderate
- FEMA flood zone
- X (shaded)
- Chance of flooding over 30 yrs
- 0.24%
- Est. flood insurance / yr
- $507 – $1,088
Fire risk 1/10 · Minimal
- Est. fire insurance / yr
- $804 – $1,492
Heat risk 3/10 · Minor
- Hot days now (above 103°F)
- 7 days/yr
- Hot days in 30 yrs
- 15 days/yr
Wind risk 2/10 · Minimal
- Chance of severe wind over 30 yrs
- —
Air-quality risk 4/10 · Minor
- Unhealthy air days now
- 4 days/yr
- Unhealthy air days in 30 yrs
- 5 days/yr
Risk factors via First Street. Map © Google.
Why this score? — see what drove the C grade
The composite is a weighted blend of 9 inputs, each scored 0–100. Each bar is that input's sub-score; the figure is the points it added to the 100-point composite (weight × sub-score).
- Cash flow +25.3/30.0
- DSCR +8.3/10.0
- 1% rule +7.8/10.0
- ARV discount +6.3/15.0
- Livability +3.9/5.0
- Rent growth +2.5/5.0
- Condition / age +2.5/5.0
- Schools +0.7/10.0
- Appreciation +0.0/10.0
$239,900
🖨 Deal sheet 📄 Offer letter ✓ Due diligence
Listing remarks MLS
Investor special! Charming two-story home that sits on a garden oasis deep lot with a wooded backyard. Formal Living Room/Dining Room. Home has so much potential for the right investor. There is a loft upstairs for added room (potential to add 2nd bathroom upstairs). Please note there is no basement. Homes need complete rehab. Sold as-is. No survey
Key facts
- Close to parks
- Wooded backyard
- Close to schools
Tags
Property features AI
Finance
- Other: Possession negotiable; Earnest money held; Some rehab work noted (2025)
- HOA & community: No master association fee required
Exterior
- Parking: Detached garage (owned); Asphalt driveway; 2 parking spaces (2 garage spaces)
- Utilities: Public water; Public sewer; 100 amp electric service
- Home design: Detached single-family home; 2-story layout; Fee simple ownership; Rehab completed in 2025; Estimated living area
- Construction: Frame construction; Built approximately 71–80 years ago; Property was built before 1978
- Exterior features: 50 x 100 lot (less than 0.25 acre); Directions: 162nd St to Cottage Grove, north to address
Interior
- Kitchen: Range; Dishwasher; Refrigerator
- Bedrooms: 3 bedrooms (including a second-floor primary/ master bedroom); Second-floor bedroom approx. 13 x 11; Second-floor bedroom approx. 12 x 9; Second-floor master bedroom approx. 12 x 12
- Bathrooms: 2 full bathrooms
- Heating & cooling: Natural gas heating; Central air conditioning
- Interior features: 7 rooms total; Eating area/table space in kitchen
- Laundry & utility: Dedicated laundry room
Neighborhood map
What this means for you Summary
Snapshot
- This is a 3-bed/1.0-bath single-family listed at $240k.
Deal economics
- At list price, monthly cash flow is $544 ($7k/yr) — positive.
- The deal already cash-flows at list — no discount required.
- Meets the 1% rule at list price ($3k rent vs $240k).
- Recommended offer: $226k (6.0% below list) — sets the bar for market timing.
Location & tenants
- Location reads 77/100 on livability (#167 in IL, #3,071 nationally) — a middle-class / working-renter tenant base. Strengths: commute A+, housing A+, cost of living A; Watch: crime C-, amenities C-, schools D+.
- Thornton Twp Hsd 205 (suburban): math 7% / reading 8% proficiency, ranked #594 of 620 in IL (top 96%) — low school quality limits family demand, transient renter base, plan for 1-2y turnover.
- Market conditions: 135 active listings in the ZIP; 8 comparable units currently listed for rent nearby; rentals leasing fast (median 8d on market — plan ~1-2 weeks tenant-placement turnaround); 6,272 units permitted in Cook County in 2024 (4,658 in 5+ unit buildings).
Forward outlook
- Local home prices are declining (-3.0%/yr); year-one equity from $2k of loan paydown is wiped out by about $7k of value loss. Plan a longer hold.
Negotiation context
- It's been on market 86 days — a 6% lower offer ($226k) is reasonable based on typical stale-listing flexibility.
- 4 sale attempts since 19y ago with the ask held roughly flat each time — persistent listings suggest the price (not the market) is what's stuck; bring a comps-based counter.
- Current owner paid $105k; list at $240k implies a 128% gain — meaningful room to come down on a strong offer.
Risks & watch-outs
- Watch-outs: property tax is 2.6% of price; built in 1951 — expect roof / HVAC / electrical / plumbing capex.
- Climate carrying-cost: moderate flood risk — expect insurance premiums to compound above CPI over the hold.
Questions for the listing agent
- It's been on market 86 days. Have you received any prior offers? Is the seller open to a 6% concession, seller financing, or rate buy-down credit?
- Built in 1951 — when were the roof, HVAC, electrical panel, plumbing, and water heater last replaced?
- Property tax is high relative to price — has the assessment been appealed recently, and will the sale trigger a re-assessment?
- Why hasn't it sold? Are there any deal-killer items the seller is aware of (foundation, flood, title, zoning, code violations)?
- Is there a deadline driving the sale (1031 exchange, divorce, estate, relocation)? That informs how much negotiation room exists.
- Schools are D-rated, which usually means shorter tenancies and higher turnover. Who's the typical renter profile here, and what's been the actual vacancy rate?
- What's the average days-on-market for RENTAL listings here right now (not sales)? A rising rental-DOM trend means longer vacancies and softer asking-rent achievability than the comps imply.
- What's the recent tenant-quality profile in this submarket — average credit score on applications, eviction rate, late-payment / NSF rate, and stable-employment percentage? A property-management company in the area should have these aggregated.
- How much new for-sale + rental construction is in the pipeline within 1–3 miles? Heavy new supply typically softens prices + rents 12–24 months out; constrained supply supports both.
Investment metrics
- 1% rule
- 1.28% ✓
- Cap rate
- 9.02%
- Cash-on-cash
- 9.72%
- DSCR
- 1.43
- GRM
- 6.5
CMA / ARV
- ARV (on-the-fly)
- $233,478
- Comps found
- 12
Show comp detail 12 sales within ~0.75 mi
| Address | Dist | Beds/Ba | Sqft | Sold | Price | $/sf | Match |
|---|---|---|---|---|---|---|---|
| 1012 E 159th Pl | 0.26mi | 3/2.0 | 1,600 (+5%) | 1mo | $190,000 | $119 | 75 |
| 15547 Drexel Ave | 0.44mi | 3/2.5 | 1,600 (+5%) | 2mo | $187,500 | $117 | 64 |
| 702 E 162nd Pl | 0.41mi | 3/2.0 | 1,400 (-8%) | 1mo | $230,000 | $164 | 62 |
| 746 E 157th St | 0.29mi | 4/2.0 (+1) | 1,403 (-8%) | 3mo | $180,000 | $128 | 62 |
| 15554 S Park Ave | 0.69mi | 3/2.0 | 1,530 (+0%) | 4mo | $300,000 | $196 | 60 |
| 16211 Joyce Cir | 0.51mi | 3/2.0 | 1,424 (-7%) | 3mo | $239,000 | $168 | 58 |
| 16080 Marion Dr | 0.29mi | 4/2.0 (+1) | 1,700 (+11%) | 1mo | $290,000 | $171 | 58 |
| 15439 University Ave | 0.71mi | 3/1.5 | 1,428 (-6%) | 1mo | $250,000 | $175 | 54 |
| 615 E 156th Pl | 0.35mi | 3/2.0 | 1,300 (-15%) | 2mo | $198,650 | $153 | 54 |
| 686 E 155th St | 0.58mi | 2/1.0 (-1) | 1,400 (-8%) | 2mo | $157,000 | $112 | 53 |
| 15518 Maple St | 0.65mi | 4/2.0 (+1) | 1,345 (-12%) | 1mo | $120,000 | $89 | 40 |
| 943 E 164th Ct | 0.67mi | 4/3.0 (+1) | 1,652 (+8%) | 3mo | $185,000 | $112 | 39 |
Match score weights: distance 35% · size 25% · config 20% · recency 20%. Top-matched comps best support the ARV.
Projected returns pro-forma
-3.0% appreciation · 3.0% rent growth · sell at horizon
- IRR
- -1.6%
- Equity multiple
- 0.94×
- Total profit
- $-4,024
- Equity at exit
- $35,770
- IRR
- 8.2%
- Equity multiple
- 1.62×
- Total profit
- $41,891
- Equity at exit
- $20,742
Cash invested: $67,172 (down + closing). Projections, not guarantees.
Landlord ↔ Tenant lean methodology
- Overall (STATE)
- 43 Moderately Tenant-Leaning
- State Illinois
- 43 Moderately Tenant-Leaning · D+7
- County
- — inherits STATE
- City
- — inherits STATE
ZIP-level market 60473
- Active inventory
- 135
- Price-to-rent
- 6.5×
Monthly cashflow live
- Estimated rent
- $3,078 high interval (Pro) →
- Mortgage (P&I)
- −$1,258
- Tax from tax record
- −$529 /mo · $6,353/yr
- Insurance
- −$100
- HOA
- −$0
- Vacancy / Maint / Mgmt
- −$646
- Net cashflow
- $544
Break-even live
UW: 25.0% down · 7.5% · 30yr · 1.5% tax · 5.0% vac · 8.0% maint · 8.0% mgmt
Financing live
Cash to close
- Down payment
- $59,975
- Closing costs
- $7,197
- Reserves months
- —
- Total cash needed
- —
Loan-product check · same deal, 3 products live
Conventional
25% down · 7.5% · 30yr
- Down + closing
- —
- Monthly P&I
- —
- Monthly cashflow
- —
- DSCR
- —
- Eligible?
- —
Personal DTI + credit; lowest rate.
DSCR
20% down · 8.5% · 30yr
- Down + closing
- —
- Monthly P&I
- —
- Monthly cashflow
- —
- DSCR
- —
- Eligible?
- —
No personal income docs; deal must DSCR.
Hard money
10% down · 12.0% · 12mo
- Down + closing
- —
- Monthly P&I
- —
- Monthly cashflow
- —
- DSCR
- —
- Eligible?
- —
Short-term bridge; refi at stabilization.
Rent comps 8 comps
| Address | Beds | Baths | Sqft | Rent | $/sqft | DOM | Units | Dist |
|---|---|---|---|---|---|---|---|---|
| 16246 Dobson Ave South Holland, IL | 3.0 | 2.0 | 1250 | $3,170 | $2.54 | 1d | 1 | 0.50mi |
| 16001 Avalon Ave South Holland, IL | 3.0 | 2.0 | 1136 | $3,330 | $2.93 | 6d | 1 | 0.53mi |
| 15509 Park Ln South Holland, IL | 4.0 | 1.5 | 1200 | $3,400 | $2.83 | 7d | 1 | 0.60mi |
| 15509 Park Ln South Holland, IL | 4.0 | 1.5 | 1200 | $3,400 | $2.83 | 24d | 1 | 0.60mi |
| 15707 Dante Dr South Holland, IL | 3.0 | 2.0 | 1800 | $2,950 | $1.64 | 2d | 1 | 0.82mi |
| 15231 Hastings Dr Dolton, IL | 4.0 | 1.5 | 1487 | $2,146 | $1.44 | 7d | 1 | 0.96mi |
| 14916 Langley Ave Dolton, IL | 3.0 | 1.5 | 1418 | $2,500 | $1.76 | 24d | 1 | 1.24mi |
| 15400 Merrill Ave South Holland, IL | 4.0 | 2.0 | 1508 | $3,330 | $2.21 | 22d | 1 | 1.47mi |
Listing history 29 events
-
2026-06-18days on market $239,900 Active 86 DOM
-
2026-06-17days on market $239,900 Active 85 DOM
-
2026-06-16days on market $239,900 Active 84 DOM
-
2026-06-15days on market $239,900 Active 83 DOM
-
2026-06-13days on market $239,900 Active 81 DOM
-
2026-06-13days on market $239,900 Active 80 DOM
-
2026-06-09days on market $239,900 Active 77 DOM
-
2026-06-08days on market $239,900 Active 76 DOM
-
2026-06-07days on market $239,900 Active 75 DOM
-
2026-06-04days on market $239,900 Active 72 DOM
-
2026-06-03days on market $239,900 Active 71 DOM
-
2026-06-02days on market $239,900 Active 70 DOM
-
2026-06-01days on market $239,900 Active 69 DOM
-
2026-05-31days on market $239,900 Active 68 DOM
-
2026-05-16price $239,900
-
2026-03-24$245,000 Active
-
2026-02-28historical
-
2026-02-09price
-
2026-01-05Active
-
2024-08-07soldstatus $105,000
-
2024-08-05soldstatus $105,000 Closed 352-char remark
Show marketing remark (352 chars)
Investor special! Charming two-story home that sits on a garden oasis deep lot with a wooded backyard. Formal Living Room/Dining Room. Home has so much potential for the right investor. There is a loft upstairs for added room (potential to add 2nd bathroom upstairs). Please note there is no basement. Homes need complete rehab. Sold as-is. No survey
-
2024-06-25status Pending 352-char remark
Show marketing remark (352 chars)
Investor special! Charming two-story home that sits on a garden oasis deep lot with a wooded backyard. Formal Living Room/Dining Room. Home has so much potential for the right investor. There is a loft upstairs for added room (potential to add 2nd bathroom upstairs). Please note there is no basement. Homes need complete rehab. Sold as-is. No survey
-
2024-06-12$98,000 Active 352-char remark
Show marketing remark (352 chars)
Investor special! Charming two-story home that sits on a garden oasis deep lot with a wooded backyard. Formal Living Room/Dining Room. Home has so much potential for the right investor. There is a loft upstairs for added room (potential to add 2nd bathroom upstairs). Please note there is no basement. Homes need complete rehab. Sold as-is. No survey
-
2007-11-02soldstatus $111,000
-
2007-10-30soldstatus $111,000
-
2007-09-27historical
-
2007-07-31$114,900
-
1983-11-10soldstatus $38,000
-
1983-11-10soldstatus $38,000
ⓘ Source: listings_history table (triggers on properties + properties_extension) + one-shot
backfill from property_details.listing_events for pre-trigger history.
Tax reassessment forecast IL · Partial reset (capped growth)
- Current annual tax
- $6,353 · $529/mo
- Projected year-2 tax
- $6,353 · $529/mo
- Expected delta
- $0/yr ($0/mo · 0.0%)
ⓘ Screening estimate from a state-policy table — verify with the county assessor before closing.
Climate risk First Street
- Flood 5/10 Major FEMA zone X (shaded) · 24% chance over 30 yrs
- Wildfire 1/10 Low
- Heat 3/10 Moderate 7 d/yr ≥103°F today · 15 d/yr by 30 yrs out
- Wind 2/10 Low
- Air quality 4/10 Moderate 4 unhealthy d/yr today · 5 by 30 yrs out
Nearby sold comps map
Loading sold comps map…
Walkable amenities ~0.75 mi
Loading nearby amenities…
Taxation est. · year 1
- Rental income
- $36,937
- − Mortgage interest
- −$13,438
- − Property taxes
- −$6,353
- − Insurance
- −$1,200
- − Repairs & maintenance
- −$2,955
- − Management
- −$2,955
- − Depreciation
- −$6,979
- Taxable income
- $3,057
- Est. tax owed @ 24.0%
- −$734
- After-tax cash flow
- $5,797/yr
For passive investors: Depreciation is non-cash, so a rental often shows a tax loss while cash-flowing — sheltering income. Rental losses are passive: they offset passive income freely, and up to $25,000/yr can offset ordinary (W-2) income if you actively participate and your MAGI is under $100k (phasing out to $0 by $150k); unused losses carry forward. On sale, claimed depreciation is recaptured at up to 25%, and gains may owe capital-gains tax (a 1031 exchange can defer both). Figures are a year-1 estimate at your 24.0% rate — not tax advice; consult a CPA.
Schools (NCES district)
- District
- Thornton Twp Hsd 205
- NCES district ID
- 1738970
- Math proficiency
- 7% ▬ 0.00%
- Reading proficiency
- 8% ▼ -2.00%
- Median HH income
- $43,392
- Composite
- 6.92/100
- National rank
- #9976
- State rank
- #594 of 620 in IL
Livability — South Holland
- Score
- 77/100
- State rank
- #167
- US rank
- #3071
Category grades
Schools grade is shown separately in the Schools card above.
Census & demographics
- Census place
- South Holland, IL
- City population
- 21,407
- Population (ZIP)
- 21,407
Population outlook (Cook County) Hauer SSP2
- Today (2025)
- 5,347,519 people
- By 2030
- 5,357,703 · +0.2%
- By 2040
- 5,324,924 · -0.4%
- By 2050
- 5,230,762 · -2.2%
- By 2075
- 4,785,735 · -10.5%
- By 2100
- 4,188,836 · -21.7%
Race, ethnicity, and origin ACS 2023
- Neighborhood character
- Predominantly Black (75%)
- Race & ethnicity
- Black 75% White 10% Hispanic / Latino 10% Two or more races 3% Asian 1%
- Hispanic origin (detail)
- Mexican 9% Puerto Rican 1%
- Common ancestry
- Iranian 3% Romanian 2%
- Foreign-born
- 6% · Canada, China
- Languages at home
- 87% English-only · Spanish 8% Other Asian/Pacific 1% Russian/Polish/Slavic 1%
Political lean MEDSL · Cook
- 2024 margin
- Solid D (+42.0) · D 70.4% · R 28.4% · Other 1.2%
- 2008→2024 swing
- -11.4pp toward R · 2008: 53.4pp · 2024: 42.0pp
- All cycles
- 2024: D+42.0 2020: D+50.3 2016: D+53.0 2012: D+49.4 2008: D+53.4
Not yet ingested
- Civics
- —
Market trends
- HPI YoY
- ▼ -114.36%
- Current HPI
- 201.2479
- Rent YoY
- —
- Metro
- —
- State GDP YoY
- ▲ 1.59%
- F500 in state
- 60
Industry mix (Fortune 500 HQ in IL)
| Industry | F500 HQs | Revenue |
|---|---|---|
| Insurance | 4 | $201B |
|
||
| Consumer Goods | 4 | $87B |
|
||
| Industrial Machinery | 3 | $64B |
|
||
| Healthcare | 2 | $55B |
|
||
| Retail / Pharmacy | 1 | $148B |
|
||
| Agriculture / Food | 1 | $86B |
|
||
Price history
+531.3% since first listed15 events — show timeline
- 2026-05-16 Price Changed $239,900 MRED as Distributed by MLS Grid
- 2026-03-24 Listed $245,000 MRED as Distributed by MLS Grid
- 2026-02-28 Listing Removed — MRED as Distributed by MLS Grid
- 2026-02-09 Price Changed — MRED as Distributed by MLS Grid
- 2026-01-05 Listed — MRED as Distributed by MLS Grid
- 2024-08-07 Sold (Public Records) $105,000 Public Records
- 2024-08-05 Sold (MLS) $105,000 MRED as Distributed by MLS Grid
- 2024-06-25 Pending — MRED as Distributed by MLS Grid
- 2024-06-12 Listed $98,000 MRED as Distributed by MLS Grid
- 2007-11-02 Sold (Public Records) $111,000 Public Records
- 2007-10-30 Sold (MLS) $111,000 MRED as Distributed by MLS Grid
- 2007-09-27 Listing Removed — MRED as Distributed by MLS Grid
- 2007-07-31 Listed $114,900 MRED as Distributed by MLS Grid
- 1983-11-10 Sold (Public Records) $38,000 Public Records
- 1983-11-10 Sold (Public Records) $38,000 Public Records
Property tax history
+1.7%/yrLatest (2023): $6,353 · +41.7% YoY. Source: county tax records.
Cash-flow waterfall
monthlySold comps — $/sqft
last 12 mo · ≤1 miLoading sold comps…