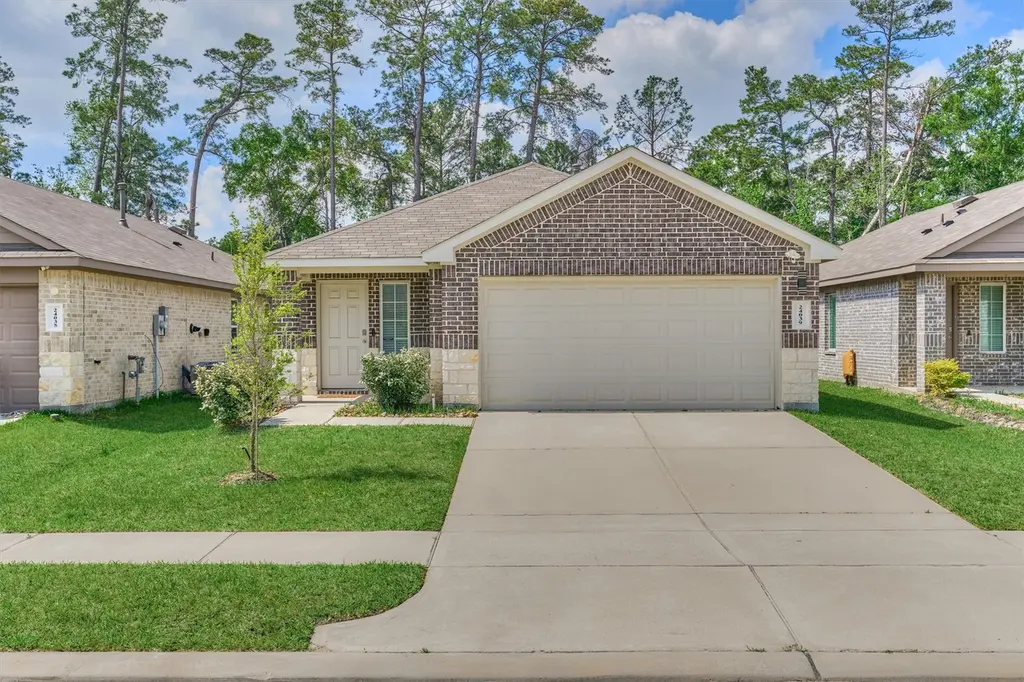
24039 Kentwood Springs Dr · Spring, TX
Flood risk 5/10 · Moderate
- FEMA flood zone
- X (unshaded)
- Chance of flooding over 30 yrs
- 0.66%
- Est. flood insurance / yr
- $507 – $1,088
Fire risk 3/10 · Minor
- Est. fire insurance / yr
- $1,222 – $2,270
Heat risk 8/10 · Major
- Hot days now (above 110°F)
- 7 days/yr
- Hot days in 30 yrs
- 24 days/yr
Wind risk 8/10 · Major
- Chance of severe wind over 30 yrs
- 99.0%
Air-quality risk 3/10 · Minor
- Unhealthy air days now
- 3 days/yr
- Unhealthy air days in 30 yrs
- 3 days/yr
Risk factors via First Street. Map © Google.
Why this score? — see what drove the D- grade
The composite is a weighted blend of 9 inputs, each scored 0–100. Each bar is that input's sub-score; the figure is the points it added to the 100-point composite (weight × sub-score).
- ARV discount +14.8/15.0
- Cash flow +7.6/30.0
- Condition / age +4.0/5.0
- 1% rule +3.8/10.0
- Livability +3.3/5.0
- Rent growth +2.4/5.0
- Schools +2.0/10.0
- DSCR +1.7/10.0
- Appreciation +0.0/10.0
$255,000
🖨 Deal sheet 📄 Offer letter ✓ Due diligence
Listing remarks
Welcome home! This charming single-story offers added privacy with no rear neighbors, creating the perfect setting for relaxing evenings or weekend BBQs on your patio. Inside, the open-concept layout is designed for entertaining, with a spacious island kitchen that truly is the heart of the home. Whether you're hosting friends or cooking up your favorite meals, the home chef will love the generous counter space, storage, and seamless flow into the living and dining areas. This newer, move-in ready home also includes the refrigerator, washer, and dryer which will make your move that much easier. Make this home yours today, where you'll live, work, and play your way!
Key facts
- No rear neighbors
- Island kitchen
- Spacious bedrooms
Tags
Property features AI
Finance
- HOA & community: Community managed by Inframark Community Management; Annual association fee of $400
Exterior
- Parking: Attached garage; 2 garage spaces
- Utilities: Public water; Public sewer
- Home design: Residential property; Built in 2022; Slab foundation
- Construction: Brick and cement siding construction; Composition roof
- Exterior features: Cleared lot
Interior
- Kitchen: Dishwasher; Disposal; Gas Range
- Bedrooms: 3 total rooms
- Flooring: Carpet; Vinyl
- Bathrooms: 2 full bathrooms
- Heating & cooling: Central heating (Gas); Central electric air conditioning
- Interior features: Dishwasher; Disposal; Gas Range
Neighborhood map
What this means for you Summary
Snapshot
- This is a 3-bed/2.0-bath single-family listed at $255k. Condition is rated good.
Deal economics
- At list price, monthly cash flow is $-301 ($-4k/yr) — negative.
- To cash-flow at today's rent, offer at most $202k (20.9% below list).
- To meet the 1% rule (rent ≥ 1% of price), the offer needs to be $225k (11.7% below list).
- Recommended offer: $202k (20.9% below list) — sets the bar for cash-flow.
Location & tenants
- Location reads 66/100 on livability (#635 in TX) — a middle-class / working-renter tenant base. Strengths: cost of living A+, housing A+, employment B; Watch: crime D, amenities F, commute F.
- Spring ISD (suburban): math 19% / reading 26% proficiency, ranked #730 of 826 in TX (top 88%) — low school quality limits family demand, transient renter base, plan for 1-2y turnover; 66% free/reduced lunch — lower-income household profile, screen leases tightly.
- Zoned schools: Chet Burchett El (math 30% / reading 35%, grade F, #2,234 of 4,322 statewide, top 52%, 904 students, 82% FRL); Rickey C Bailey Middle (math 15% / reading 23%, grade F, #1,466 of 1,662 statewide, top 89%, 1,065 students, 85% FRL); Spring H S (math 12% / reading 21%, grade F, #1,497 of 1,632 statewide, top 92%, 2,760 students, 72% FRL).
- Market conditions: Rents soft (-0.3%/yr); 595 active listings in the ZIP; solid renter incomes; 29,883 units permitted in Harris County in 2024 (8,621 in 5+ unit buildings).
- This rent runs 30% of the median local income ($89k/yr) — at the standard rent-burdened threshold; future hikes will face affordability resistance.
Forward outlook
- Local home prices are declining (-3.0%/yr); year-one equity from $2k of loan paydown is wiped out by about $8k of value loss. Plan a longer hold.
- Harris County population projected at +47% by 2050 — long-run rental-demand tailwind backs the buy-and-hold thesis.
Negotiation context
- Only 12 days on market — expect competitive offers; lowballing is unlikely to land.
- 2 sale attempts with the ask held roughly flat each time — persistent listings suggest the price (not the market) is what's stuck; bring a comps-based counter.
Risks & watch-outs
- Watch-outs: property tax is 2.8% of price.
- Climate carrying-cost: moderate flood risk; severe wind risk, 99% chance of damaging wind over 30y; extreme-heat days projected 7→24/yr by 2055 (HVAC capex compounding) — expect insurance premiums to compound above CPI over the hold.
Questions for the listing agent
- What do current leases actually rent for vs. the listed asking? Can we see a recent rent roll and the last 12 months of T-12 income?
- Property tax is high relative to price — has the assessment been appealed recently, and will the sale trigger a re-assessment?
- What does the HOA fee cover, when was the last increase, and are there any pending special assessments or reserve-fund shortfalls?
- Is there a deadline driving the sale (1031 exchange, divorce, estate, relocation)? That informs how much negotiation room exists.
- Crime grade is D in this area — have there been break-ins, vandalism, or insurance claims at this property in the last 3 years? What carrier currently insures it and at what premium?
- The area grade is low — what's the realistic commute time and amenity access for the typical tenant pool here? Any planned neighborhood developments (good or bad) we should know about?
- What's the average days-on-market for RENTAL listings here right now (not sales)? A rising rental-DOM trend means longer vacancies and softer asking-rent achievability than the comps imply.
- What's the recent tenant-quality profile in this submarket — average credit score on applications, eviction rate, late-payment / NSF rate, and stable-employment percentage? A property-management company in the area should have these aggregated.
- How much new for-sale + rental construction is in the pipeline within 1–3 miles? Heavy new supply typically softens prices + rents 12–24 months out; constrained supply supports both.
Investment metrics
- 1% rule
- 0.88% ✗
- Cap rate
- 4.87%
- Cash-on-cash
- -5.07%
- DSCR
- 0.77
- GRM
- 9.4
CMA / ARV
- ARV (median comp)
- $304,310
- List price
- $255,000
- Delta
- -14.89%
- Verdict
- UNDERPRICED
- Comps
- 20 within 2.0 mi
Show comp detail 7 sales within ~0.75 mi
| Address | Dist | Beds/Ba | Sqft | Sold | Price | $/sf | Match |
|---|---|---|---|---|---|---|---|
| 5718 Simcrest Grove Dr | 0.47mi | 3/2.0 | 1,396 (-0%) | 18mo | $261,165 | $187 | 62 |
| 5626 Aspen Acres Dr | 0.38mi | 3/2.0 | 1,396 (-0%) | 23mo | $245,990 | $176 | 62 |
| 4806 Quailgate Dr | 0.53mi | 3/2.0 | 1,280 (-9%) | 7mo | $205,000 | $160 | 55 |
| 24031 Saddlestone Green Dr | 0.31mi | 3/2.0 | 1,539 (+10%) | 24mo | $277,990 | $181 | 49 |
| 5810 Hampton Valley Dr | 0.50mi | 3/2.0 | 1,489 (+6%) | 21mo | $255,990 | $172 | 49 |
| 23811 Firegate Dr | 0.64mi | 4/2.0 (+1) | 1,362 (-3%) | 22mo | $200,000 | $147 | 42 |
| 23814 Gold Cypress Dr | 0.64mi | 3/2.0 | 1,539 (+10%) | 19mo | $279,990 | $182 | 38 |
Match score weights: distance 35% · size 25% · config 20% · recency 20%. Top-matched comps best support the ARV.
Projected returns pro-forma
-3.0% appreciation · 0.0% rent growth · sell at horizon
- IRR
- -28.9%
- Equity multiple
- 0.06×
- Total profit
- $-66,890
- Equity at exit
- $38,021
- IRR
- -52.1%
- Equity multiple
- -0.51×
- Total profit
- $-107,537
- Equity at exit
- $22,048
Cash invested: $71,400 (down + closing). Projections, not guarantees.
Landlord ↔ Tenant lean methodology
- Overall (STATE)
- 87 Strongly Landlord-Friendly
- State Texas
- 87 Strongly Landlord-Friendly · R+5
- County
- — inherits STATE
- City
- — inherits STATE
ZIP-level market 77373
- Rents YoY
- -0.3%
- Active inventory
- 595
- Price-to-rent
- 9.4×
Monthly cashflow live
- Estimated rent
- $2,251 medium interval (Pro) →
- Mortgage (P&I)
- −$1,337
- Tax from tax record
- −$604 /mo · $7,243/yr
- Insurance
- −$106
- HOA
- −$33
- Vacancy / Maint / Mgmt
- −$473
- Net cashflow
- $-301
Break-even live
UW: 25.0% down · 7.5% · 30yr · 1.5% tax · 5.0% vac · 8.0% maint · 8.0% mgmt
Financing live
Cash to close
- Down payment
- $63,750
- Closing costs
- $7,650
- Reserves months
- —
- Total cash needed
- —
Loan-product check · same deal, 3 products live
Conventional
25% down · 7.5% · 30yr
- Down + closing
- —
- Monthly P&I
- —
- Monthly cashflow
- —
- DSCR
- —
- Eligible?
- —
Personal DTI + credit; lowest rate.
DSCR
20% down · 8.5% · 30yr
- Down + closing
- —
- Monthly P&I
- —
- Monthly cashflow
- —
- DSCR
- —
- Eligible?
- —
No personal income docs; deal must DSCR.
Hard money
10% down · 12.0% · 12mo
- Down + closing
- —
- Monthly P&I
- —
- Monthly cashflow
- —
- DSCR
- —
- Eligible?
- —
Short-term bridge; refi at stabilization.
HOA detail
- Monthly dues
- $33 · $396/yr
Listing history 12 events
-
2026-06-13days on market $255,000 Pending 12 DOM
-
2026-06-13days on market $255,000 Pending 11 DOM
-
2026-06-09days on market $255,000 Pending 8 DOM
-
2026-06-08days on market $255,000 Pending 7 DOM
-
2026-06-07statusdays on market $255,000 Pending 6 DOM
-
2026-06-04days on market $255,000 Active 3 DOM
-
2026-06-03days on market $255,000 Active 2 DOM
-
2026-06-02pricedays on market $255,000 Active 1 DOM
-
2026-06-01days on market $259,000 Active 61 DOM
-
2026-05-31days on market $259,000 Active 60 DOM
-
2026-05-04price $259,000 676-char remark
-
2026-04-01$265,000 Active 676-char remark
ⓘ Source: listings_history table (triggers on properties + properties_extension) + one-shot
backfill from property_details.listing_events for pre-trigger history.
Tax reassessment forecast TX · Resets to sale price
- Current annual tax
- $7,243 · $604/mo
- Projected year-2 tax
- $7,243 · $604/mo
- Expected delta
- $0/yr ($0/mo · 0.0%)
ⓘ Screening estimate from a state-policy table — verify with the county assessor before closing.
Climate risk First Street
- Flood 5/10 Major FEMA zone X (unshaded) · 66% chance over 30 yrs
- Wildfire 3/10 Moderate
- Heat 8/10 Severe 7 d/yr ≥110°F today · 24 d/yr by 30 yrs out
- Wind 8/10 Severe 99% chance of damaging wind over 30 yrs
- Air quality 3/10 Moderate 3 unhealthy d/yr today · 3 by 30 yrs out
Nearby sold comps map
Loading sold comps map…
Walkable amenities ~0.75 mi
Loading nearby amenities…
Taxation est. · year 1
- Rental income
- $27,017
- − Mortgage interest
- −$14,284
- − Property taxes
- −$7,243
- − Insurance
- −$1,275
- − Repairs & maintenance
- −$2,161
- − Management
- −$2,161
- − HOA
- −$396
- − Depreciation
- −$7,418
- Taxable loss
- −$7,922
- Est. tax savings @ 24.0%
- +$1,901
- After-tax cash flow
- $-1,716/yr
For passive investors: Depreciation is non-cash, so a rental often shows a tax loss while cash-flowing — sheltering income. Rental losses are passive: they offset passive income freely, and up to $25,000/yr can offset ordinary (W-2) income if you actively participate and your MAGI is under $100k (phasing out to $0 by $150k); unused losses carry forward. On sale, claimed depreciation is recaptured at up to 25%, and gains may owe capital-gains tax (a 1031 exchange can defer both). Figures are a year-1 estimate at your 24.0% rate — not tax advice; consult a CPA.
Condition & rehab AI · 1 photo
This charming single-story home is move-in ready with a good condition score and minimal repairs needed. Upgrades to the exterior, interior, and kitchen can significantly enhance its value for both resale and rental.
Value-add opportunities
- Both Painting the exterior and interior walls — Fresh paint enhances curb appeal and interior aesthetics.
- Both Landscaping improvements — Enhanced landscaping can increase both resale and rental value.
- Resale Upgrading the kitchen backsplash — A modern backsplash can significantly boost the home's appeal to potential buyers.
- Resale Upgrading the flooring in high-traffic areas — Updated flooring can make the home more appealing to buyers looking for a move-in ready property.
Renovation cost estimate screening
Value-add ROI direction
- Both Painting the exterior and interior walls — Fresh paint enhances curb appeal and interior aesthetics. ↑
- Both Landscaping improvements — Enhanced landscaping can increase both resale and rental value. ↑
- Resale Upgrading the kitchen backsplash — A modern backsplash can significantly boost the home's appeal to potential buyers. ↑
- Resale Upgrading the flooring in high-traffic areas — Updated flooring can make the home more appealing to buyers looking for a move-in ready property. ↑
ⓘ Cost ranges are severity-bucket heuristics (US national rule-of-thumb). Get contractor quotes + a written scope before underwriting a rehab budget.
Schools (NCES district)
- District
- Spring ISD
- NCES district ID
- 4841220
- Math proficiency
- 19% ▼ -13.00%
- Reading proficiency
- 26% ▼ -6.00%
- Median HH income
- $51,584
- Composite
- 20.12/100
- National rank
- #8643
- State rank
- #730 of 826 in TX
Livability — Spring
- Score
- 66/100
- State rank
- #635
- US rank
- #12101
Category grades
Schools grade is shown separately in the Schools card above.
Census & demographics
- Census place
- Spring, TX
- County
- Harris County · 4,702,590 people
- City population
- 430,529
- Metro
- Houston-The Woodlands-Sugar Land, TX
- Population (ZIP)
- 69,739
- Household income
- $88,617
- Rent vs Own
- Severe rent burden
- 1050.0
Population outlook (Harris County) Hauer SSP2
- Today (2025)
- 5,571,493 people
- By 2030
- 6,089,821 · +9.3%
- By 2040
- 7,142,806 · +28.2%
- By 2050
- 8,185,864 · +46.9%
- By 2075
- 10,574,329 · +89.8%
- By 2100
- 12,109,958 · +117.4%
Race, ethnicity, and origin ACS 2023
- Neighborhood character
- Diverse neighborhood (Simpson 0.69)
- Race & ethnicity
- Hispanic / Latino 40% White 30% Black 23% Two or more races 22% Asian 3%
- Hispanic origin (detail)
- Mexican 27% Puerto Rican 2% Cuban 2% Dominican 2%
- Common ancestry
- Lithuanian 2% Italian 1% Slovak 1%
- Foreign-born
- 17% · Canada, Jamaica, Vietnam
- Languages at home
- 64% English-only · Spanish 32% Vietnamese 1% Other Indo-European 1%
Political lean MEDSL · Harris
- 2024 margin
- Lean D (+5.5) · D 52.0% · R 46.4% · Other 1.6%
- 2008→2024 swing
- +3.9pp toward D · 2008: 1.6pp · 2024: 5.5pp
- All cycles
- 2024: D+5.5 2020: D+13.3 2016: D+12.4 2012: D+0.1 2008: D+1.6
Not yet ingested
- Civics
- —
Market trends
- HPI YoY
- ▼ -142.98%
- Current HPI
- 251.7231
- Rent YoY
- ▼ -0.30%
- Metro
- Houston-The Woodlands-Sugar Land, TX
- State GDP YoY
- ▲ 3.95%
- F500 in state
- 110
Industry mix (Fortune 500 HQ in TX)
| Industry | F500 HQs | Revenue |
|---|---|---|
| Energy | 16 | $1,198B |
|
||
| Technology | 5 | $198B |
|
||
| Engineering / Construction | 4 | $72B |
|
||
| Energy Services | 3 | $60B |
|
||
| Utilities | 3 | $41B |
|
||
| Healthcare | 2 | $330B |
|
||
Price history
-3.8% since first listed6 events — show timeline
- 2026-06-13 Pending — HARMLS
- 2026-06-06 Pending — HARMLS
- 2026-06-01 Listing Removed — HARMLS
- 2026-06-01 Listed $255,000 HARMLS
- 2026-05-04 Price Changed $259,000 HARMLS
- 2026-04-01 Listed $265,000 HARMLS
Property tax history
+7.8%/yrLatest (2025): $7,243 · +2.6% YoY. Source: county tax records.
Cash-flow waterfall
monthlySold comps — $/sqft
last 12 mo · ≤1 miLoading sold comps…