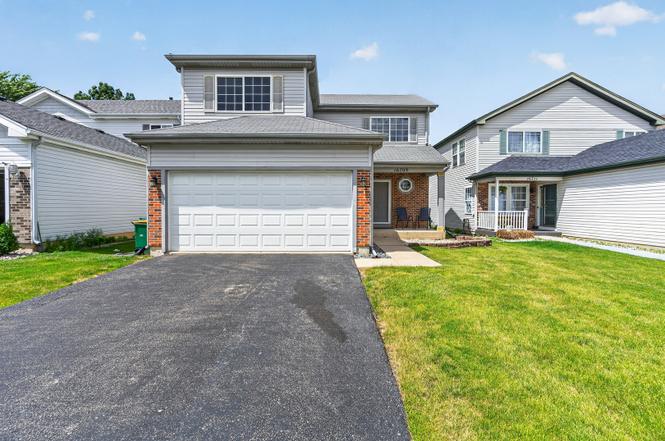
16709 S Morel St · Lockport, IL
Flood risk 1/10 · Minimal
- FEMA flood zone
- X (unshaded)
- Chance of flooding over 30 yrs
- 0.0%
- Est. flood insurance / yr
- $507 – $1,088
Fire risk 1/10 · Minimal
- Est. fire insurance / yr
- $804 – $1,492
Heat risk 3/10 · Minor
- Hot days now (above 102°F)
- 7 days/yr
- Hot days in 30 yrs
- 15 days/yr
Wind risk 2/10 · Minimal
- Chance of severe wind over 30 yrs
- —
Air-quality risk 3/10 · Minor
- Unhealthy air days now
- 2 days/yr
- Unhealthy air days in 30 yrs
- 4 days/yr
Risk factors via First Street. Map © Google.
Why this score? — see what drove the D- grade
The composite is a weighted blend of 9 inputs, each scored 0–100. Each bar is that input's sub-score; the figure is the points it added to the 100-point composite (weight × sub-score).
- Cash flow +11.7/30.0
- ARV discount +7.5/15.0
- 1% rule +4.1/10.0
- Livability +4.0/5.0
- Rent growth +3.5/5.0
- DSCR +3.4/10.0
- Schools +3.4/10.0
- Condition / age +2.5/5.0
- Appreciation +0.0/10.0
$325,000
🖨 Deal sheet 📄 Offer letter ✓ Due diligence
Listing remarks MLS
Centrally located in the desirable Parker Ridge subdivision, this home has everything that you are looking for and just awaiting your personal touches! Brand new wood laminate flooring was recently added to the main level and new carpeting was added upstairs. The entire home has been professionally painted in beautiful neutral hues. Enjoy the spacious backyard with a stone patio, perfect for entertaining. The basement is a blank canvas, waiting to be completed. There is a 2nd living space and a partial bedroom for your guests. Excellent location within walking distance to a park, pond, and close to shopping, dining, and expressways. Whether you are just starting the next chapter in your life, downsizing, or anything in between, this is a must see! Tons of potential!!
Key facts
- Bright kitchen
- Scenic pond
- Neighborhood park
Tags
Property features AI
Finance
- Other: School bus service and interstate access
- Financial info: Not currently leased
- HOA & community: Homeowners association fee $70 per month; HOA covers insurance and lawn care; No required master association fee; Community amenities include park and lake
Exterior
- Parking: Attached garage with 2 garage spaces; Asphalt driveway; Garage door opener
- Security: CO detectors
- Utilities: Public water; Public sewer; Electric service via circuit breakers
- Home design: Detached single-family home; Two-story layout; Fee simple ownership within a homeowners association; Facing direction not specified
- Construction: Approximately 26–30 years old; Vinyl siding with brick accents; Asphalt roof; Concrete perimeter foundation
- Exterior features: Patio; Porch; Park and lake nearby; Sidewalks and paved streets
Interior
- Kitchen: Range; Microwave; Refrigerator; Eating area / table space; Pantry/closet
- Bedrooms: Master bedroom on second level (full bath); Second bedroom on second level (13 x 12); Third bedroom on second level (11 x 10)
- Flooring: Luxury vinyl in main living areas (living room, kitchen, dining); Carpet in bedrooms; Vinyl in laundry
- Bathrooms: Two full bathrooms and one half bathroom
- Heating & cooling: Natural gas forced-air heating; Central air conditioning
- Interior features: Walk-in closets; All windows have window treatments; Ceiling fan(s); CO detectors; Sump pump
- Laundry & utility: Upper-level laundry (space 7 x 5); Washer; Dryer; Water softener (owned)
Neighborhood map
What this means for you Summary
Snapshot
- This is a 3-bed/2.5-bath other listed at $325k.
Deal economics
- At list price, monthly cash flow is $-98 ($-1k/yr) — negative.
- To cash-flow at today's rent, offer at most $308k (5.3% below list).
- To meet the 1% rule (rent ≥ 1% of price), the offer needs to be $297k (8.7% below list).
- Recommended offer: $297k (8.7% below list) — sets the bar for 1% rule.
- Cap rate 5.9% vs local median 3.6% in Lockport — top-decile yield for the area; either an underpriced asset or a hidden risk that comps aren't pricing in. Stress-test before assuming the spread holds.
Location & tenants
- Location reads 79/100 on livability (#116 in IL, #2,034 nationally) — a middle-class / working-renter tenant base. Strengths: crime A+, employment A+, housing A+; Watch: health & safety C-, commute D, amenities D-.
- Lockport Twp Hsd 205 (suburban): math 35% / reading 38% proficiency, ranked #153 of 620 in IL (top 25%) — families likely to look elsewhere, expect single-tenant / working-renter base with shorter leases.
- Zoned schools: Lockport Township High Sch East (math 35% / reading 38%, grade F, #117 of 693 statewide, top 17%, 3,872 students, 0% FRL).
- Market conditions: Rents rising (+3.9%/yr); 131 active listings in the ZIP; 5 comparable units currently listed for rent nearby; rentals leasing fast (median 2d on market — plan ~1-2 weeks tenant-placement turnaround); solid renter incomes; 2,028 units permitted in Will County in 2024 (530 in 5+ unit buildings).
- This rent runs 34% of the median local income ($103k/yr) — at the standard rent-burdened threshold; future hikes will face affordability resistance.
Forward outlook
- Local home prices are declining (-3.0%/yr); year-one equity from $2k of loan paydown is wiped out by about $10k of value loss. Plan a longer hold.
- Will County population projected to shrink 4% by 2050 — rents likely to lag national; underwrite the cash flow, not the appreciation.
Negotiation context
- Only 1 days on market — expect competitive offers; lowballing is unlikely to land.
- 3 sale attempts since 9y ago with the ask held roughly flat each time — persistent listings suggest the price (not the market) is what's stuck; bring a comps-based counter.
- Current owner paid $175k; list at $325k implies a 86% gain — meaningful room to come down on a strong offer.
Questions for the listing agent
- What do current leases actually rent for vs. the listed asking? Can we see a recent rent roll and the last 12 months of T-12 income?
- What does the HOA fee cover, when was the last increase, and are there any pending special assessments or reserve-fund shortfalls?
- Is there a deadline driving the sale (1031 exchange, divorce, estate, relocation)? That informs how much negotiation room exists.
- The area grade is low — what's the realistic commute time and amenity access for the typical tenant pool here? Any planned neighborhood developments (good or bad) we should know about?
- What's the average days-on-market for RENTAL listings here right now (not sales)? A rising rental-DOM trend means longer vacancies and softer asking-rent achievability than the comps imply.
- What's the recent tenant-quality profile in this submarket — average credit score on applications, eviction rate, late-payment / NSF rate, and stable-employment percentage? A property-management company in the area should have these aggregated.
- How much new for-sale + rental construction is in the pipeline within 1–3 miles? Heavy new supply typically softens prices + rents 12–24 months out; constrained supply supports both.
Investment metrics
- 1% rule
- 0.91% ✗
- Cap rate
- 5.93%
- Cash-on-cash
- -1.29%
- DSCR
- 0.94
- GRM
- 9.1
CMA / ARV
No comps found within radius.
Projected returns pro-forma
-3.0% appreciation · 3.91% rent growth · sell at horizon
- IRR
- -17.3%
- Equity multiple
- 0.38×
- Total profit
- $-55,979
- Equity at exit
- $48,459
- IRR
- -7.4%
- Equity multiple
- 0.51×
- Total profit
- $-44,628
- Equity at exit
- $28,100
Cash invested: $91,000 (down + closing). Projections, not guarantees.
Landlord ↔ Tenant lean methodology
- Overall (STATE)
- 43 Moderately Tenant-Leaning
- State Illinois
- 43 Moderately Tenant-Leaning · D+7
- County
- — inherits STATE
- City
- — inherits STATE
ZIP-level market 60441
- Home prices YoY
- -33.0%
- Rents YoY
- 3.9%
- Active inventory
- 131
- Price-to-rent
- 9.1×
Monthly cashflow live
- Estimated rent
- $2,967 high interval (Pro) →
- Mortgage (P&I)
- −$1,704
- Tax from tax record
- −$532 /mo · $6,382/yr
- Insurance
- −$135
- HOA
- −$70
- Vacancy / Maint / Mgmt
- −$623
- Net cashflow
- $-98
Break-even live
UW: 25.0% down · 7.5% · 30yr · 1.5% tax · 5.0% vac · 8.0% maint · 8.0% mgmt
Financing live
Cash to close
- Down payment
- $81,250
- Closing costs
- $9,750
- Reserves months
- —
- Total cash needed
- —
Loan-product check · same deal, 3 products live
Conventional
25% down · 7.5% · 30yr
- Down + closing
- —
- Monthly P&I
- —
- Monthly cashflow
- —
- DSCR
- —
- Eligible?
- —
Personal DTI + credit; lowest rate.
DSCR
20% down · 8.5% · 30yr
- Down + closing
- —
- Monthly P&I
- —
- Monthly cashflow
- —
- DSCR
- —
- Eligible?
- —
No personal income docs; deal must DSCR.
Hard money
10% down · 12.0% · 12mo
- Down + closing
- —
- Monthly P&I
- —
- Monthly cashflow
- —
- DSCR
- —
- Eligible?
- —
Short-term bridge; refi at stabilization.
Rent comps 5 comps
| Address | Beds | Baths | Sqft | Rent | $/sqft | DOM | Units | Dist |
|---|---|---|---|---|---|---|---|---|
| 17419 Yakima Dr Unit 17419 Lockport, IL | 2.0 | 2.0 | 1588 | $3,200 | $2.02 | 1d | 1 | 1.01mi |
| 17215 S Juniper Dr Lockport, IL | 2.0 | 2.0 | 1500 | $3,136 | $2.09 | 1d | 4 | 1.23mi |
| 16704 W Natoma Dr Lockport, IL | 3.0 | 3.0 | 1704 | $3,200 | $1.88 | 12d | 1 | 1.23mi |
| 16551 Karen Springs Dr Lockport, IL | 3.0 | 1.0–2.0 | 1036 | $3,241 | $3.13 | 1d | 47 | 1.29mi |
| 14857 W Victoria Xing Unit 14857 Lockport, IL | 2.0 | 1.5 | 1208 | $2,350 | $1.95 | 20d | 1 | 1.39mi |
HOA detail
- Monthly dues
- $70 · $840/yr
Listing history 2 events
-
2026-06-17remarks 699-char remark
-
2026-06-17$325,000 Active 1 DOM
ⓘ Source: listings_history table (triggers on properties + properties_extension) + one-shot
backfill from property_details.listing_events for pre-trigger history.
Tax reassessment forecast IL · Partial reset (capped growth)
- Current annual tax
- $6,382 · $532/mo
- Projected year-2 tax
- $6,880 · $573/mo
- Expected delta
- +$498/yr (+$41/mo · 7.8%)
ⓘ Screening estimate from a state-policy table — verify with the county assessor before closing.
Climate risk First Street
- Flood 1/10 Low FEMA zone X (unshaded) · 0% chance over 30 yrs
- Wildfire 1/10 Low
- Heat 3/10 Moderate 7 d/yr ≥102°F today · 15 d/yr by 30 yrs out
- Wind 2/10 Low
- Air quality 3/10 Moderate 2 unhealthy d/yr today · 4 by 30 yrs out
Nearby sold comps map
Loading sold comps map…
Walkable amenities ~0.75 mi
Loading nearby amenities…
Taxation est. · year 1
- Rental income
- $35,604
- − Mortgage interest
- −$18,205
- − Property taxes
- −$6,382
- − Insurance
- −$1,625
- − Repairs & maintenance
- −$2,848
- − Management
- −$2,848
- − HOA
- −$840
- − Depreciation
- −$9,455
- Taxable loss
- −$6,600
- Est. tax savings @ 24.0%
- +$1,584
- After-tax cash flow
- $412/yr
For passive investors: Depreciation is non-cash, so a rental often shows a tax loss while cash-flowing — sheltering income. Rental losses are passive: they offset passive income freely, and up to $25,000/yr can offset ordinary (W-2) income if you actively participate and your MAGI is under $100k (phasing out to $0 by $150k); unused losses carry forward. On sale, claimed depreciation is recaptured at up to 25%, and gains may owe capital-gains tax (a 1031 exchange can defer both). Figures are a year-1 estimate at your 24.0% rate — not tax advice; consult a CPA.
Schools (NCES district)
- District
- Lockport Twp Hsd 205
- NCES district ID
- 1723350
- Math proficiency
- 35% ▼ -5.00%
- Reading proficiency
- 38% ▼ -4.00%
- Median HH income
- $69,994
- Composite
- 33.5/100
- National rank
- #5440
- State rank
- #153 of 620 in IL
Livability — Lockport
- Score
- 79/100
- State rank
- #116
- US rank
- #2034
Category grades
Schools grade is shown separately in the Schools card above.
Census & demographics
- Census place
- Lockport, IL
- County
- Will County · 412,448 people
- City population
- 36,844
- Metro
- Chicago-Naperville-Elgin, IL-IN-WI
- Population (ZIP)
- 36,844
- Household income
- $103,374
- Rent vs Own
- Severe rent burden
- 519.0
Population outlook (Will County) Hauer SSP2
- Today (2025)
- 705,368 people
- By 2030
- 708,154 · +0.4%
- By 2040
- 702,692 · -0.4%
- By 2050
- 680,249 · -3.6%
- By 2075
- 611,990 · -13.2%
- By 2100
- 516,215 · -26.8%
Race, ethnicity, and origin ACS 2023
- Neighborhood character
- Predominantly White (76%)
- Race & ethnicity
- White 76% Hispanic / Latino 12% Two or more races 9% Black 7%
- Hispanic origin (detail)
- Mexican 9% Puerto Rican 1%
- Common ancestry
- Romanian 18% Iranian 2% Lithuanian 2%
- Foreign-born
- 7% · Canada
- Languages at home
- 86% English-only · Spanish 7% Russian/Polish/Slavic 4% Other Indo-European 2%
Political lean MEDSL · Will
- 2024 margin
- Toss-up / Even · D 50.1% · R 48.5% · Other 1.4%
- 2008→2024 swing
- -11.6pp toward R · 2008: 13.2pp · 2024: 1.6pp
- All cycles
- 2024: D+1.6 2020: D+8.3 2016: D+5.7 2012: D+3.7 2008: D+13.2
Not yet ingested
- Civics
- —
Market trends
- HPI YoY
- ▼ -99.43%
- Current HPI
- 201.5857
- Rent YoY
- ▲ 3.91%
- Metro
- Chicago-Naperville-Elgin, IL-IN-WI
- State GDP YoY
- ▲ 1.59%
- F500 in state
- 60
Industry mix (Fortune 500 HQ in IL)
| Industry | F500 HQs | Revenue |
|---|---|---|
| Insurance | 4 | $201B |
|
||
| Consumer Goods | 4 | $87B |
|
||
| Industrial Machinery | 3 | $64B |
|
||
| Healthcare | 2 | $55B |
|
||
| Retail / Pharmacy | 1 | $148B |
|
||
| Agriculture / Food | 1 | $86B |
|
||
Price history
+125.9% since first listed12 events — show timeline
- 2026-06-17 Listed $325,000 MRED as Distributed by MLS Grid
- 2017-12-27 Sold (Public Records) $175,000 Public Records
- 2017-12-22 Sold (MLS) $175,000 MRED as Distributed by MLS Grid
- 2017-10-29 Contingent — MRED as Distributed by MLS Grid
- 2017-10-19 Price Changed $180,000 MRED as Distributed by MLS Grid
- 2017-10-19 Relisted — MRED as Distributed by MLS Grid
- 2017-09-24 Contingent — MRED as Distributed by MLS Grid
- 2017-08-12 Price Changed $187,000 MRED as Distributed by MLS Grid
- 2017-08-05 Price Changed $193,000 MRED as Distributed by MLS Grid
- 2017-07-04 Listed $200,000 MRED as Distributed by MLS Grid
- 2003-09-04 Sold (Public Records) $166,900 Public Records
- 2000-10-27 Sold (Public Records) $143,845 Public Records
Property tax history
+1.9%/yrLatest (2024): $6,382 · +4.7% YoY. Source: county tax records.
Cash-flow waterfall
monthlySold comps — $/sqft
last 12 mo · ≤1 miLoading sold comps…