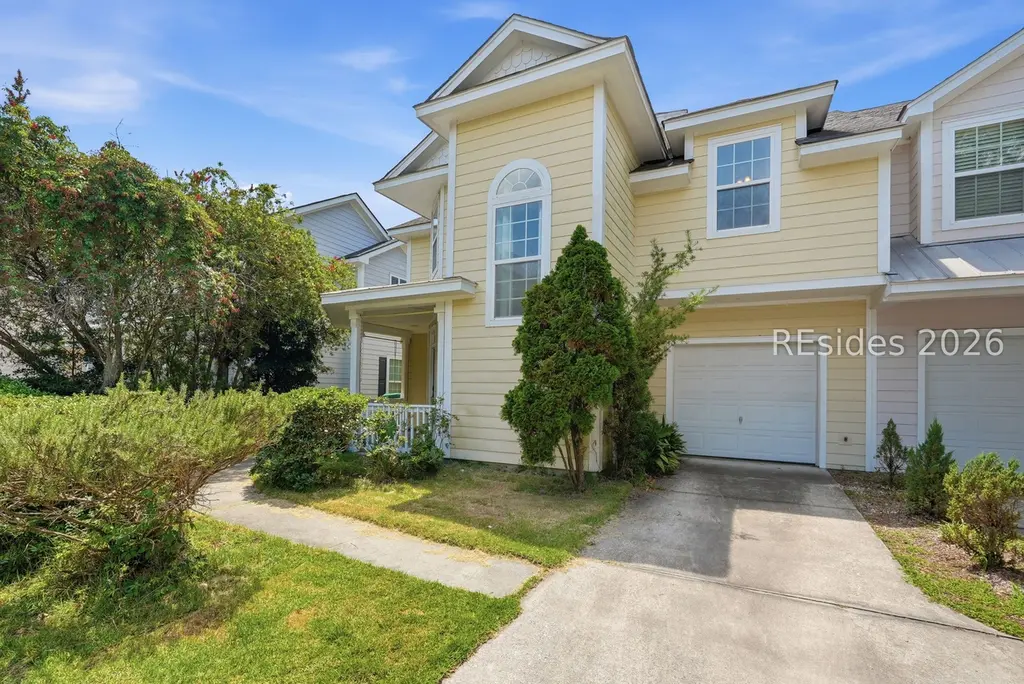
8 Winterberry Ln · Bluffton, SC
Flood risk 1/10 · Minimal
- FEMA flood zone
- X (unshaded)
- Chance of flooding over 30 yrs
- 0.0%
- Est. flood insurance / yr
- $507 – $1,088
Fire risk 5/10 · Moderate
- Est. fire insurance / yr
- $783 – $1,453
Heat risk 10/10 · Severe
- Hot days now (above 106°F)
- 7 days/yr
- Hot days in 30 yrs
- 18 days/yr
Wind risk 8/10 · Major
- Chance of severe wind over 30 yrs
- 99.0%
Air-quality risk 3/10 · Minor
- Unhealthy air days now
- 4 days/yr
- Unhealthy air days in 30 yrs
- 4 days/yr
Risk factors via First Street. Map © Google.
Why this score? — see what drove the D grade
The composite is a weighted blend of 9 inputs, each scored 0–100. Each bar is that input's sub-score; the figure is the points it added to the 100-point composite (weight × sub-score).
- Cash flow +13.4/30.0
- ARV discount +6.4/15.0
- Schools +4.1/10.0
- DSCR +4.0/10.0
- Rent growth +3.5/5.0
- Livability +3.4/5.0
- 1% rule +2.8/10.0
- Condition / age +2.5/5.0
- Appreciation +0.0/10.0
$339,000
🖨 Deal sheet (PDF) 📄 Offer letter ✓ Due diligence
Listing remarks MLS
Welcome to Wellstone! This move-in-ready end-unit townhome offers a premium location with peaceful lagoon and wooded views. The open-concept floor plan features no carpet throughout, a spacious kitchen with abundant cabinet and counter space, and a new stainless steel dishwasher (2026).Upstairs, you'll find three generously sized bedrooms with ample closet space. Relax in the screened lanai and fenced backyard while enjoying the tranquil Lowcountry setting.Wellstone amenities include a community pool, fitness center, and playground. Conveniently located near Highway 278, shopping, dining, and just a short drive to Hilton Head Island beaches.
Key facts
- Premium location
- Spacious kitchen
- Garage
Tags
Property features AI
Finance
- HOA & community: Community pool; Fitness center; Playground
Exterior
- Parking: 1-car garage
- Utilities: Public water; Sewer available
- Home design: 2-story home; Vinyl siding; Asphalt roof; Has a view
- Construction: Vinyl siding construction; Asphalt roof
- Exterior features: Enclosed porch; Front porch; Patio; Screened porch; Yard fenced
Interior
- Kitchen: Dishwasher; Microwave; Oven; Range; Refrigerator
- Bedrooms: Primary bedroom on upper level
- Flooring: Laminate floors
- Bathrooms: 2 full bathrooms; 1 half bathroom
- Heating & cooling: Central heating; Central air conditioning
- Interior features: Ceiling fans; Pull-down attic stairs; Smooth ceilings; Cable TV; Window treatments; Upper-level primary bedroom; Screened porch
- Laundry & utility: Laundry room; Utility room
Neighborhood map
What this means for you Summary
Snapshot
- This is a 3-bed/2.5-bath townhouse listed at $339k.
Deal economics
- At list price, monthly cash flow is $5 ($55/yr) — positive.
- The deal already cash-flows at list — no discount required.
- To meet the 1% rule (rent ≥ 1% of price), the offer needs to be $266k (21.7% below list).
- Recommended offer: $266k (21.7% below list) — sets the bar for 1% rule.
- Cap rate 6.3% vs local median 3.2% in Bluffton — top-decile yield for the area; either an underpriced asset or a hidden risk that comps aren't pricing in. Stress-test before assuming the spread holds.
Location & tenants
- Location reads 68/100 on livability (#76 in SC) — a middle-class / working-renter tenant base. Strengths: crime A+, employment A+, housing A+; Watch: amenities F, commute F, cost of living D-.
- Beaufort 01 (town): math 42% / reading 51% proficiency, ranked #17 of 80 in SC (top 21%) — families likely to look elsewhere, expect single-tenant / working-renter base with shorter leases.
- Zoned schools: Bluffton Elementary (math 49% / reading 46%, grade D, #199 of 597 statewide, top 35%, 696 students, 31% FRL); Bluffton Middle (math 40% / reading 46%, grade D-, #60 of 229 statewide, top 26%, 872 students, 45% FRL); Bluffton High (math 69% / reading 85%, grade A-, #28 of 196 statewide, top 16%, 1,350 students, 38% FRL).
- Market conditions: Rents rising fast (+4.1%/yr); 760 active listings in the ZIP; 7 comparable units currently listed for rent nearby; rentals at typical pace (median 23d on market — plan ~3-4 weeks tenant-placement turnaround); solid renter incomes; 1,824 units permitted in Beaufort County in 2024 (618 in 5+ unit buildings).
- This rent runs 32% of the median local income ($99k/yr) — at the standard rent-burdened threshold; future hikes will face affordability resistance.
Forward outlook
- Local home prices are declining (-3.0%/yr); year-one equity from $2k of loan paydown is wiped out by about $10k of value loss. Plan a longer hold.
- Beaufort County population projected at +30% by 2050 — long-run rental-demand tailwind backs the buy-and-hold thesis.
Negotiation context
- Only 11 days on market — expect competitive offers; lowballing is unlikely to land.
- 5 sale attempts since 4y ago with the ask held roughly flat each time — persistent listings suggest the price (not the market) is what's stuck; bring a comps-based counter.
Risks & watch-outs
- Climate carrying-cost: severe wind risk, 99% chance of damaging wind over 30y; moderate wildfire risk; extreme-heat days projected 7→18/yr by 2055 (HVAC capex compounding) — expect insurance premiums to compound above CPI over the hold.
Questions for the listing agent
- Is there a deadline driving the sale (1031 exchange, divorce, estate, relocation)? That informs how much negotiation room exists.
- Schools are B-rated — typically a magnet for longer-tenancy family renters. What's the average tenant stay here, and is there a school-zone premium baked into asking?
- The area grade is low — what's the realistic commute time and amenity access for the typical tenant pool here? Any planned neighborhood developments (good or bad) we should know about?
- What's the average days-on-market for RENTAL listings here right now (not sales)? A rising rental-DOM trend means longer vacancies and softer asking-rent achievability than the comps imply.
- What's the recent tenant-quality profile in this submarket — average credit score on applications, eviction rate, late-payment / NSF rate, and stable-employment percentage? A property-management company in the area should have these aggregated.
- How much new for-sale + rental construction is in the pipeline within 1–3 miles? Heavy new supply typically softens prices + rents 12–24 months out; constrained supply supports both.
Investment metrics
- 1% rule
- 0.78% ✗
- Cap rate
- 6.31%
- Cash-on-cash
- 0.06%
- DSCR
- 1.00
- GRM
- 10.6
CMA / ARV
- ARV (on-the-fly)
- $331,136
- Comps found
- 12
Show comp detail 12 sales within ~0.75 mi
| Address | Dist | Beds/Ba | Sqft | Sold | Price | $/sf | Match |
|---|---|---|---|---|---|---|---|
| 22 Bluehaw Ct | 0.13mi | 3/2.5 | 1,592 (0%) | 3mo | $310,000 | $195 | 91 |
| 3 Ironwood Cir | 0.09mi | 3/2.5 | 1,540 (-3%) | 1mo | $310,000 | $201 | 90 |
| 234 Plumgrass Way | 0.12mi | 3/2.5 | 1,581 (-1%) | 7mo | $338,000 | $214 | 88 |
| 83 Plumgrass St | 0.08mi | 3/2.5 | 1,556 (-2%) | 8mo | $345,000 | $222 | 86 |
| 71 Plumgrass St | 0.06mi | 3/2.5 | 1,528 (-4%) | 7mo | $315,000 | $206 | 85 |
| 19 Ironwood Cir | 0.13mi | 3/2.5 | 1,528 (-4%) | 3mo | $342,000 | $224 | 85 |
| 16 Maidencane St | 0.02mi | 3/2.5 | 1,648 (+4%) | 11mo | $290,000 | $176 | 84 |
| 39 Plumgrass St | 0.11mi | 3/2.5 | 1,528 (-4%) | 7mo | $340,000 | $223 | 83 |
| 29 Plumgrass St | 0.10mi | 3/2.5 | 1,528 (-4%) | 13mo | $318,000 | $208 | 78 |
| 208 Plumgrass Way | 0.15mi | 3/2.5 | 1,516 (-5%) | 9mo | $315,900 | $208 | 78 |
| 8 Buckhorn St | 0.13mi | 3/2.5 | 1,446 (-9%) | 4mo | $293,000 | $203 | 76 |
| 93 Plumgrass St | 0.10mi | 3/2.5 | 1,426 (-10%) | 11mo | $328,000 | $230 | 69 |
Match score weights: distance 35% · size 25% · config 20% · recency 20%. Top-matched comps best support the ARV.
Projected returns pro-forma
-3.0% appreciation · 4.06% rent growth · sell at horizon
- IRR
- -15.2%
- Equity multiple
- 0.45×
- Total profit
- $-51,890
- Equity at exit
- $50,546
- IRR
- -5.2%
- Equity multiple
- 0.65×
- Total profit
- $-33,264
- Equity at exit
- $29,311
Cash invested: $94,920 (down + closing). Projections, not guarantees.
Landlord ↔ Tenant lean methodology
- Overall (STATE)
- 90 Strongly Landlord-Friendly
- State South Carolina
- 90 Strongly Landlord-Friendly · R+6
- County
- — inherits STATE
- City
- — inherits STATE
ZIP-level market 29910
- Home prices YoY
- -22.9%
- Rents YoY
- 4.1%
- Active inventory
- 760
- Price-to-rent
- 10.6×
Monthly cashflow live
- Estimated rent
- $2,656 high interval (Pro) →
- Mortgage (P&I)
- −$1,778
- Tax from tax record
- −$175 /mo · $2,095/yr
- Insurance
- −$141
- HOA
- −$0
- Vacancy / Maint / Mgmt
- −$558
- Net cashflow
- $5
Break-even live
Sensitivity live
| Price | -10% $197 | -5% $101 | +0% $5 | +5% $-91 | +10% $-187 |
|---|---|---|---|---|---|
| Rent | -10% $-205 | -5% $-100 | +0% $5 | +5% $110 | +10% $214 |
| Rate | -1.0pp $175 | -0.5pp $91 | base $5 | +0.5pp $-83 | +1.0pp $-173 |
UW: 25.0% down · 7.5% · 30yr · 1.5% tax · 5.0% vac · 8.0% maint · 8.0% mgmt
Financing live
Cash to close
- Down payment
- $84,750
- Closing costs
- $10,170
- Reserves months
- —
- Total cash needed
- —
Loan-product check · same deal, 3 products live
Conventional
25% down · 7.5% · 30yr
- Down + closing
- —
- Monthly P&I
- —
- Monthly cashflow
- —
- DSCR
- —
- Eligible?
- —
Personal DTI + credit; lowest rate.
DSCR
20% down · 8.5% · 30yr
- Down + closing
- —
- Monthly P&I
- —
- Monthly cashflow
- —
- DSCR
- —
- Eligible?
- —
No personal income docs; deal must DSCR.
Hard money
10% down · 12.0% · 12mo
- Down + closing
- —
- Monthly P&I
- —
- Monthly cashflow
- —
- DSCR
- —
- Eligible?
- —
Short-term bridge; refi at stabilization.
Rent comps 7 comps
| Address | Beds | Baths | Sqft | Rent | $/sqft | DOM | Units | Dist |
|---|---|---|---|---|---|---|---|---|
| 33 Plumgrass St Bluffton, SC | 3.0 | 2.5 | 1617 | $2,700 | $1.67 | 45d | 1 | 0.08mi |
| 206 Plumgrass Way Bluffton, SC | 3.0 | 2.5 | 1529 | $2,400 | $1.57 | 45d | 1 | 0.17mi |
| 102 Haigler Blvd Bluffton, SC | 2.0–3.0 | 2.0 | 1106 | $2,166 | $1.96 | 15d | 6 | 0.35mi |
| 8 5th Ave Bluffton, SC | 3.0 | 2.5 | 1860 | $2,900 | $1.56 | 15d | 1 | 1.04mi |
| 10 Sikes TRL Bluffton, SC | 1.0–3.0 | 1.0–2.0 | 1061 | $2,531 | $2.39 | 15d | 31 | 1.08mi |
| 65 Blue Point Blvd Bluffton, SC | 3.0 | 2.5 | 1600 | $3,085 | $1.93 | 23d | 30 | 1.12mi |
| 6 Spruce Dr Bluffton, SC | 3.0 | 2.0 | 1139 | $2,600 | $2.28 | 23d | 1 | 1.46mi |
Listing history 8 events
-
2026-06-21days on market $339,000 Active 11 DOM
-
2026-06-18days on market $339,000 Active 8 DOM
-
2026-06-17days on market $339,000 Active 7 DOM
-
2026-06-16days on market $339,000 Active 6 DOM
-
2026-06-15days on market $339,000 Active 5 DOM
-
2026-06-14days on market $339,000 Active 3 DOM
-
2026-06-13remarks 651-char remark
-
2026-06-13$339,000 Active 2 DOM
ⓘ Source: listings_history table (triggers on properties + properties_extension) + one-shot
backfill from property_details.listing_events for pre-trigger history.
Tax reassessment forecast SC · Resets to sale price
- Current annual tax
- $2,095 · $175/mo
- Projected year-2 tax
- $2,095 · $175/mo
- Expected delta
- $0/yr ($0/mo · 0.0%)
ⓘ Screening estimate from a state-policy table — verify with the county assessor before closing.
Climate risk First Street
- Flood 1/10 Low FEMA zone X (unshaded) · 0% chance over 30 yrs
- Wildfire 5/10 Major
- Heat 10/10 Extreme 7 d/yr ≥106°F today · 18 d/yr by 30 yrs out
- Wind 8/10 Severe 99% chance of damaging wind over 30 yrs
- Air quality 3/10 Moderate 4 unhealthy d/yr today · 4 by 30 yrs out
Nearby sold comps map
Loading sold comps map…
Walkable amenities ~0.75 mi
Loading nearby amenities…
Taxation est. · year 1
- Rental income
- $31,871
- − Mortgage interest
- −$18,989
- − Property taxes
- −$2,095
- − Insurance
- −$1,695
- − Repairs & maintenance
- −$2,550
- − Management
- −$2,550
- − Depreciation
- −$9,862
- Taxable loss
- −$5,869
- Est. tax savings @ 24.0%
- +$1,409
- After-tax cash flow
- $1,464/yr
For passive investors: Depreciation is non-cash, so a rental often shows a tax loss while cash-flowing — sheltering income. Rental losses are passive: they offset passive income freely, and up to $25,000/yr can offset ordinary (W-2) income if you actively participate and your MAGI is under $100k (phasing out to $0 by $150k); unused losses carry forward. On sale, claimed depreciation is recaptured at up to 25%, and gains may owe capital-gains tax (a 1031 exchange can defer both). Figures are a year-1 estimate at your 24.0% rate — not tax advice; consult a CPA.
Schools (NCES district)
- District
- Beaufort 01
- NCES district ID
- 4501110
- Math proficiency
- 42% ▼ -8.00%
- Reading proficiency
- 51% ▲ 2.00%
- Median HH income
- $57,430
- Composite
- 40.56/100
- National rank
- #3699
- State rank
- #17 of 80 in SC
Livability — Bluffton
- Score
- 68/100
- State rank
- #76
- US rank
- #8936
Category grades
Schools grade is shown separately in the Schools card above.
Census & demographics
- Census place
- Bluffton, SC
- County
- Beaufort County · 163,770 people
- City population
- 77,022
- Metro
- Hilton Head Island-Bluffton, SC
- Population (ZIP)
- 53,019
- Household income
- $98,912
- Rent vs Own
- Severe rent burden
- 1146.0
Population outlook (Beaufort County) Hauer SSP2
- Today (2025)
- 211,915 people
- By 2030
- 227,272 · +7.2%
- By 2040
- 253,861 · +19.8%
- By 2050
- 275,126 · +29.8%
- By 2075
- 311,022 · +46.8%
- By 2100
- 321,286 · +51.6%
Race, ethnicity, and origin ACS 2023
- Neighborhood character
- Predominantly White (70%)
- Race & ethnicity
- White 70% Hispanic / Latino 18% Two or more races 8% Black 7%
- Hispanic origin (detail)
- Mexican 7% Puerto Rican 3%
- Common ancestry
- Romanian 4% Slovak 3% Lithuanian 3%
- Foreign-born
- 9% · Canada, Jamaica, Dominican Republic
- Languages at home
- 84% English-only · Spanish 13% Other Indo-European 1% French/Haitian/Cajun 1%
Political lean MEDSL · Beaufort
- 2024 margin
- R (+14.5) · D 42.1% · R 56.6% · Other 1.2%
- 2008→2024 swing
- -3.7pp toward R · 2008: -10.8pp · 2024: -14.5pp
- All cycles
- 2024: R+14.5 2020: R+10.0 2016: R+14.3 2012: R+17.5 2008: R+10.8
Not yet ingested
- Civics
- —
Market trends
- HPI YoY
- ▼ -72.80%
- Current HPI
- 245.8086
- Rent YoY
- ▲ 4.06%
- Metro
- Hilton Head Island-Bluffton, SC
- State GDP YoY
- ▲ 4.51%
- F500 in state
- 2
Industry mix (Fortune 500 HQ in SC)
| Industry | F500 HQs | Revenue |
|---|---|---|
| Packaging | 1 | $7B |
|
||
Price history
+2.7% since first listed8 events — show timeline
- 2026-06-10 Listed $339,000 LRMLS
- 2026-06-10 Listed $339,000 RSMLS
- 2022-10-04 Sold (Public Records) $330,000 Public Records
- 2022-09-30 Sold (MLS) $330,000 RSMLS
- 2022-09-12 Pending — RSMLS
- 2022-08-26 Listed $330,000 LRMLS
- 2022-08-26 Relisted — RSMLS
- 2022-08-17 Listed $330,000 RSMLS
Property tax history
+9.8%/yrLatest (2025): $2,095 · -61.3% YoY. Source: county tax records.
Cash-flow waterfall
monthlySold comps — $/sqft
last 12 mo · ≤1 miLoading sold comps…