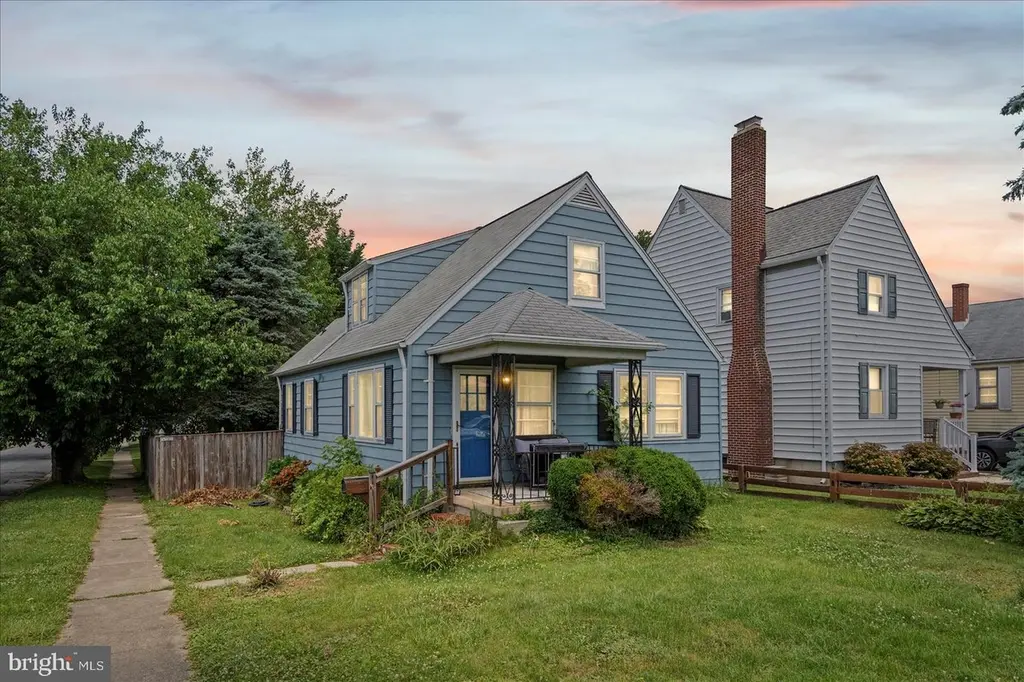
7600 Park Dr · Parkville, MD
Flood risk 3/10 · Minor
- FEMA flood zone
- X (unshaded)
- Chance of flooding over 30 yrs
- 0.2%
- Est. flood insurance / yr
- $473 – $860
Fire risk 1/10 · Minimal
- Est. fire insurance / yr
- $755 – $1,403
Heat risk 7/10 · Major
- Hot days now (above 104°F)
- 7 days/yr
- Hot days in 30 yrs
- 15 days/yr
Wind risk 6/10 · Moderate
- Chance of severe wind over 30 yrs
- 27.0%
Air-quality risk 4/10 · Minor
- Unhealthy air days now
- 3 days/yr
- Unhealthy air days in 30 yrs
- 6 days/yr
Risk factors via First Street. Map © Google.
Why this score? — see what drove the C+ grade
The composite is a weighted blend of 9 inputs, each scored 0–100. Each bar is that input's sub-score; the figure is the points it added to the 100-point composite (weight × sub-score).
- Cash flow +21.6/30.0
- ARV discount +15.0/15.0
- DSCR +6.9/10.0
- 1% rule +5.8/10.0
- Rent growth +4.2/5.0
- Livability +3.9/5.0
- Condition / age +2.5/5.0
- Schools +2.3/10.0
- Appreciation +0.0/10.0
$185,000
🖨 Deal sheet 📄 Offer letter ✓ Due diligence
Listing remarks
Opportunity is knocking at 7600 Park Dr in Parkville! This 3 bedroom, 1 bath Baltimore County property is ready for its next chapter and offers serious upside for an investor, renovator, or owner-occupant willing to roll up their sleeves and build equity. The home needs work, but the potential is undeniable. With nearby renovated homes selling close to $400,000, the spread creates a strong value-add opportunity for the right buyer. Whether you are looking for your next flip, rental, or a home you can improve over time, this one has the bones, location, and upside to make the effort worthwhile. Property is being sold strictly As-Is, Where-Is. Seller will make no repairs. Buyers should consul
Key facts
- 5,000 sq ft lot
- Built 1955
Property features AI
Finance
- Other: Fee simple ownership
Exterior
- Parking: On-street parking
- Utilities: Public water; Public sewer
- Home design: Detached structure
- Construction: Metal siding; Block foundation; Shingle/composite roof; Built year recorded by assessor
- Exterior features: No tidal water
Interior
- Bedrooms: Two bedrooms on the main level; One bedroom on the upper level
- Bathrooms: One full bathroom on the main level; One full bathroom total
- Heating & cooling: Heating type: Other; Hot water provided by natural gas
- Interior features: Estimated living area; Partially finished basement
Neighborhood map
What this means for you Summary
Snapshot
- This is a 3-bed/1.0-bath single-family listed at $185k.
Deal economics
- At list price, monthly cash flow is $281 ($3k/yr) — positive.
- The deal already cash-flows at list — no discount required.
- Meets the 1% rule at list price ($2k rent vs $185k).
- Cap rate 8.1% vs local median 5.3% in Parkville — top-decile yield for the area; either an underpriced asset or a hidden risk that comps aren't pricing in. Stress-test before assuming the spread holds.
Location & tenants
- Location reads 77/100 on livability (#77 in MD, #2,839 nationally) — a middle-class / working-renter tenant base. Strengths: commute A+, housing A+, health & safety A+; Watch: schools F, crime F.
- Baltimore County Public Schools (suburban): math 15% / reading 34% proficiency, ranked #11 of 24 in MD (top 46%) — low school quality limits family demand, transient renter base, plan for 1-2y turnover.
- Market conditions: Rents rising fast (+6.7%/yr); 225 active listings in the ZIP; 40 comparable units currently listed for rent nearby; rentals lingering (median 44d on market — plan ~5-8 weeks vacancy on turnover, expect pricing pressure); 58% of comp listings sitting > 30 days — soft ceiling on asking rent; solid renter incomes; 1,511 units permitted in Baltimore County in 2024 (643 in 5+ unit buildings).
Forward outlook
- Local home prices are declining (-3.0%/yr); year-one equity from $1k of loan paydown is wiped out by about $6k of value loss. Plan a longer hold.
- Baltimore County population projected at +12% by 2050 — modest demand growth; plan on rents tracking national, not racing it.
- At projected returns (-3.0% appreciation + 6.7% rent growth), your $52k cash investment doubles in ~10 years — after that, you're playing with house money.
Negotiation context
- Only 1 days on market — expect competitive offers; lowballing is unlikely to land.
- Current owner paid $94k; list at $185k implies a 97% gain — meaningful room to come down on a strong offer.
Risks & watch-outs
- Watch-outs: built in 1955 — expect roof / HVAC / electrical / plumbing capex.
- Climate carrying-cost: major wind risk, 27% chance of damaging wind over 30y; extreme-heat days projected 7→15/yr by 2055 (HVAC capex compounding) — expect insurance premiums to compound above CPI over the hold.
Questions for the listing agent
- Built in 1955 — when were the roof, HVAC, electrical panel, plumbing, and water heater last replaced?
- Is there a deadline driving the sale (1031 exchange, divorce, estate, relocation)? That informs how much negotiation room exists.
- Schools are F-rated, which usually means shorter tenancies and higher turnover. Who's the typical renter profile here, and what's been the actual vacancy rate?
- Crime grade is F in this area — have there been break-ins, vandalism, or insurance claims at this property in the last 3 years? What carrier currently insures it and at what premium?
- What's the average days-on-market for RENTAL listings here right now (not sales)? A rising rental-DOM trend means longer vacancies and softer asking-rent achievability than the comps imply.
- What's the recent tenant-quality profile in this submarket — average credit score on applications, eviction rate, late-payment / NSF rate, and stable-employment percentage? A property-management company in the area should have these aggregated.
- How much new for-sale + rental construction is in the pipeline within 1–3 miles? Heavy new supply typically softens prices + rents 12–24 months out; constrained supply supports both.
Investment metrics
- 1% rule
- 1.08% ✓
- Cap rate
- 8.11%
- Cash-on-cash
- 6.50%
- DSCR
- 1.29
- GRM
- 7.7
CMA / ARV
- ARV (on-the-fly)
- $283,764
- Comps found
- 12
Show comp detail 12 sales within ~0.75 mi
| Address | Dist | Beds/Ba | Sqft | Sold | Price | $/sf | Match |
|---|---|---|---|---|---|---|---|
| 2532 Hillcrest Ave | 0.04mi | 3/2.5 | 1,392 (+8%) | 1mo | $320,000 | $230 | 78 |
| 2624 Wycliffe Rd | 0.17mi | 3/2.0 | 1,213 (-6%) | 1mo | $375,000 | $309 | 78 |
| 2814 Oakcrest Ave | 0.31mi | 3/1.5 | 1,376 (+7%) | 1mo | $310,000 | $225 | 71 |
| 2513 Glencoe Rd | 0.39mi | 3/2.0 | 1,342 (+4%) | 7mo | $191,100 | $142 | 65 |
| 2818 Linganore Ave | 0.33mi | 3/2.0 | 1,183 (-8%) | 5mo | $178,000 | $150 | 64 |
| 2811 Emerald Rd | 0.66mi | 3/1.0 | 1,278 (-0%) | 7mo | $289,000 | $226 | 63 |
| 2909 Inglewood Ave | 0.58mi | 3/1.0 | 1,184 (-8%) | 3mo | $259,900 | $220 | 57 |
| 8009 Oakleigh Rd | 0.64mi | 2/1.0 (-1) | 1,199 (-7%) | 2mo | $200,000 | $167 | 52 |
| 3203 Taylor Ave | 0.68mi | 3/2.0 | 1,350 (+5%) | 4mo | $330,000 | $244 | 52 |
| 2600 Chesley Ave | 0.61mi | 3/2.0 | 1,458 (+14%) | 1mo | $255,000 | $175 | 44 |
| 3014 Oakcrest Ave | 0.54mi | 3/2.0 | 1,472 (+15%) | 5mo | $225,000 | $153 | 42 |
| 8405 Harris Ave | 0.72mi | 3/2.0 | 1,436 (+12%) | 4mo | $318,000 | $221 | 39 |
Match score weights: distance 35% · size 25% · config 20% · recency 20%. Top-matched comps best support the ARV.
Projected returns pro-forma
-3.0% appreciation · 6.68% rent growth · sell at horizon
- IRR
- -2.2%
- Equity multiple
- 0.92×
- Total profit
- $-4,389
- Equity at exit
- $27,584
- IRR
- 11.2%
- Equity multiple
- 2.03×
- Total profit
- $53,299
- Equity at exit
- $15,995
Cash invested: $51,800 (down + closing). Projections, not guarantees.
Landlord ↔ Tenant lean methodology
- Overall (STATE)
- 27 Tenant-Leaning
- State Maryland
- 27 Tenant-Leaning · D+14
- County
- — inherits STATE
- City
- — inherits STATE
ZIP-level market 21234
- Rents YoY
- 6.7%
- Active inventory
- 225
- Price-to-rent
- 7.7×
Monthly cashflow live
- Estimated rent
- $1,996 high interval (Pro) →
- Mortgage (P&I)
- −$970
- Tax from tax record
- −$249 /mo · $2,987/yr
- Insurance
- −$77
- HOA
- −$0
- Vacancy / Maint / Mgmt
- −$419
- Net cashflow
- $281
Break-even live
UW: 25.0% down · 7.5% · 30yr · 1.5% tax · 5.0% vac · 8.0% maint · 8.0% mgmt
Financing live
Cash to close
- Down payment
- $46,250
- Closing costs
- $5,550
- Reserves months
- —
- Total cash needed
- —
Loan-product check · same deal, 3 products live
Conventional
25% down · 7.5% · 30yr
- Down + closing
- —
- Monthly P&I
- —
- Monthly cashflow
- —
- DSCR
- —
- Eligible?
- —
Personal DTI + credit; lowest rate.
DSCR
20% down · 8.5% · 30yr
- Down + closing
- —
- Monthly P&I
- —
- Monthly cashflow
- —
- DSCR
- —
- Eligible?
- —
No personal income docs; deal must DSCR.
Hard money
10% down · 12.0% · 12mo
- Down + closing
- —
- Monthly P&I
- —
- Monthly cashflow
- —
- DSCR
- —
- Eligible?
- —
Short-term bridge; refi at stabilization.
Rent comps 40 comps
| Address | Beds | Baths | Sqft | Rent | $/sqft | DOM | Units | Dist |
|---|---|---|---|---|---|---|---|---|
| 2528 Wendover Rd Unit a Parkville, MD | 2.0 | 2.0 | 1704 | $1,950 | $1.14 | 43d | 1 | 0.19mi |
| 7839 Birmingham Ave Parkville, MD | 3.0 | 1.0 | 1136 | $1,775 | $1.56 | 43d | 1 | 0.41mi |
| 3108 Glendale Ave Parkville, MD | 3.0 | 3.0 | 1224 | $2,550 | $2.08 | 23d | 1 | 0.54mi |
| 8204 Old Harford Rd Unit 2 Parkville, MD | 2.0 | 1.0 | 1146 | $1,850 | $1.61 | 43d | 1 | 0.57mi |
| 8206 Old Harford Rd Unit 2 Parkville, MD | 2.0 | 1.0 | 1146 | $1,850 | $1.61 | 43d | 1 | 0.58mi |
| 8206 Old Harford Rd Unit 1 Parkville, MD | 2.0 | 1.0 | 1146 | $1,750 | $1.53 | 43d | 1 | 0.58mi |
| 8309 Arbor Station Way Parkville, MD | 1.0–2.0 | 1.0–1.5 | 846 | $1,815 | $2.15 | 1d | 8 | 0.72mi |
| 3010 Woodring Ave Unit 2 Baltimore, MD | 2.0 | 1.0 | 900 | $1,600 | $1.78 | 43d | 1 | 0.72mi |
| 7906 Bon Air Rd Parkville, MD | 3.0 | 1.0 | 912 | $2,200 | $2.41 | 43d | 1 | 0.75mi |
| 8503 Kings Ridge Rd Parkville, MD | 4.0 | 2.0 | 1200 | $2,100 | $1.75 | 4d | 1 | 0.83mi |
| 1629 Wentworth Ave Parkville, MD | 3.0 | 1.5 | 1152 | $1,895 | $1.64 | 43d | 1 | 0.86mi |
| 6612 Birchwood Ave Baltimore, MD | 3.0 | 2.0 | 1122 | $2,300 | $2.05 | 19d | 1 | 0.87mi |
| 7605 Hillendale Rd Parkville, MD | 2.0 | 1.0 | 1050 | $1,255 | $1.20 | 43d | 1 | 0.88mi |
| 1376 Halstead Rd Parkville, MD | 3.0 | 1.0 | 1440 | $2,400 | $1.67 | 23d | 1 | 0.88mi |
| 3158 Woodring Ave Parkville, MD | 3.0 | 1.5 | 1500 | $1,950 | $1.30 | 23d | 1 | 0.89mi |
| 1610 Wentworth Ave Parkville, MD | 3.0 | 1.0 | 1024 | $1,900 | $1.86 | 43d | 1 | 0.90mi |
| 7202 Sindall Rd Unit 7202 Parkville, MD | 3.0 | 1.0 | 1350 | $1,850 | $1.37 | 43d | 1 | 0.90mi |
| 8417 Nunley Dr Parkville, MD | 1.0–3.0 | 1.0–2.0 | 812 | $2,120 | $2.61 | 23d | 1 | 0.96mi |
| 1332 Deanwood Rd Parkville, MD | 3.0 | 2.0 | 1046 | $2,500 | $2.39 | 44d | 1 | 0.99mi |
| 6502 McClean Blvd Baltimore, MD | 2.0 | 1.0 | 925 | $1,537 | $1.66 | 43d | 1 | 1.05mi |
| 6502 McClean Blvd Unit 2211-B3 Baltimore, MD | 2.0 | 1.0 | 925 | $1,495 | $1.62 | 21d | 1 | 1.11mi |
| 1329 Taylor Ave Parkville, MD | 2.0 | 1.0 | 1636 | $1,599 | $0.98 | 43d | 1 | 1.12mi |
| 1929 Edgewood Rd Unit 1929 Towson, MD | 3.0 | 2.0 | 1700 | $2,350 | $1.38 | 10d | 1 | 1.14mi |
| 2804 Christopher Ave Baltimore, MD | 3.0 | 2.5 | 1280 | $2,200 | $1.72 | 23d | 1 | 1.16mi |
| 3412 Fleetwood Ave Baltimore, MD | 3.0 | 2.5 | 1620 | $2,195 | $1.35 | 43d | 1 | 1.18mi |
| 1127 Deanwood Rd Parkville, MD | 3.0 | 2.0 | 1730 | $2,350 | $1.36 | 43d | 1 | 1.19mi |
| 6212 Laurelton Ave Baltimore, MD | 2.0 | 1.0 | 960 | $1,325 | $1.38 | 43d | 1 | 1.20mi |
| 8340 Edgedale Rd Parkville, MD | 3.0 | 2.0 | 1260 | $2,400 | $1.90 | 4d | 1 | 1.21mi |
| 1809 Glen Ridge Rd Towson, MD | 3.0 | 1.5 | 1640 | $2,100 | $1.28 | 43d | 1 | 1.23mi |
| 34 Dowling Cir Parkville, MD | 1.0–2.0 | 1.0 | 874 | $1,465 | $1.68 | 1d | 36 | 1.25mi |
| 8451 Water Oak Rd Parkville, MD | 3.0 | 2.0 | 1054 | $1,950 | $1.85 | 43d | 1 | 1.26mi |
| 1745 Amuskai Rd Parkville, MD | 2.0 | 2.0 | 1260 | $1,975 | $1.57 | 43d | 1 | 1.29mi |
| 1717 Northview Rd Parkville, MD | 3.0 | 1.5 | 1260 | $1,980 | $1.57 | 4d | 1 | 1.32mi |
| 1726 Redwood Ave Parkville, MD | 4.0 | 2.0 | 1435 | $2,250 | $1.57 | 17d | 1 | 1.33mi |
| 8768 Cimarron Cir Parkville, MD | 4.0 | 1.5 | 1752 | $2,395 | $1.37 | 23d | 1 | 1.35mi |
| 6410 Walther Ave Baltimore, MD | 2.0 | 1.0–2.0 | 1195 | $1,995 | $1.67 | 43d | 7 | 1.36mi |
| 8533 Oak Rd Parkville, MD | 3.0 | 2.0 | 1480 | $2,100 | $1.42 | 43d | 1 | 1.38mi |
| 8402 Greenway Rd Towson, MD | 3.0 | 1.0 | 708 | $1,595 | $2.25 | 2d | 24 | 1.38mi |
| 35-C Mopec Cir Nottingham, MD | 2.0 | 1.0 | 1100 | $1,445 | $1.31 | 2d | 10 | 1.39mi |
| 8525 Chestnut Oak Rd Parkville, MD | 4.0 | 2.0 | 1178 | $1,995 | $1.69 | 43d | 1 | 1.42mi |
Listing history 3 events
-
2026-06-18status $185,000 Active 1 DOM
-
2026-06-17remarks 699-char remark
-
2026-06-17$185,000 Coming Soon 1 DOM
ⓘ Source: listings_history table (triggers on properties + properties_extension) + one-shot
backfill from property_details.listing_events for pre-trigger history.
Tax reassessment forecast MD · Partial reset (capped growth)
- Current annual tax
- $2,987 · $249/mo
- Projected year-2 tax
- $2,987 · $249/mo
- Expected delta
- $0/yr ($0/mo · 0.0%)
ⓘ Screening estimate from a state-policy table — verify with the county assessor before closing.
Climate risk First Street
- Flood 3/10 Moderate FEMA zone X (unshaded) · 20% chance over 30 yrs
- Wildfire 1/10 Low
- Heat 7/10 Severe 7 d/yr ≥104°F today · 15 d/yr by 30 yrs out
- Wind 6/10 Major 27% chance of damaging wind over 30 yrs
- Air quality 4/10 Moderate 3 unhealthy d/yr today · 6 by 30 yrs out
Nearby sold comps map
Loading sold comps map…
Walkable amenities ~0.75 mi
Loading nearby amenities…
Taxation est. · year 1
- Rental income
- $23,954
- − Mortgage interest
- −$10,363
- − Property taxes
- −$2,987
- − Insurance
- −$925
- − Repairs & maintenance
- −$1,916
- − Management
- −$1,916
- − Depreciation
- −$5,382
- Taxable income
- $464
- Est. tax owed @ 24.0%
- −$111
- After-tax cash flow
- $3,258/yr
For passive investors: Depreciation is non-cash, so a rental often shows a tax loss while cash-flowing — sheltering income. Rental losses are passive: they offset passive income freely, and up to $25,000/yr can offset ordinary (W-2) income if you actively participate and your MAGI is under $100k (phasing out to $0 by $150k); unused losses carry forward. On sale, claimed depreciation is recaptured at up to 25%, and gains may owe capital-gains tax (a 1031 exchange can defer both). Figures are a year-1 estimate at your 24.0% rate — not tax advice; consult a CPA.
Schools (NCES district)
- District
- Baltimore County Public Schools
- NCES district ID
- 2400120
- Math proficiency
- 15% ▼ -16.00%
- Reading proficiency
- 34% ▼ -5.00%
- Median HH income
- $66,746
- Composite
- 23.17/100
- National rank
- #7948
- State rank
- #11 of 24 in MD
Livability — Parkville
- Score
- 77/100
- State rank
- #77
- US rank
- #2839
Category grades
Schools grade is shown separately in the Schools card above.
Census & demographics
- Census place
- Parkville, MD
- County
- Baltimore County · 769,527 people
- City population
- 66,334
- Metro
- Baltimore-Columbia-Towson, MD
- Population (ZIP)
- 66,334
- Household income
- $83,517
- Rent vs Own
- Severe rent burden
- 2719.0
Population outlook (Baltimore County) Hauer SSP2
- Today (2025)
- 885,518 people
- By 2030
- 909,272 · +2.7%
- By 2040
- 951,547 · +7.5%
- By 2050
- 990,955 · +11.9%
- By 2075
- 1,086,411 · +22.7%
- By 2100
- 1,135,078 · +28.2%
Race, ethnicity, and origin ACS 2023
- Neighborhood character
- Diverse neighborhood (Simpson 0.58)
- Race & ethnicity
- White 58% Black 28% Asian 5% Hispanic / Latino 5% Two or more races 5%
- Common ancestry
- Romanian 5% Lithuanian 1% Italian 1%
- Foreign-born
- 10% · Canada, China, South Korea
- Languages at home
- 89% English-only · Spanish 3% Other Indo-European 2% Tagalog/Filipino 1%
Political lean MEDSL · Baltimore
- 2024 margin
- Strong D (+24.5) · D 61.0% · R 36.5% · Other 2.5%
- 2008→2024 swing
- +9.9pp toward D · 2008: 14.6pp · 2024: 24.5pp
- All cycles
- 2024: D+24.5 2020: D+27.0 2016: D+17.4 2012: D+16.4 2008: D+14.6
Not yet ingested
- Civics
- —
Market trends
- HPI YoY
- ▼ -247.04%
- Current HPI
- 254.3824
- Rent YoY
- ▲ 6.68%
- Metro
- Baltimore-Columbia-Towson, MD
- State GDP YoY
- ▲ 2.97%
- F500 in state
- 12
Industry mix (Fortune 500 HQ in MD)
| Industry | F500 HQs | Revenue |
|---|---|---|
| Aerospace / Defense | 1 | $71B |
|
||
| Utilities | 1 | $25B |
|
||
| Hotels | 1 | $24B |
|
||
| Consumer Goods | 1 | $7B |
|
||
| Real Estate | 1 | $6B |
|
||
| Chemicals | 1 | $2B |
|
||
Price history
+496.8% since first listed4 events — show timeline
- 2026-06-16 Coming Soon $185,000 BRIGHT MLS
- 1996-11-13 Sold (Public Records) $94,000 Public Records
- 1989-10-30 Sold (Public Records) $88,000 Public Records
- 1974-08-19 Sold (Public Records) $31,000 Public Records
Property tax history
+2.3%/yrLatest (2025): $2,987 · +7.0% YoY. Source: county tax records.
Cash-flow waterfall
monthlySold comps — $/sqft
last 12 mo · ≤1 miLoading sold comps…