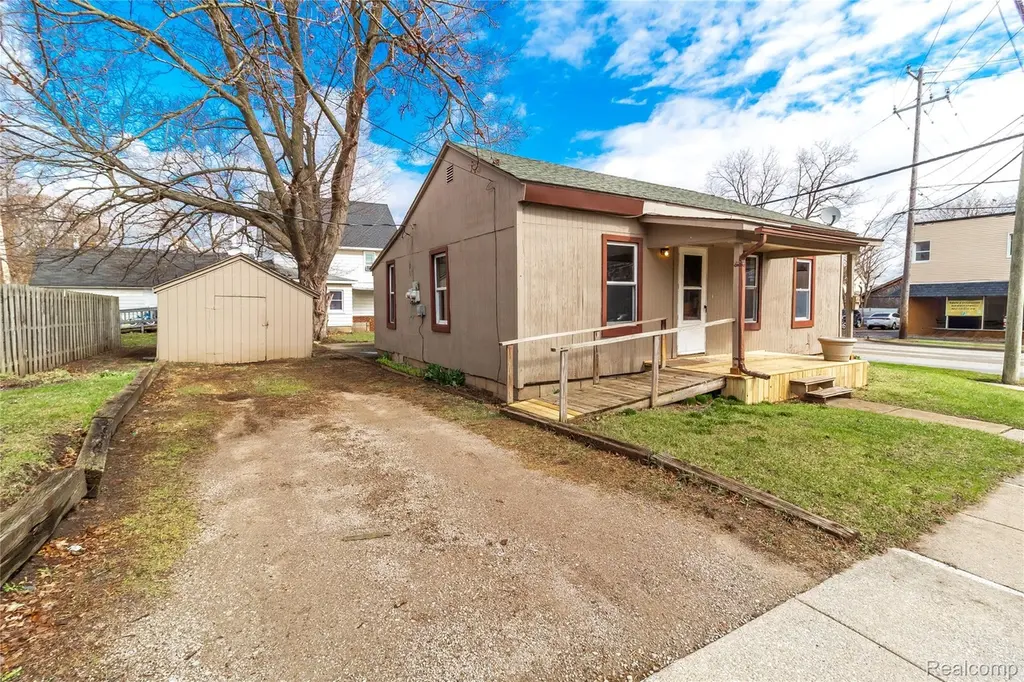
6 Law St · Lapeer, MI
Flood risk 1/10 · Minimal
- FEMA flood zone
- X (unshaded)
- Chance of flooding over 30 yrs
- 0.0%
- Est. flood insurance / yr
- $507 – $1,088
Fire risk 3/10 · Minor
- Est. fire insurance / yr
- $784 – $1,456
Heat risk 2/10 · Minimal
- Hot days now (above 97°F)
- 7 days/yr
- Hot days in 30 yrs
- 14 days/yr
Wind risk 1/10 · Minimal
- Chance of severe wind over 30 yrs
- —
Air-quality risk 3/10 · Minor
- Unhealthy air days now
- 2 days/yr
- Unhealthy air days in 30 yrs
- 3 days/yr
Risk factors via First Street. Map © Google.
Why this score? — see what drove the B grade
The composite is a weighted blend of 9 inputs, each scored 0–100. Each bar is that input's sub-score; the figure is the points it added to the 100-point composite (weight × sub-score).
- Cash flow +27.8/30.0
- ARV discount +15.0/15.0
- DSCR +9.8/10.0
- 1% rule +6.3/10.0
- Livability +3.6/5.0
- Schools +3.5/10.0
- Rent growth +2.5/5.0
- Condition / age +2.5/5.0
- Appreciation +0.0/10.0
$114,900
🖨 Deal sheet 📄 Offer letter ✓ Due diligence
Listing remarks MLS
Charming one-bedroom home in Lapeer set on a corner lot with convenient off-street parking. This move-in ready property features fresh paint and new flooring throughout, along with 1.5 baths and first-floor laundry for added everyday convenience. The layout is efficient and easy to maintain, making it a great option for a starter home, downsizing, or investment. Enjoy the covered back porch patio—perfect for relaxing outdoors. The property also includes a large shed for extra storage and a usable yard space. Located within walking distance to downtown, you’ll have quick access to shopping, dining, and local amenities. A solid, low-maintenance home in a great location.
Key facts
- 3,485 sq ft lot
- Built 1940
- Listed 71 days
Neighborhood map
What this means for you Summary
Snapshot
- This is a 1-bed/1.5-bath single-family listed at $115k.
Deal economics
- At list price, monthly cash flow is $351 ($4k/yr) — positive.
- The deal already cash-flows at list — no discount required.
- Meets the 1% rule at list price ($1k rent vs $115k).
- Recommended offer: $108k (6.0% below list) — sets the bar for market timing.
- Cap rate 10.0% vs local median 3.6% in Lapeer — top-decile yield for the area; either an underpriced asset or a hidden risk that comps aren't pricing in. Stress-test before assuming the spread holds.
Location & tenants
- Location reads 72/100 on livability (#231 in MI) — a middle-class / working-renter tenant base. Strengths: cost of living A+, housing A+, health & safety A-; Watch: schools D+, employment D, commute F.
- Lapeer Community Schools (town): math 31% / reading 49% proficiency, ranked #202 of 540 in MI (top 37%) — families likely to look elsewhere, expect single-tenant / working-renter base with shorter leases.
- Market conditions: 186 active listings in the ZIP; 3 comparable units currently listed for rent nearby; rentals leasing fast (median 2d on market — plan ~1-2 weeks tenant-placement turnaround); 152 units permitted in Lapeer County in 2024 (0 in 5+ unit buildings).
Forward outlook
- Local home prices are declining (-3.0%/yr); year-one equity from $794 of loan paydown is wiped out by about $3k of value loss. Plan a longer hold.
- Lapeer County population projected at -10% by 2050 — secular population decline; favor cash flow + early exit over multi-decade hold.
- At projected returns (-3.0% appreciation + 3.0% rent growth), your $32k cash investment doubles in ~9 years — after that, you're playing with house money.
Negotiation context
- It's been on market 71 days — a 6% lower offer ($108k) is reasonable based on typical stale-listing flexibility.
- 2 sale attempts; this cycle's ask has dropped $10k (8%) from the opening price — seller is motivated, your offer sets the floor, not the list.
Risks & watch-outs
- Watch-outs: built in 1940 — expect roof / HVAC / electrical / plumbing capex.
Questions for the listing agent
- It's been on market 71 days. Have you received any prior offers? Is the seller open to a 6% concession, seller financing, or rate buy-down credit?
- Built in 1940 — when were the roof, HVAC, electrical panel, plumbing, and water heater last replaced?
- Why hasn't it sold? Are there any deal-killer items the seller is aware of (foundation, flood, title, zoning, code violations)?
- Is there a deadline driving the sale (1031 exchange, divorce, estate, relocation)? That informs how much negotiation room exists.
- Schools are D-rated, which usually means shorter tenancies and higher turnover. Who's the typical renter profile here, and what's been the actual vacancy rate?
- What's the average days-on-market for RENTAL listings here right now (not sales)? A rising rental-DOM trend means longer vacancies and softer asking-rent achievability than the comps imply.
- What's the recent tenant-quality profile in this submarket — average credit score on applications, eviction rate, late-payment / NSF rate, and stable-employment percentage? A property-management company in the area should have these aggregated.
- How much new for-sale + rental construction is in the pipeline within 1–3 miles? Heavy new supply typically softens prices + rents 12–24 months out; constrained supply supports both.
Investment metrics
- 1% rule
- 1.13% ✓
- Cap rate
- 9.96%
- Cash-on-cash
- 13.11%
- DSCR
- 1.58
- GRM
- 7.4
CMA / ARV
- ARV (median comp)
- $152,682
- List price
- $114,900
- Delta
- -24.75%
- Verdict
- UNDERPRICED
- Comps
- 20 within 1.0 mi
Show comp detail 10 sales within ~0.75 mi
| Address | Dist | Beds/Ba | Sqft | Sold | Price | $/sf | Match |
|---|---|---|---|---|---|---|---|
| 735 N Court St | 0.14mi | 2/1.0 (+1) | 976 (+6%) | 10mo | $200,000 | $205 | 68 |
| 362 Nightingale St | 0.48mi | 2/1.5 (+1) | 900 (-2%) | 1mo | $190,000 | $211 | 68 |
| 1240 Pine St | 0.25mi | 2/1.0 (+1) | 936 (+2%) | 16mo | $175,000 | $187 | 65 |
| 506 E Oregon St | 0.50mi | 2/1.0 (+1) | 935 (+1%) | 12mo | $64,250 | $69 | 57 |
| 1230 Jefferson St | 0.54mi | 2/1.0 (+1) | 900 (-2%) | 10mo | $159,000 | $177 | 55 |
| 106 Pope St | 0.40mi | 1/1.0 | 1,000 (+8%) | 14mo | $70,000 | $70 | 54 |
| 1145 N Monroe St | 0.37mi | 1/1.0 | 870 (-6%) | 22mo | $154,000 | $177 | 53 |
| 1130 Jefferson St | 0.51mi | 2/1.0 (+1) | 970 (+5%) | 23mo | $169,900 | $175 | 41 |
| 413 Turrill Ave | 0.73mi | 2/1.0 (+1) | 1,036 (+12%) | 2mo | $165,000 | $159 | 37 |
| 527 Turrill Ave | 0.73mi | 2/1.0 (+1) | 800 (-13%) | 2mo | $158,000 | $198 | 35 |
Match score weights: distance 35% · size 25% · config 20% · recency 20%. Top-matched comps best support the ARV.
Projected returns pro-forma
-3.0% appreciation · 3.0% rent growth · sell at horizon
- IRR
- 3.0%
- Equity multiple
- 1.12×
- Total profit
- $3,712
- Equity at exit
- $17,132
- IRR
- 12.5%
- Equity multiple
- 1.99×
- Total profit
- $31,836
- Equity at exit
- $9,934
Cash invested: $32,172 (down + closing). Projections, not guarantees.
Landlord ↔ Tenant lean methodology
- Overall (STATE)
- 62 Landlord-Friendly
- State Michigan
- 62 Landlord-Friendly · EVEN
- County
- — inherits STATE
- City
- — inherits STATE
ZIP-level market 48446
- Active inventory
- 186
- Price-to-rent
- 7.4×
Monthly cashflow live
- Estimated rent
- $1,298 medium interval (Pro) →
- Mortgage (P&I)
- −$603
- Tax from tax record
- −$23 /mo · $280/yr
- Insurance
- −$48
- HOA
- −$0
- Vacancy / Maint / Mgmt
- −$273
- Net cashflow
- $351
Break-even live
UW: 25.0% down · 7.5% · 30yr · 1.5% tax · 5.0% vac · 8.0% maint · 8.0% mgmt
Financing live
Cash to close
- Down payment
- $28,725
- Closing costs
- $3,447
- Reserves months
- —
- Total cash needed
- —
Loan-product check · same deal, 3 products live
Conventional
25% down · 7.5% · 30yr
- Down + closing
- —
- Monthly P&I
- —
- Monthly cashflow
- —
- DSCR
- —
- Eligible?
- —
Personal DTI + credit; lowest rate.
DSCR
20% down · 8.5% · 30yr
- Down + closing
- —
- Monthly P&I
- —
- Monthly cashflow
- —
- DSCR
- —
- Eligible?
- —
No personal income docs; deal must DSCR.
Hard money
10% down · 12.0% · 12mo
- Down + closing
- —
- Monthly P&I
- —
- Monthly cashflow
- —
- DSCR
- —
- Eligible?
- —
Short-term bridge; refi at stabilization.
Rent comps 3 comps
| Address | Beds | Baths | Sqft | Rent | $/sqft | DOM | Units | Dist |
|---|---|---|---|---|---|---|---|---|
| 1677 Woodbridge Park Ave Lapeer, MI | 1.0–2.0 | 1.0–1.5 | 830 | $2,000 | $2.41 | 10d | 1 | 1.14mi |
| 930 Village West Dr N Lapeer, MI | 1.0–2.0 | 1.0 | 797 | $925 | $1.16 | 1d | 2 | 1.26mi |
| 1885 Raleigh Ave Unit 07 Lapeer, MI | 2.0 | 1.0 | 1005 | $1,205 | $1.20 | 1d | 1 | 1.47mi |
Listing history 15 events
-
2026-06-18days on market $114,900 Active 71 DOM
-
2026-06-17days on market $114,900 Active 70 DOM
-
2026-06-16days on market $114,900 Active 69 DOM
-
2026-06-15days on market $114,900 Active 68 DOM
-
2026-06-13days on market $114,900 Active 66 DOM
-
2026-06-09days on market $114,900 Active 62 DOM
-
2026-06-08days on market $114,900 Active 61 DOM
-
2026-06-07days on market $114,900 Active 60 DOM
-
2026-06-04days on market $114,900 Active 57 DOM
-
2026-06-03days on market $114,900 Active 56 DOM
-
2026-06-02days on market $114,900 Active 55 DOM
-
2026-06-01days on market $114,900 Active 54 DOM
-
2026-05-31days on market $114,900 Active 53 DOM
-
2026-04-08$124,900 Active 688-char remark
Show marketing remark (678 chars)
Charming one-bedroom home in Lapeer set on a corner lot with convenient off-street parking. This move-in ready property features fresh paint and new flooring throughout, along with 1.5 baths and first-floor laundry for added everyday convenience. The layout is efficient and easy to maintain, making it a great option for a starter home, downsizing, or investment. Enjoy the covered back porch patio - perfect for relaxing outdoors. The property also includes a large shed for extra storage and a usable yard space. Located within walking distance to downtown, you'll have quick access to shopping, dining, and local amenities. A solid, low-maintenance home in a great location.
-
2026-04-08$124,900 Active 678-char remark
Show marketing remark (678 chars)
Charming one-bedroom home in Lapeer set on a corner lot with convenient off-street parking. This move-in ready property features fresh paint and new flooring throughout, along with 1.5 baths and first-floor laundry for added everyday convenience. The layout is efficient and easy to maintain, making it a great option for a starter home, downsizing, or investment. Enjoy the covered back porch patio - perfect for relaxing outdoors. The property also includes a large shed for extra storage and a usable yard space. Located within walking distance to downtown, you'll have quick access to shopping, dining, and local amenities. A solid, low-maintenance home in a great location.
ⓘ Source: listings_history table (triggers on properties + properties_extension) + one-shot
backfill from property_details.listing_events for pre-trigger history.
Tax reassessment forecast MI · Partial reset (capped growth)
- Current annual tax
- $280 · $23/mo
- Projected year-2 tax
- $1,025 · $85/mo
- Expected delta
- +$745/yr (+$62/mo · 266.1%)
ⓘ Screening estimate from a state-policy table — verify with the county assessor before closing.
Climate risk First Street
- Flood 1/10 Low FEMA zone X (unshaded) · 0% chance over 30 yrs
- Wildfire 3/10 Moderate
- Heat 2/10 Low 7 d/yr ≥97°F today · 14 d/yr by 30 yrs out
- Wind 1/10 Low
- Air quality 3/10 Moderate 2 unhealthy d/yr today · 3 by 30 yrs out
Nearby sold comps map
Loading sold comps map…
Walkable amenities ~0.75 mi
Loading nearby amenities…
Taxation est. · year 1
- Rental income
- $15,573
- − Mortgage interest
- −$6,436
- − Property taxes
- −$280
- − Insurance
- −$574
- − Repairs & maintenance
- −$1,246
- − Management
- −$1,246
- − Depreciation
- −$3,343
- Taxable income
- $2,448
- Est. tax owed @ 24.0%
- −$588
- After-tax cash flow
- $3,630/yr
For passive investors: Depreciation is non-cash, so a rental often shows a tax loss while cash-flowing — sheltering income. Rental losses are passive: they offset passive income freely, and up to $25,000/yr can offset ordinary (W-2) income if you actively participate and your MAGI is under $100k (phasing out to $0 by $150k); unused losses carry forward. On sale, claimed depreciation is recaptured at up to 25%, and gains may owe capital-gains tax (a 1031 exchange can defer both). Figures are a year-1 estimate at your 24.0% rate — not tax advice; consult a CPA.
Schools (NCES district)
- District
- Lapeer Community Schools
- NCES district ID
- 2621180
- Math proficiency
- 31% ▼ -9.00%
- Reading proficiency
- 49% ▼ -4.00%
- Median HH income
- $53,749
- Composite
- 34.79/100
- National rank
- #5113
- State rank
- #202 of 540 in MI
Livability — Lapeer
- Score
- 72/100
- State rank
- #231
- US rank
- #5855
Category grades
Schools grade is shown separately in the Schools card above.
Census & demographics
- Census place
- Lapeer, MI
- County
- Lapeer County · 30,581 people
- City population
- 30,581
- Metro
- Detroit-Warren-Dearborn, MI
- Population (ZIP)
- 30,581
- Household income
- $66,062
- Rent vs Own
- Severe rent burden
- 908.0
Population outlook (Lapeer County) Hauer SSP2
- Today (2025)
- 89,826 people
- By 2030
- 89,535 · -0.3%
- By 2040
- 86,695 · -3.5%
- By 2050
- 80,566 · -10.3%
- By 2075
- 65,783 · -26.8%
- By 2100
- 46,584 · -48.1%
Race, ethnicity, and origin ACS 2023
- Neighborhood character
- Predominantly White (89%)
- Race & ethnicity
- White 89% Two or more races 6% Hispanic / Latino 3% Black 3%
- Common ancestry
- Romanian 6% Lithuanian 4% Slovak 3%
- Foreign-born
- 1% · Canada
- Languages at home
- 98% English-only · Spanish 1%
Political lean MEDSL · Lapeer
- 2024 margin
- Solid R (+39.8) · D 29.5% · R 69.3% · Other 1.3%
- 2008→2024 swing
- -36.8pp toward R · 2008: -3.0pp · 2024: -39.8pp
- All cycles
- 2024: R+39.8 2020: R+36.3 2016: R+38.3 2012: R+11.5 2008: R+3.0
Not yet ingested
- Civics
- —
Market trends
- HPI YoY
- ▼ -243.58%
- Current HPI
- 212.3665
- Rent YoY
- —
- Metro
- Detroit-Warren-Dearborn, MI
- State GDP YoY
- ▲ 1.37%
- F500 in state
- 28
Industry mix (Fortune 500 HQ in MI)
| Industry | F500 HQs | Revenue |
|---|---|---|
| Automotive Parts | 3 | $48B |
|
||
| Automotive | 2 | $372B |
|
||
| Chemicals | 1 | $45B |
|
||
| Automotive Retail | 1 | $29B |
|
||
| Healthcare / Medical Devices | 1 | $23B |
|
||
| Automotive Technology | 1 | $20B |
|
||
Price history
+0.0% since first listed2 events — show timeline
- 2026-04-08 Listed $124,900 REALCOMP
- 2026-04-08 Listed $124,900 MiRealSource-MiMLS
Property tax history
-5.3%/yrLatest (2025): $280 · -57.6% YoY. Source: county tax records.
Cash-flow waterfall
monthlySold comps — $/sqft
last 12 mo · ≤1 miLoading sold comps…