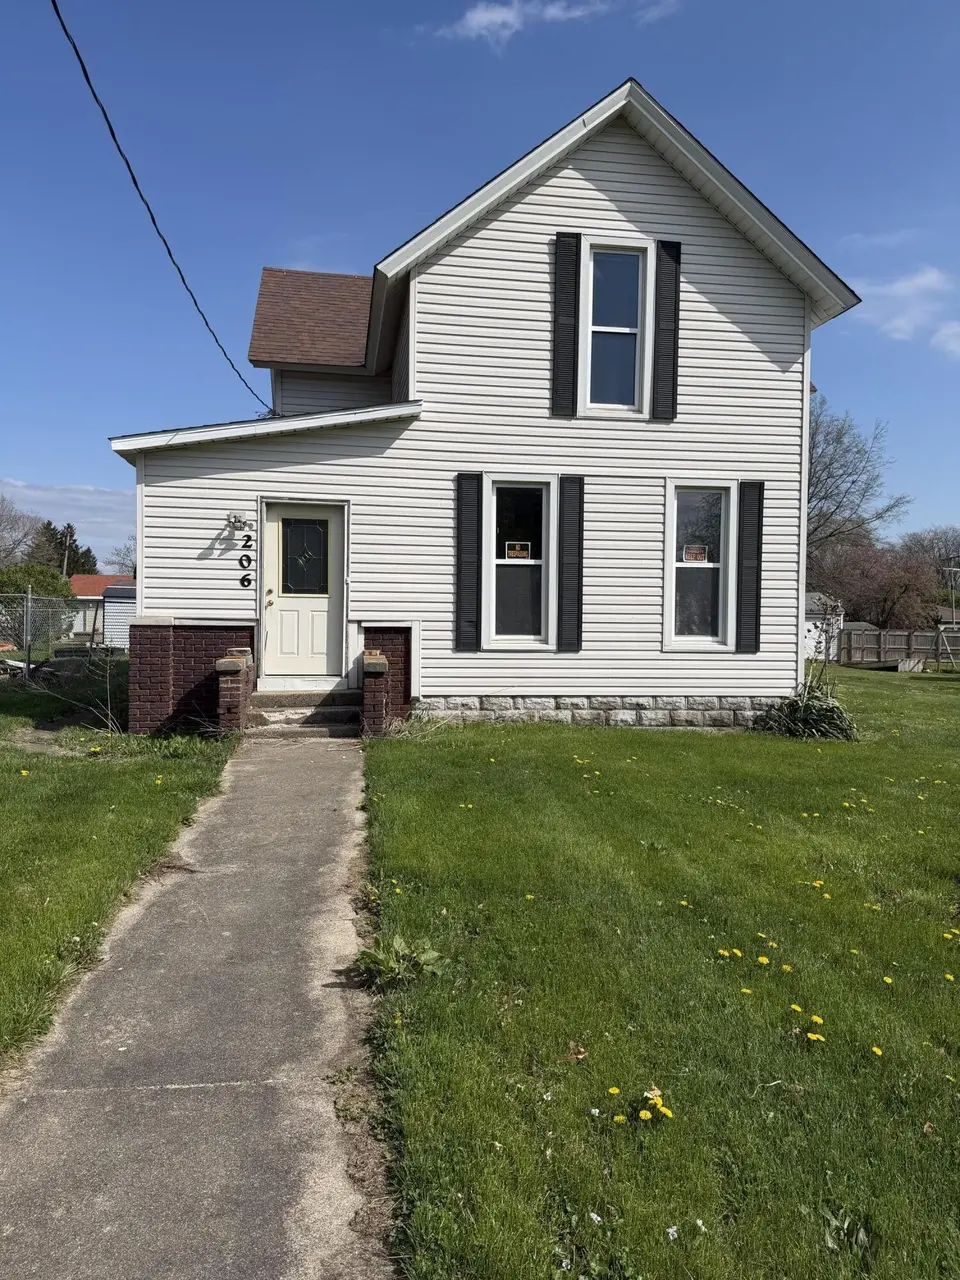
206 E Wayland St · Goodland, IN
Flood risk 1/10 · Minimal
- FEMA flood zone
- X (unshaded)
- Chance of flooding over 30 yrs
- 0.0%
- Est. flood insurance / yr
- $507 – $1,088
Fire risk 1/10 · Minimal
- Est. fire insurance / yr
- $717 – $1,331
Heat risk 3/10 · Minor
- Hot days now (above 102°F)
- 7 days/yr
- Hot days in 30 yrs
- 17 days/yr
Wind risk 2/10 · Minimal
- Chance of severe wind over 30 yrs
- 0.0%
Air-quality risk 2/10 · Minimal
- Unhealthy air days now
- 1 days/yr
- Unhealthy air days in 30 yrs
- 2 days/yr
Risk factors via First Street. Map © Google.
Why this score? — see what drove the B grade
The composite is a weighted blend of 9 inputs, each scored 0–100. Each bar is that input's sub-score; the figure is the points it added to the 100-point composite (weight × sub-score).
- Cash flow +30.0/30.0
- 1% rule +10.0/10.0
- DSCR +10.0/10.0
- ARV discount +7.5/15.0
- Appreciation +3.7/10.0
- Livability +3.2/5.0
- Schools +2.8/10.0
- Rent growth +2.5/5.0
- Condition / age +2.5/5.0
$44,000
🖨 Deal sheet 📄 Offer letter ✓ Due diligence
Listing remarks MLS
So many updates! This home boasts many improvements, including new siding, windows with custom blinds, furnace, hot water heater, plumbing, ductwork, and insulation. Enter through the front door into the huge enclosed porch. The eat-in kitchen offers updated flooring and cabinets and has floor to ceiling windows to let in lots of natural light. Both bathrooms have been completely updated with new tub/showers, toilets, and vanities. The utility room is huge, providing you with lots of storage or work space. Step out the back door and appreciate the fenced in yard. All of this for only $74,900.What more could you find for this price? Come and take a look today!
Key facts
- 0.25 acre lot
- Garage
- Built 1890
Property features AI
Finance
- Other: Living area reported as 1,704 (Assessor source); Upper level finished area 672; main level finished area 1,032; Occupancy: Vacant
Exterior
- Parking: Driveway; 1-car garage
- Utilities: Public water; Public sewer; Natural gas connected; Electricity connected (100 amp service); Cable available
- Home design: One and one-half story; Built in 1890; Property listed as fixer
- Construction: Vinyl siding construction; Shingle roof; Crawl space foundation; Originally built in 1890
- Exterior features: Vinyl siding; Shingle roof; Garage structure on property
Interior
- Kitchen: Refrigerator included
- Bedrooms: Primary bedroom; Additional bedrooms (two listed)
- Bathrooms: 2 full bathrooms
- Heating & cooling: Central heating; Ceiling fans
- Interior features: Eat-in kitchen; Storm windows; City view; Crawl space and unfinished basement
- Laundry & utility: Laundry on main level; Utility room
Neighborhood map
What this means for you Summary
Snapshot
- This is a 4-bed/1.0-bath single-family listed at $44k.
Deal economics
- At list price, monthly cash flow is $589 ($7k/yr) — positive.
- The deal already cash-flows at list — no discount required.
- Meets the 1% rule at list price ($1k rent vs $44k).
Location & tenants
- Location reads 64/100 on livability (#402 in IN) — a middle-class / working-renter tenant base. Strengths: crime A+, cost of living A+, housing B+; Watch: employment D+, amenities F, commute F.
- South Newton School Corporation (rural): math 29% / reading 35% proficiency, ranked #219 of 301 in IN (top 73%) — families likely to look elsewhere, expect single-tenant / working-renter base with shorter leases.
- Zoned schools: South Newton Elementary School (math 37% / reading 32%, grade F, #597 of 994 statewide, top 63%, 416 students, 68% FRL); South Newton Middle School (math 22% / reading 32%, grade F, #234 of 330 statewide, top 71%, 204 students, 71% FRL); South Newton Senior High School (math 24% / reading 64%, grade F, #169 of 369 statewide, top 51%, 242 students, 52% FRL).
- Market conditions: 11 active listings in the ZIP; 24 units permitted in Newton County in 2024 (0 in 5+ unit buildings).
Forward outlook
- Local home prices are declining (-2.6%/yr); year-one equity from $304 of loan paydown is wiped out by about $1k of value loss. Plan a longer hold.
- Newton County population projected at -12% by 2050 — secular population decline; favor cash flow + early exit over multi-decade hold.
- At projected returns (-2.6% appreciation + 3.0% rent growth), your $12k cash investment doubles in ~2 years — after that, you're playing with house money.
Negotiation context
- Only 1 days on market — expect competitive offers; lowballing is unlikely to land.
- 3 sale attempts since 21y ago with the ask held roughly flat each time — persistent listings suggest the price (not the market) is what's stuck; bring a comps-based counter.
- Current owner paid $20k; list at $44k implies a 120% gain — meaningful room to come down on a strong offer.
Risks & watch-outs
- Watch-outs: property tax is 3.8% of price; built in 1890 — expect roof / HVAC / electrical / plumbing capex.
Questions for the listing agent
- Built in 1890 — when were the roof, HVAC, electrical panel, plumbing, and water heater last replaced?
- Property tax is high relative to price — has the assessment been appealed recently, and will the sale trigger a re-assessment?
- Is there a deadline driving the sale (1031 exchange, divorce, estate, relocation)? That informs how much negotiation room exists.
- Schools are F-rated, which usually means shorter tenancies and higher turnover. Who's the typical renter profile here, and what's been the actual vacancy rate?
- What's the average days-on-market for RENTAL listings here right now (not sales)? A rising rental-DOM trend means longer vacancies and softer asking-rent achievability than the comps imply.
- What's the recent tenant-quality profile in this submarket — average credit score on applications, eviction rate, late-payment / NSF rate, and stable-employment percentage? A property-management company in the area should have these aggregated.
- How much new for-sale + rental construction is in the pipeline within 1–3 miles? Heavy new supply typically softens prices + rents 12–24 months out; constrained supply supports both.
Investment metrics
- 1% rule
- 2.81% ✓
- Cap rate
- 22.35%
- Cash-on-cash
- 57.34%
- DSCR
- 3.55
- GRM
- 3.0
CMA / ARV
- ARV (on-the-fly)
- $141,432
- Comps found
- 10
Show comp detail 10 sales within ~0.75 mi
| Address | Dist | Beds/Ba | Sqft | Sold | Price | $/sf | Match |
|---|---|---|---|---|---|---|---|
| 206 E Wayland St | 0.00mi | 4/2.0 | 1,704 (0%) | 1mo | $44,000 | $26 | 96 |
| 115 W Monroe St | 0.19mi | 3/2.0 (-1) | 1,578 (-7%) | 2mo | $262,000 | $166 | 69 |
| 214 N Newton St | 0.11mi | 3/2.0 (-1) | 1,584 (-7%) | 6mo | $182,000 | $115 | 69 |
| 501 N Humston St | 0.32mi | 3/2.0 (-1) | 1,693 (-1%) | 15mo | $220,000 | $130 | 63 |
| 238 W Jasper St | 0.40mi | 3/1.0 (-1) | 1,752 (+3%) | 12mo | $145,000 | $83 | 62 |
| 118 N Garfield Ave | 0.50mi | 3/1.5 (-1) | 1,714 (+1%) | 19mo | $63,900 | $37 | 53 |
| 315 W Union St | 0.56mi | 4/1.5 | 1,608 (-6%) | 13mo | $128,750 | $80 | 52 |
| 301 W Union St | 0.52mi | 3/1.5 (-1) | 1,803 (+6%) | 9mo | $85,000 | $47 | 52 |
| 205 N Iroquis St | 0.22mi | 3/2.0 (-1) | 1,552 (-9%) | 23mo | $179,900 | $116 | 47 |
| 426 W Union St | 0.69mi | 3/1.0 (-1) | 1,892 (+11%) | 14mo | $100,100 | $53 | 33 |
Match score weights: distance 35% · size 25% · config 20% · recency 20%. Top-matched comps best support the ARV.
Projected returns pro-forma
-2.61% appreciation · 3.0% rent growth · sell at horizon
- IRR
- 56.3%
- Equity multiple
- 3.53×
- Total profit
- $31,146
- Equity at exit
- $7,317
- IRR
- 61.0%
- Equity multiple
- 7.19×
- Total profit
- $76,299
- Equity at exit
- $5,117
Cash invested: $12,320 (down + closing). Projections, not guarantees.
Landlord ↔ Tenant lean methodology
- Overall (STATE)
- 90 Strongly Landlord-Friendly
- State Indiana
- 90 Strongly Landlord-Friendly · R+11
- County
- — inherits STATE
- City
- — inherits STATE
ZIP-level market 47948
- Home prices YoY
- -1.0%
- Active inventory
- 11
- Price-to-rent
- 3.0×
Monthly cashflow live
- Estimated rent
- $1,235 medium interval (Pro) →
- Mortgage (P&I)
- −$231
- Tax from tax record
- −$138 /mo · $1,652/yr
- Insurance
- −$18
- HOA
- −$0
- Vacancy / Maint / Mgmt
- −$259
- Net cashflow
- $589
Break-even live
UW: 25.0% down · 7.5% · 30yr · 1.5% tax · 5.0% vac · 8.0% maint · 8.0% mgmt
Financing live
Cash to close
- Down payment
- $11,000
- Closing costs
- $1,320
- Reserves months
- —
- Total cash needed
- —
Loan-product check · same deal, 3 products live
Conventional
25% down · 7.5% · 30yr
- Down + closing
- —
- Monthly P&I
- —
- Monthly cashflow
- —
- DSCR
- —
- Eligible?
- —
Personal DTI + credit; lowest rate.
DSCR
20% down · 8.5% · 30yr
- Down + closing
- —
- Monthly P&I
- —
- Monthly cashflow
- —
- DSCR
- —
- Eligible?
- —
No personal income docs; deal must DSCR.
Hard money
10% down · 12.0% · 12mo
- Down + closing
- —
- Monthly P&I
- —
- Monthly cashflow
- —
- DSCR
- —
- Eligible?
- —
Short-term bridge; refi at stabilization.
Listing history 6 events
-
2026-05-11status Pending
-
2026-05-10$44,000 Active
-
2019-10-29soldstatus $20,000
-
2012-01-21historical
-
2011-07-20$79,000
-
2005-12-22$74,900 667-char remark
Show marketing remark (667 chars)
So many updates! This home boasts many improvements, including new siding, windows with custom blinds, furnace, hot water heater, plumbing, ductwork, and insulation. Enter through the front door into the huge enclosed porch. The eat-in kitchen offers updated flooring and cabinets and has floor to ceiling windows to let in lots of natural light. Both bathrooms have been completely updated with new tub/showers, toilets, and vanities. The utility room is huge, providing you with lots of storage or work space. Step out the back door and appreciate the fenced in yard. All of this for only $74,900.What more could you find for this price? Come and take a look today!
ⓘ Source: listings_history table (triggers on properties + properties_extension) + one-shot
backfill from property_details.listing_events for pre-trigger history.
Tax reassessment forecast IN · Partial reset (capped growth)
- Current annual tax
- $1,652 · $138/mo
- Projected year-2 tax
- $1,652 · $138/mo
- Expected delta
- $0/yr ($0/mo · 0.0%)
ⓘ Screening estimate from a state-policy table — verify with the county assessor before closing.
Climate risk First Street
- Flood 1/10 Low FEMA zone X (unshaded) · 0% chance over 30 yrs
- Wildfire 1/10 Low
- Heat 3/10 Moderate 7 d/yr ≥102°F today · 17 d/yr by 30 yrs out
- Wind 2/10 Low 0% chance of damaging wind over 30 yrs
- Air quality 2/10 Low 1 unhealthy d/yr today · 2 by 30 yrs out
Nearby sold comps map
Loading sold comps map…
Walkable amenities ~0.75 mi
Loading nearby amenities…
Taxation est. · year 1
- Rental income
- $14,817
- − Mortgage interest
- −$2,465
- − Property taxes
- −$1,652
- − Insurance
- −$220
- − Repairs & maintenance
- −$1,185
- − Management
- −$1,185
- − Depreciation
- −$1,280
- Taxable income
- $6,830
- Est. tax owed @ 24.0%
- −$1,639
- After-tax cash flow
- $5,425/yr
For passive investors: Depreciation is non-cash, so a rental often shows a tax loss while cash-flowing — sheltering income. Rental losses are passive: they offset passive income freely, and up to $25,000/yr can offset ordinary (W-2) income if you actively participate and your MAGI is under $100k (phasing out to $0 by $150k); unused losses carry forward. On sale, claimed depreciation is recaptured at up to 25%, and gains may owe capital-gains tax (a 1031 exchange can defer both). Figures are a year-1 estimate at your 24.0% rate — not tax advice; consult a CPA.
Schools (NCES district)
- District
- South Newton School Corporation
- NCES district ID
- 1810470
- Math proficiency
- 29% ▼ -18.00%
- Reading proficiency
- 35% ▼ -14.00%
- Median HH income
- $46,624
- Composite
- 27.52/100
- National rank
- #6952
- State rank
- #219 of 301 in IN
Livability — Goodland
- Score
- 64/100
- State rank
- #402
- US rank
- #14749
Category grades
Schools grade is shown separately in the Schools card above.
Census & demographics
- Census place
- Goodland, IN
- Population (ZIP)
- 1,158
Population outlook (Newton County) Hauer SSP2
- Today (2025)
- 13,726 people
- By 2030
- 13,448 · -2.0%
- By 2040
- 12,771 · -7.0%
- By 2050
- 12,104 · -11.8%
- By 2075
- 11,059 · -19.4%
- By 2100
- 9,813 · -28.5%
Race, ethnicity, and origin ACS 2023
- Neighborhood character
- Predominantly White (91%)
- Race & ethnicity
- White 91% Two or more races 6% Hispanic / Latino 4%
- Common ancestry
- Romanian 7% Iranian 5% Lithuanian 3%
- Foreign-born
- 1% · Canada
- Languages at home
- 98% English-only · Spanish 2%
Political lean MEDSL · Newton
- 2024 margin
- Solid R (+57.0) · D 20.8% · R 77.7% · Other 1.5%
- 2008→2024 swing
- -45.8pp toward R · 2008: -11.2pp · 2024: -57.0pp
- All cycles
- 2024: R+57.0 2020: R+52.1 2016: R+46.1 2012: R+19.1 2008: R+11.2
Not yet ingested
- Civics
- —
Market trends
- HPI YoY
- ▼ -2.61%
- Current HPI
- 256.3507
- Rent YoY
- —
- Metro
- —
- State GDP YoY
- ▲ 2.90%
- F500 in state
- 18
Industry mix (Fortune 500 HQ in IN)
| Industry | F500 HQs | Revenue |
|---|---|---|
| Industrial Machinery | 2 | $37B |
|
||
| Healthcare | 1 | $177B |
|
||
| Pharmaceuticals | 1 | $45B |
|
||
| Metals / Steel | 1 | $18B |
|
||
| Agriculture | 1 | $17B |
|
||
| Packaging | 1 | $12B |
|
||
Price history
-41.3% since first listed6 events — show timeline
- 2026-05-11 Pending — NIRA MLS as Distributed by MLS Grid
- 2026-05-10 Listed $44,000 NIRA MLS as Distributed by MLS Grid
- 2019-10-29 Sold (Public Records) $20,000 Public Records
- 2012-01-21 Listing Removed — NIRA MLS as Distributed by MLS Grid
- 2011-07-20 Listed $79,000 NIRA MLS as Distributed by MLS Grid
- 2005-12-22 Listed $74,900 NIRA MLS as Distributed by MLS Grid
Property tax history
+2.8%/yrLatest (2024): $1,652 · +8.4% YoY. Source: county tax records.
Cash-flow waterfall
monthlySold comps — $/sqft
last 12 mo · ≤1 miLoading sold comps…