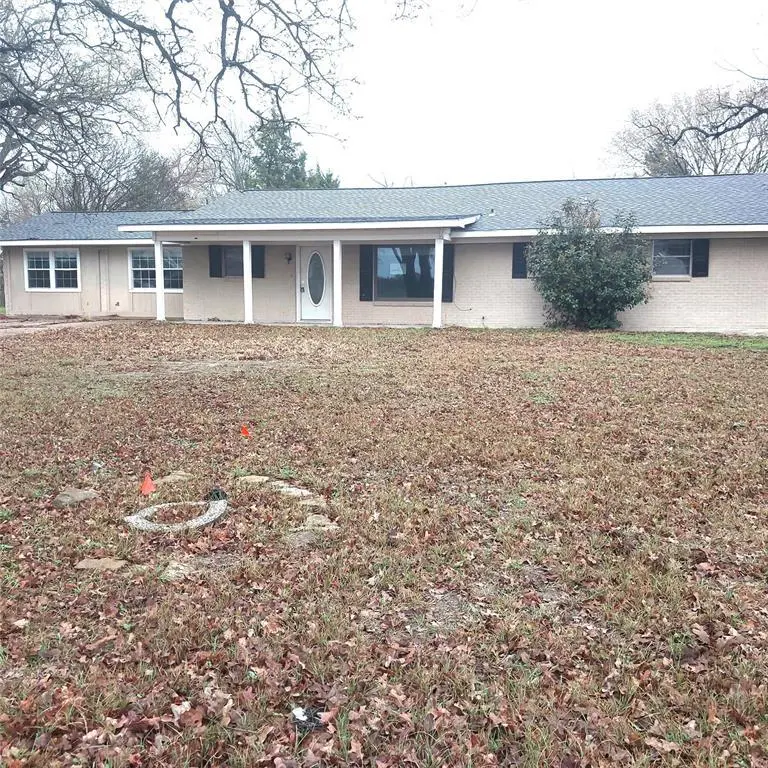
986 Us-84 W · Teague, TX
Flood risk 1/10 · Minimal
- FEMA flood zone
- —
- Chance of flooding over 30 yrs
- 0.0%
- Est. flood insurance / yr
- —
Fire risk 4/10 · Minor
- Est. fire insurance / yr
- $1,222 – $2,270
Heat risk 7/10 · Major
- Hot days now (above 110°F)
- 7 days/yr
- Hot days in 30 yrs
- 25 days/yr
Wind risk 8/10 · Major
- Chance of severe wind over 30 yrs
- 80.0%
Air-quality risk 1/10 · Minimal
- Unhealthy air days now
- 0 days/yr
- Unhealthy air days in 30 yrs
- 0 days/yr
Risk factors via First Street. Map © Google.
Why this score? — see what drove the B- grade
The composite is a weighted blend of 9 inputs, each scored 0–100. Each bar is that input's sub-score; the figure is the points it added to the 100-point composite (weight × sub-score).
- Cash flow +22.5/30.0
- ARV discount +15.0/15.0
- DSCR +7.2/10.0
- 1% rule +6.8/10.0
- Appreciation +6.1/10.0
- Schools +3.7/10.0
- Livability +3.4/5.0
- Rent growth +2.5/5.0
- Condition / age +2.5/5.0
$112,000
🖨 Deal sheet 📄 Offer letter ✓ Due diligence
Listing remarks MLS
HUD Owned Home FHA Case# 511-311624 Sold AS-IS. Great 3-bedroom brick home. This home has good curb appeal and offers a detached carport, large yard with a storage building and a huge workshop. The interior has an open kitchen and living area and a split floorplan. There are 3 bedrooms and a huge bonus room. This home offers a lot for the money. Come take a look before it is gone! Owner occupant buyers may be able to purchase with as little as $100 down when utilizing the HUD FHA Sales Incentive.
Key facts
- Detached carport
- Storage building
- Large yard
Tags
Neighborhood map
What this means for you Summary
Snapshot
- This is a 3-bed/2.5-bath single-family listed at $112k.
Deal economics
- At list price, monthly cash flow is $189 ($2k/yr) — positive.
- The deal already cash-flows at list — no discount required.
- Meets the 1% rule at list price ($1k rent vs $112k).
- Recommended offer: $105k (6.0% below list) — sets the bar for market timing.
- Cap rate 8.3% vs local median 2.6% in Teague — top-decile yield for the area; either an underpriced asset or a hidden risk that comps aren't pricing in. Stress-test before assuming the spread holds.
Location & tenants
- Location reads 67/100 on livability (#518 in TX) — a middle-class / working-renter tenant base. Strengths: cost of living A+, housing A+, crime B+; Watch: schools D+, amenities F, commute F.
- Teague ISD (town): math 43% / reading 45% proficiency, ranked #289 of 826 in TX (top 35%) — families likely to look elsewhere, expect single-tenant / working-renter base with shorter leases.
- Market conditions: 83 active listings in the ZIP; 2 units permitted in Freestone County in 2024 (0 in 5+ unit buildings).
Forward outlook
- In year one you build about $3k of equity ($774 loan paydown + $2k appreciation (2.2% local appreciation)).
- Freestone County population projected to shrink 4% by 2050 — rents likely to lag national; underwrite the cash flow, not the appreciation.
- At projected returns (2.2% appreciation + 3.0% rent growth), your $31k cash investment doubles in ~5 years — after that, you're playing with house money.
- By year 10, paydown + projected appreciation supports a ~$32k cash-out refi (75% LTV) — recoverable capital for the next deal without selling this one.
Negotiation context
- It's been on market 80 days — a 6% lower offer ($105k) is reasonable based on typical stale-listing flexibility.
- 2 sale attempts since 4y ago; this cycle's ask has dropped $53k (32%) from the opening price — seller is motivated, your offer sets the floor, not the list.
Risks & watch-outs
- Climate carrying-cost: severe wind risk, 80% chance of damaging wind over 30y; extreme-heat days projected 7→25/yr by 2055 (HVAC capex compounding) — expect insurance premiums to compound above CPI over the hold.
Questions for the listing agent
- It's been on market 80 days. Have you received any prior offers? Is the seller open to a 6% concession, seller financing, or rate buy-down credit?
- Why hasn't it sold? Are there any deal-killer items the seller is aware of (foundation, flood, title, zoning, code violations)?
- Is there a deadline driving the sale (1031 exchange, divorce, estate, relocation)? That informs how much negotiation room exists.
- Schools are D-rated, which usually means shorter tenancies and higher turnover. Who's the typical renter profile here, and what's been the actual vacancy rate?
- What's the average days-on-market for RENTAL listings here right now (not sales)? A rising rental-DOM trend means longer vacancies and softer asking-rent achievability than the comps imply.
- What's the recent tenant-quality profile in this submarket — average credit score on applications, eviction rate, late-payment / NSF rate, and stable-employment percentage? A property-management company in the area should have these aggregated.
- How much new for-sale + rental construction is in the pipeline within 1–3 miles? Heavy new supply typically softens prices + rents 12–24 months out; constrained supply supports both.
Investment metrics
- 1% rule
- 1.18% ✓
- Cap rate
- 8.32%
- Cash-on-cash
- 7.25%
- DSCR
- 1.32
- GRM
- 7.1
CMA / ARV
- ARV (median comp)
- $169,939
- List price
- $112,000
- Delta
- -34.09%
- Verdict
- UNDERPRICED
- Comps
- 20 within 2.0 mi
Show comp detail 1 sale within ~0.75 mi
| Address | Dist | Beds/Ba | Sqft | Sold | Price | $/sf | Match |
|---|---|---|---|---|---|---|---|
| 161 Fm 1367 | 0.45mi | 3/3.0 | 2,085 (+3%) | 16mo | $265,000 | $127 | 59 |
Match score weights: distance 35% · size 25% · config 20% · recency 20%. Top-matched comps best support the ARV.
Projected returns pro-forma
2.21% appreciation · 3.0% rent growth · sell at horizon
- IRR
- 12.3%
- Equity multiple
- 1.67×
- Total profit
- $20,999
- Equity at exit
- $45,438
- IRR
- 14.9%
- Equity multiple
- 3.04×
- Total profit
- $63,903
- Equity at exit
- $66,416
Cash invested: $31,360 (down + closing). Projections, not guarantees.
Landlord ↔ Tenant lean methodology
- Overall (STATE)
- 87 Strongly Landlord-Friendly
- State Texas
- 87 Strongly Landlord-Friendly · R+5
- County
- — inherits STATE
- City
- — inherits STATE
ZIP-level market 75860
- Home prices YoY
- 1.5%
- Active inventory
- 83
- Price-to-rent
- 7.1×
Monthly cashflow live
- Estimated rent
- $1,319 medium interval (Pro) →
- Mortgage (P&I)
- −$587
- Tax from tax record
- −$218 /mo · $2,621/yr
- Insurance
- −$47
- HOA
- −$0
- Vacancy / Maint / Mgmt
- −$277
- Net cashflow
- $189
Break-even live
UW: 25.0% down · 7.5% · 30yr · 1.5% tax · 5.0% vac · 8.0% maint · 8.0% mgmt
Financing live
Cash to close
- Down payment
- $28,000
- Closing costs
- $3,360
- Reserves months
- —
- Total cash needed
- —
Loan-product check · same deal, 3 products live
Conventional
25% down · 7.5% · 30yr
- Down + closing
- —
- Monthly P&I
- —
- Monthly cashflow
- —
- DSCR
- —
- Eligible?
- —
Personal DTI + credit; lowest rate.
DSCR
20% down · 8.5% · 30yr
- Down + closing
- —
- Monthly P&I
- —
- Monthly cashflow
- —
- DSCR
- —
- Eligible?
- —
No personal income docs; deal must DSCR.
Hard money
10% down · 12.0% · 12mo
- Down + closing
- —
- Monthly P&I
- —
- Monthly cashflow
- —
- DSCR
- —
- Eligible?
- —
Short-term bridge; refi at stabilization.
Listing history 22 events
-
2026-06-17status $112,000 Pending 80 DOM
-
2026-06-17days on market $112,000 Active Contingent 80 DOM
-
2026-06-16days on market $112,000 Active Contingent 79 DOM
-
2026-06-15days on market $112,000 Active Contingent 78 DOM
-
2026-06-15days on market $112,000 Active Contingent 77 DOM
-
2026-06-13days on market $112,000 Active Contingent 76 DOM
-
2026-06-12days on market $112,000 Active Contingent 75 DOM
-
2026-06-09statusdays on market $112,000 Active Contingent 72 DOM
-
2026-06-08days on market $112,000 Active 71 DOM
-
2026-06-08days on market $112,000 Active 70 DOM
-
2026-06-05pricedays on market $112,000 Active 68 DOM
-
2026-06-03days on market $140,000 Active 66 DOM
-
2026-06-02days on market $140,000 Active 65 DOM
-
2026-06-01days on market $140,000 Active 64 DOM
-
2026-05-31days on market $140,000 Active 63 DOM
-
2026-04-30price $140,000 502-char remark
Show marketing remark (502 chars)
HUD Owned Home FHA Case# 511-311624 Sold AS-IS. Great 3-bedroom brick home. This home has good curb appeal and offers a detached carport, large yard with a storage building and a huge workshop. The interior has an open kitchen and living area and a split floorplan. There are 3 bedrooms and a huge bonus room. This home offers a lot for the money. Come take a look before it is gone! Owner occupant buyers may be able to purchase with as little as $100 down when utilizing the HUD FHA Sales Incentive.
-
2026-03-19$165,000 Active 502-char remark
Show marketing remark (502 chars)
HUD Owned Home FHA Case# 511-311624 Sold AS-IS. Great 3-bedroom brick home. This home has good curb appeal and offers a detached carport, large yard with a storage building and a huge workshop. The interior has an open kitchen and living area and a split floorplan. There are 3 bedrooms and a huge bonus room. This home offers a lot for the money. Come take a look before it is gone! Owner occupant buyers may be able to purchase with as little as $100 down when utilizing the HUD FHA Sales Incentive.
-
2022-06-08soldstatus 813-char remark
Show marketing remark (813 chars)
This Charming 3 bedroom 2.5 bath sits on a Large Lot just under an acre at 0.7 with great mature trees. There is a fenced back yard for your leisure time! A HUGE Metal Shop sits in the backyard along with a Storage building/shed. Bedrooms are spacious with plenty storage and closet space. The Kitchen has tons of cabinet space and breakfast bar. Open layout of kitchen and living area is great for entertaining and family/friend time. This home is centrally located, close to downtown Teague and 2 miles from Teague ISD and 10 miles from your closest Walmart! 1.5 hours away from South Dallas, 2 hours away N Houston, 2.5 hours away NE Austin and 1 hour away from Waco! This peaceful rural community is a great town to live and raise a family, call today to schedule a showing- this house will not last!
-
2022-01-21$168,000 813-char remark
Show marketing remark (813 chars)
This Charming 3 bedroom 2.5 bath sits on a Large Lot just under an acre at 0.7 with great mature trees. There is a fenced back yard for your leisure time! A HUGE Metal Shop sits in the backyard along with a Storage building/shed. Bedrooms are spacious with plenty storage and closet space. The Kitchen has tons of cabinet space and breakfast bar. Open layout of kitchen and living area is great for entertaining and family/friend time. This home is centrally located, close to downtown Teague and 2 miles from Teague ISD and 10 miles from your closest Walmart! 1.5 hours away from South Dallas, 2 hours away N Houston, 2.5 hours away NE Austin and 1 hour away from Waco! This peaceful rural community is a great town to live and raise a family, call today to schedule a showing- this house will not last!
-
2010-06-18soldstatus
-
1995-11-28soldstatus
-
1989-07-06soldstatus
ⓘ Source: listings_history table (triggers on properties + properties_extension) + one-shot
backfill from property_details.listing_events for pre-trigger history.
Tax reassessment forecast TX · Resets to sale price
- Current annual tax
- $2,621 · $218/mo
- Projected year-2 tax
- $2,621 · $218/mo
- Expected delta
- $0/yr ($0/mo · 0.0%)
ⓘ Screening estimate from a state-policy table — verify with the county assessor before closing.
Climate risk First Street
- Flood 1/10 Low 0% chance over 30 yrs
- Wildfire 4/10 Moderate
- Heat 7/10 Severe 7 d/yr ≥110°F today · 25 d/yr by 30 yrs out
- Wind 8/10 Severe 80% chance of damaging wind over 30 yrs
- Air quality 1/10 Low 0 unhealthy d/yr today · 0 by 30 yrs out
Nearby sold comps map
Loading sold comps map…
Walkable amenities ~0.75 mi
Loading nearby amenities…
Taxation est. · year 1
- Rental income
- $15,826
- − Mortgage interest
- −$6,274
- − Property taxes
- −$2,621
- − Insurance
- −$560
- − Repairs & maintenance
- −$1,266
- − Management
- −$1,266
- − Depreciation
- −$3,258
- Taxable income
- $581
- Est. tax owed @ 24.0%
- −$139
- After-tax cash flow
- $2,134/yr
For passive investors: Depreciation is non-cash, so a rental often shows a tax loss while cash-flowing — sheltering income. Rental losses are passive: they offset passive income freely, and up to $25,000/yr can offset ordinary (W-2) income if you actively participate and your MAGI is under $100k (phasing out to $0 by $150k); unused losses carry forward. On sale, claimed depreciation is recaptured at up to 25%, and gains may owe capital-gains tax (a 1031 exchange can defer both). Figures are a year-1 estimate at your 24.0% rate — not tax advice; consult a CPA.
Schools (NCES district)
- District
- Teague ISD
- NCES district ID
- 4842300
- Math proficiency
- 43% ▼ -5.00%
- Reading proficiency
- 45% ▲ 2.00%
- Median HH income
- $46,009
- Composite
- 37.43/100
- National rank
- #4419
- State rank
- #289 of 826 in TX
Livability — Teague
- Score
- 67/100
- State rank
- #518
- US rank
- #10201
Category grades
Schools grade is shown separately in the Schools card above.
Census & demographics
- Census place
- Teague, TX
- Population (ZIP)
- 6,451
Population outlook (Freestone County) Hauer SSP2
- Today (2025)
- 19,591 people
- By 2030
- 19,470 · -0.6%
- By 2040
- 19,111 · -2.5%
- By 2050
- 18,700 · -4.5%
- By 2075
- 17,586 · -10.2%
- By 2100
- 14,933 · -23.8%
Race, ethnicity, and origin ACS 2023
- Neighborhood character
- Diverse neighborhood (Simpson 0.64)
- Race & ethnicity
- White 50% Hispanic / Latino 30% Two or more races 24% Black 15%
- Hispanic origin (detail)
- Mexican 25%
- Common ancestry
- Lithuanian 2% Iranian 1% Slovak 1%
- Foreign-born
- 7% · Canada
- Languages at home
- 81% English-only · Spanish 18% Arabic 1%
Political lean MEDSL · Freestone
- 2024 margin
- Solid R (+66.3) · D 16.6% · R 82.9%
- 2008→2024 swing
- -22.8pp toward R · 2008: -43.5pp · 2024: -66.3pp
- All cycles
- 2024: R+66.3 2020: R+61.5 2016: R+59.6 2012: R+50.2 2008: R+43.5
Not yet ingested
- Civics
- —
Market trends
- HPI YoY
- ▲ 2.21%
- Current HPI
- 152.2612
- Rent YoY
- —
- Metro
- —
- State GDP YoY
- ▲ 3.95%
- F500 in state
- 110
Industry mix (Fortune 500 HQ in TX)
| Industry | F500 HQs | Revenue |
|---|---|---|
| Energy | 16 | $1,198B |
|
||
| Technology | 5 | $198B |
|
||
| Engineering / Construction | 4 | $72B |
|
||
| Energy Services | 3 | $60B |
|
||
| Utilities | 3 | $41B |
|
||
| Healthcare | 2 | $330B |
|
||
Price history
-16.7% since first listed7 events — show timeline
- 2026-04-30 Price Changed $140,000 NTREIS
- 2026-03-19 Listed $165,000 NTREIS
- 2022-06-08 Sold (MLS) — NTREIS
- 2022-01-21 Listed $168,000 NTREIS
- 2010-06-18 Sold (Public Records) — Public Records
- 1995-11-28 Sold (Public Records) — Public Records
- 1989-07-06 Sold (Public Records) — Public Records
Property tax history
+0.1%/yrLatest (2025): $2,621 · +5.1% YoY. Source: county tax records.
Cash-flow waterfall
monthlySold comps — $/sqft
last 12 mo · ≤1 miLoading sold comps…