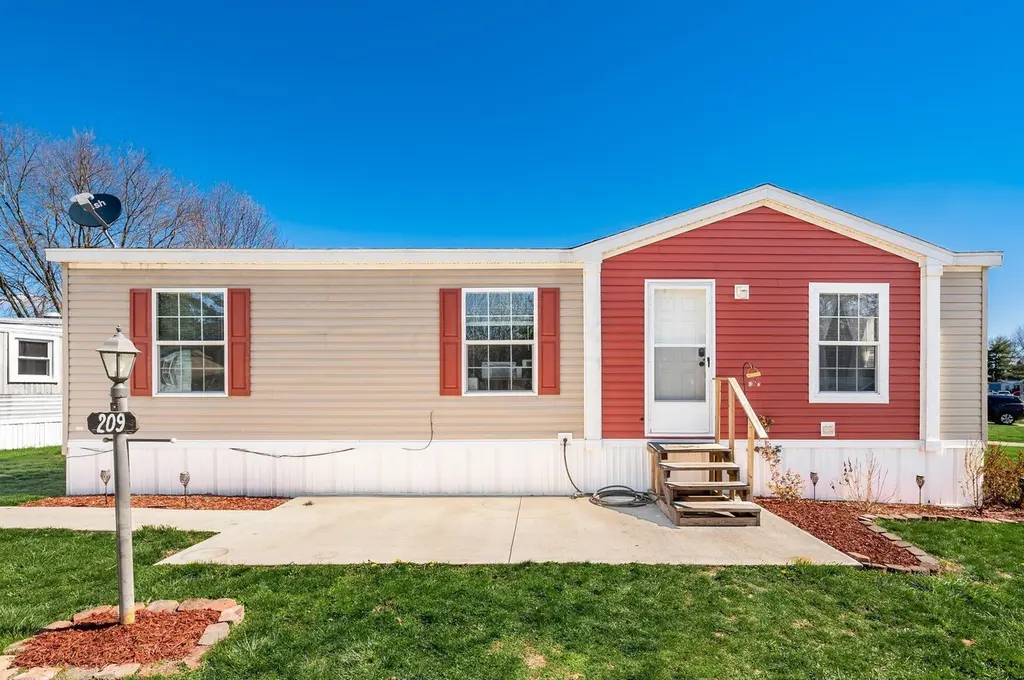
209 Villa Dr · Circleville, OH
Flood risk No data
- FEMA flood zone
- —
- Chance of flooding over 30 yrs
- —
- Est. flood insurance / yr
- —
Fire risk No data
- Est. fire insurance / yr
- —
Heat risk No data
- Hot days now (above threshold)
- —
- Hot days in 30 yrs
- —
Wind risk No data
- Chance of severe wind over 30 yrs
- —
Air-quality risk No data
- Unhealthy air days now
- —
- Unhealthy air days in 30 yrs
- —
Risk factors via First Street. Map © Google.
Why this score? — see what drove the C grade
The composite is a weighted blend of 9 inputs, each scored 0–100. Each bar is that input's sub-score; the figure is the points it added to the 100-point composite (weight × sub-score).
- Cash flow +21.9/30.0
- 1% rule +9.7/10.0
- ARV discount +7.5/15.0
- DSCR +7.0/10.0
- Livability +3.6/5.0
- Schools +3.5/10.0
- Rent growth +2.5/5.0
- Condition / age +2.2/5.0
- Appreciation +0.0/10.0
$117,000
🖨 Deal sheet 📄 Offer letter ✓ Due diligence
Listing remarks MLS
Just like new & move in ready. Only one couple has enjoyed this home for the last 3 years. Recently updated flooring. Great closet space & additional shed out back. You'll be surprised this spring to see the foliage come up in the flower bed. Sellers won best yard award last year. Pool, sewer, water & trash included in the $345 lot fee. Located close to stores and restaurants.
Key facts
- Community pool
- Built 2019
- Listed 5 days
Neighborhood map
What this means for you Summary
Snapshot
- This is a 3-bed/2.0-bath manufactured listed at $117k. Condition is rated fair.
Deal economics
- At list price, monthly cash flow is $184 ($2k/yr) — positive.
- The deal already cash-flows at list — no discount required.
- Meets the 1% rule at list price ($2k rent vs $117k).
- Cap rate 8.2% vs local median 2.9% in Circleville — top-decile yield for the area; either an underpriced asset or a hidden risk that comps aren't pricing in. Stress-test before assuming the spread holds.
Location & tenants
- Location reads 71/100 on livability (#437 in OH) — a middle-class / working-renter tenant base. Strengths: cost of living A+, housing A+, health & safety A-; Watch: amenities F, commute F, employment F.
- Circleville City (town): math 37% / reading 47% proficiency, ranked #533 of 656 in OH (top 81%) — families likely to look elsewhere, expect single-tenant / working-renter base with shorter leases.
- Market conditions: 121 active listings in the ZIP; 1 comparable units currently listed for rent nearby; 312 units permitted in Pickaway County in 2024 (0 in 5+ unit buildings).
- This rent runs 32% of the median local income ($64k/yr) — at the standard rent-burdened threshold; future hikes will face affordability resistance.
Forward outlook
- Local home prices are declining (-3.0%/yr); year-one equity from $809 of loan paydown is wiped out by about $4k of value loss. Plan a longer hold.
- Pickaway County population projected at +3% by 2050 — modest demand growth; plan on rents tracking national, not racing it.
Negotiation context
- Only 5 days on market — expect competitive offers; lowballing is unlikely to land.
- 2 sale attempts since 2y ago; this cycle's ask has dropped $8k (6%) from the opening price — seller is motivated, your offer sets the floor, not the list.
- Current owner paid $90k; 30% above their basis — modest negotiation headroom, anchor on the comps not their cost.
Risks & watch-outs
- Watch-outs: HOA is 21% of rent.
Questions for the listing agent
- Have any recent inspections been done? Can we get a copy of the seller's disclosures and any deferred-maintenance estimates?
- What does the HOA fee cover, when was the last increase, and are there any pending special assessments or reserve-fund shortfalls?
- Is there a deadline driving the sale (1031 exchange, divorce, estate, relocation)? That informs how much negotiation room exists.
- What's the average days-on-market for RENTAL listings here right now (not sales)? A rising rental-DOM trend means longer vacancies and softer asking-rent achievability than the comps imply.
- What's the recent tenant-quality profile in this submarket — average credit score on applications, eviction rate, late-payment / NSF rate, and stable-employment percentage? A property-management company in the area should have these aggregated.
- How much new for-sale + rental construction is in the pipeline within 1–3 miles? Heavy new supply typically softens prices + rents 12–24 months out; constrained supply supports both.
Investment metrics
- 1% rule
- 1.47% ✓
- Cap rate
- 8.18%
- Cash-on-cash
- 6.75%
- DSCR
- 1.30
- GRM
- 5.7
CMA / ARV
- ARV (median comp)
- $51,944
- List price
- $117,000
- Delta
- 140.65%
- Verdict
- OVERPRICED
- Comps
- 20 within 1.0 mi
Projected returns pro-forma
-3.0% appreciation · 3.0% rent growth · sell at horizon
- IRR
- -5.7%
- Equity multiple
- 0.79×
- Total profit
- $-6,974
- Equity at exit
- $17,445
- IRR
- 4.2%
- Equity multiple
- 1.31×
- Total profit
- $10,062
- Equity at exit
- $10,116
Cash invested: $32,760 (down + closing). Projections, not guarantees.
Landlord ↔ Tenant lean methodology
- Overall (STATE)
- 73 Landlord-Friendly
- State Ohio
- 73 Landlord-Friendly · R+6
- County
- — inherits STATE
- City
- — inherits STATE
ZIP-level market 43113
- Active inventory
- 121
- Price-to-rent
- 5.7×
Monthly cashflow live
- Estimated rent
- $1,725 medium interval (Pro) →
- Mortgage (P&I)
- −$614
- Tax est. 1.5%
- −$146 /mo · $1,755/yr
- Insurance
- −$49
- HOA
- −$370
- Vacancy / Maint / Mgmt
- −$362
- Net cashflow
- $184
Break-even live
UW: 25.0% down · 7.5% · 30yr · 1.5% tax · 5.0% vac · 8.0% maint · 8.0% mgmt
Financing live
Cash to close
- Down payment
- $29,250
- Closing costs
- $3,510
- Reserves months
- —
- Total cash needed
- —
Loan-product check · same deal, 3 products live
Conventional
25% down · 7.5% · 30yr
- Down + closing
- —
- Monthly P&I
- —
- Monthly cashflow
- —
- DSCR
- —
- Eligible?
- —
Personal DTI + credit; lowest rate.
DSCR
20% down · 8.5% · 30yr
- Down + closing
- —
- Monthly P&I
- —
- Monthly cashflow
- —
- DSCR
- —
- Eligible?
- —
No personal income docs; deal must DSCR.
Hard money
10% down · 12.0% · 12mo
- Down + closing
- —
- Monthly P&I
- —
- Monthly cashflow
- —
- DSCR
- —
- Eligible?
- —
Short-term bridge; refi at stabilization.
Rent comps 1 comps
| Address | Beds | Baths | Sqft | Rent | $/sqft | DOM | Units | Dist |
|---|---|---|---|---|---|---|---|---|
| 344 Watt St Circleville, OH | 3.0 | 2.0 | 1400 | $1,725 | $1.23 | 17d | 1 | 1.33mi |
HOA detail
- Monthly dues
- $370 · $4,440/yr
- Likely covers
- watersewertrashpool
Listing history 10 events
-
2026-06-18days on market $117,000 Active 5 DOM
-
2026-06-17days on market $117,000 Active 4 DOM
-
2026-06-16days on market $117,000 Active 3 DOM
-
2026-06-15days on market $117,000 Active 2 DOM
-
2026-06-14pricestatusdays on market $117,000 Active 1 DOM
-
2026-05-06historical
-
2026-04-20$125,000 Active
-
2024-04-04soldstatus $90,000 Closed 397-char remark
Show marketing remark (397 chars)
Just like new & move in ready. Only one couple has enjoyed this home for the last 3 years. Recently updated flooring. Great closet space & additional shed out back. You'll be surprised this spring to see the foliage come up in the flower bed. Sellers won best yard award last year. Pool, sewer, water & trash included in the $345 lot fee. Located close to stores and restaurants.
-
2024-03-25status Pending 397-char remark
Show marketing remark (397 chars)
Just like new & move in ready. Only one couple has enjoyed this home for the last 3 years. Recently updated flooring. Great closet space & additional shed out back. You'll be surprised this spring to see the foliage come up in the flower bed. Sellers won best yard award last year. Pool, sewer, water & trash included in the $345 lot fee. Located close to stores and restaurants.
-
2024-03-21$90,000 Active 397-char remark
Show marketing remark (397 chars)
Just like new & move in ready. Only one couple has enjoyed this home for the last 3 years. Recently updated flooring. Great closet space & additional shed out back. You'll be surprised this spring to see the foliage come up in the flower bed. Sellers won best yard award last year. Pool, sewer, water & trash included in the $345 lot fee. Located close to stores and restaurants.
ⓘ Source: listings_history table (triggers on properties + properties_extension) + one-shot
backfill from property_details.listing_events for pre-trigger history.
Nearby sold comps map
Loading sold comps map…
Walkable amenities ~0.75 mi
Loading nearby amenities…
Taxation est. · year 1
- Rental income
- $20,700
- − Mortgage interest
- −$6,554
- − Property taxes
- −$1,755
- − Insurance
- −$585
- − Repairs & maintenance
- −$1,656
- − Management
- −$1,656
- − HOA
- −$4,440
- − Depreciation
- −$3,404
- Taxable income
- $651
- Est. tax owed @ 24.0%
- −$156
- After-tax cash flow
- $2,054/yr
For passive investors: Depreciation is non-cash, so a rental often shows a tax loss while cash-flowing — sheltering income. Rental losses are passive: they offset passive income freely, and up to $25,000/yr can offset ordinary (W-2) income if you actively participate and your MAGI is under $100k (phasing out to $0 by $150k); unused losses carry forward. On sale, claimed depreciation is recaptured at up to 25%, and gains may owe capital-gains tax (a 1031 exchange can defer both). Figures are a year-1 estimate at your 24.0% rate — not tax advice; consult a CPA.
Condition & rehab AI · 12 photos
This mobile home requires moderate repairs and updates to its kitchen and bathrooms, as well as exterior painting and carpet replacement. These improvements would significantly increase its resale and rental value.
Repairs flagged
- Major Kitchen cabinets — Worn and dated
- Major Bathroom cabinets — Worn and dated
- Major Flooring — Worn and dated
Value-add opportunities
- Both Replace kitchen cabinets and flooring — Modernizing the kitchen would appeal to both buyers and renters
- Both Replace bathroom cabinets and flooring — Modernizing the bathrooms would appeal to both buyers and renters
- Both Paint exterior — Fresh paint would improve curb appeal and value
- Both Replace carpet — Fresh carpet would improve comfort and value
Renovation cost estimate screening
| Repair item | Severity | Est. cost |
|---|---|---|
| Kitchen cabinets · Worn and dated | Major | $15,000–50,000 |
| Bathroom cabinets · Worn and dated | Major | $15,000–50,000 |
| Flooring · Worn and dated | Major | $15,000–50,000 |
| Total estimated repair cost · 3 items | $45,000–150,000 |
Value-add ROI direction
- Both Replace kitchen cabinets and flooring — Modernizing the kitchen would appeal to both buyers and renters ↑
- Both Replace bathroom cabinets and flooring — Modernizing the bathrooms would appeal to both buyers and renters ↑
- Both Paint exterior — Fresh paint would improve curb appeal and value ↑
- Both Replace carpet — Fresh carpet would improve comfort and value ↑
ⓘ Cost ranges are severity-bucket heuristics (US national rule-of-thumb). Get contractor quotes + a written scope before underwriting a rehab budget.
Schools (NCES district)
- District
- Circleville City
- NCES district ID
- 3904376
- Math proficiency
- 37% ▼ -19.00%
- Reading proficiency
- 47% ▼ -11.00%
- Median HH income
- $39,318
- Composite
- 35.09/100
- National rank
- #5021
- State rank
- #533 of 656 in OH
Livability — Circleville
- Score
- 71/100
- State rank
- #437
- US rank
- #7237
Category grades
Schools grade is shown separately in the Schools card above.
Census & demographics
- Census place
- Circleville, OH
- County
- Pickaway · 57,589 people
- Metro
- Columbus, OH
- Population (ZIP)
- 24,314
- Household income
- $63,715
- Rent vs Own
- Severe rent burden
- 7.4
Population outlook (Pickaway County) Hauer SSP2
- Today (2025)
- 59,488 people
- By 2030
- 60,400 · +1.5%
- By 2040
- 61,498 · +3.4%
- By 2050
- 61,478 · +3.3%
- By 2075
- 59,696 · +0.3%
- By 2100
- 51,458 · -13.5%
Race, ethnicity, and origin ACS 2023
- Neighborhood character
- Predominantly White (94%)
- Race & ethnicity
- White 94% Two or more races 4% Black 1%
- Common ancestry
- Slovak 2% Romanian 2% Iranian 1%
- Foreign-born
- 0%
Political lean MEDSL · Pickaway
- 2024 margin
- Solid R (+48.5) · D 25.3% · R 73.8%
- 2008→2024 swing
- -26.8pp toward R · 2008: -21.7pp · 2024: -48.5pp
- All cycles
- 2024: R+48.5 2020: R+47.0 2016: R+42.6 2012: R+18.7 2008: R+21.7
Not yet ingested
- Civics
- —
Market trends
- HPI YoY
- ▼ -136.77%
- Current HPI
- 241.5556
- Rent YoY
- —
- Metro
- —
- State GDP YoY
- ▲ 1.98%
- F500 in state
- 48
Industry mix (Fortune 500 HQ in OH)
| Industry | F500 HQs | Revenue |
|---|---|---|
| Insurance | 3 | $145B |
|
||
| Industrial Machinery | 3 | $49B |
|
||
| Financial Services | 3 | $24B |
|
||
| Consumer Goods | 2 | $93B |
|
||
| Aerospace / Defense | 2 | $47B |
|
||
| Utilities | 2 | $33B |
|
||
Price history
+38.9% since first listed5 events — show timeline
- 2026-05-06 Listing Removed — CBRMLS
- 2026-04-20 Listed $125,000 CBRMLS
- 2024-04-04 Sold (MLS) $90,000 CBRMLS
- 2024-03-25 Pending — CBRMLS
- 2024-03-21 Listed $90,000 CBRMLS
Cash-flow waterfall
monthlySold comps — $/sqft
last 12 mo · ≤1 miLoading sold comps…