 🏢 Co-op
3333 Henry Hudson Pkwy Unit 18C · New York, NY
Flood risk 1/10 · Minimal
- FEMA flood zone
- X (unshaded)
- Chance of flooding over 30 yrs
- 0.0%
- Est. flood insurance / yr
- $507 – $1,088
Fire risk 1/10 · Minimal
- Est. fire insurance / yr
- $691 – $1,283
Heat risk 6/10 · Moderate
- Hot days now (above 99°F)
- 7 days/yr
- Hot days in 30 yrs
- 15 days/yr
Wind risk 6/10 · Moderate
- Chance of severe wind over 30 yrs
- 27.0%
Air-quality risk 3/10 · Minor
- Unhealthy air days now
- 3 days/yr
- Unhealthy air days in 30 yrs
- 4 days/yr
Risk factors via First Street. Map © Google.
Why this score? — see what drove the F grade
The composite is a weighted blend of 9 inputs, each scored 0–100. Each bar is that input's sub-score; the figure is the points it added to the 100-point composite (weight × sub-score).
- ARV discount +7.5/15.0
- Rent growth +5.0/5.0
- Schools +5.0/10.0
- Condition / age +4.0/5.0
- Livability +3.8/5.0
- 1% rule +3.3/10.0
- Cash flow +1.8/30.0
- DSCR +0.0/10.0
- Appreciation +0.0/10.0
$299,000
🖨 Deal sheet 📄 Offer letter ✓ Due diligence
Listing remarks MLS
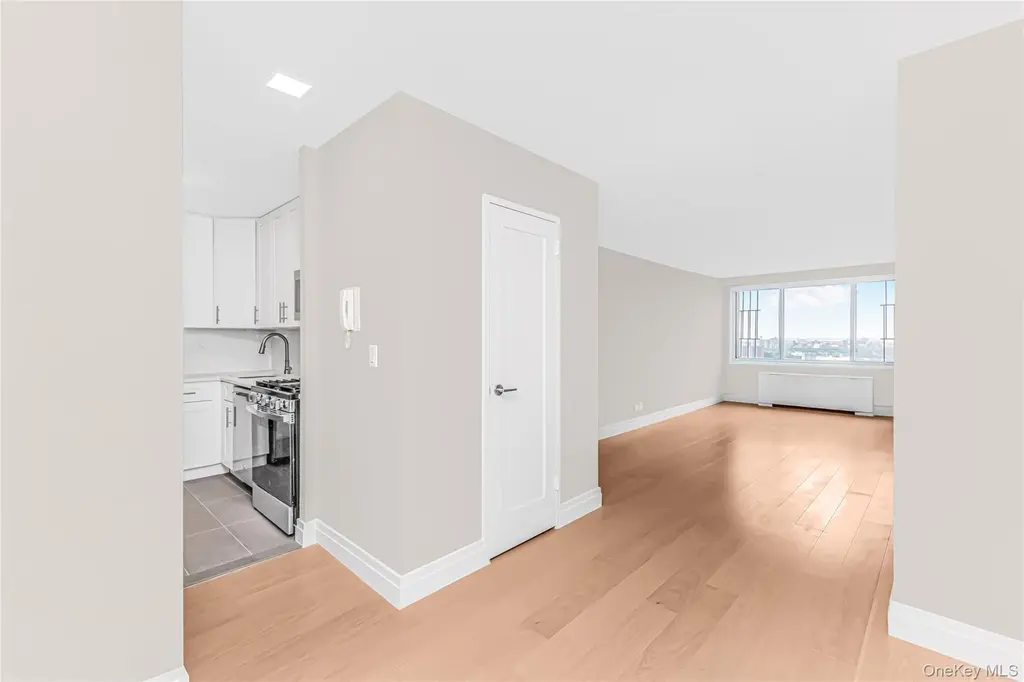
No Board Approval for this one bedroom, one bath at the sought after Whitehall. Separate kitchen, large living/dining area, lots of closets including 2 walk-ins, and central a/c. Eastern vista views. There is a monthly assessment of $194.29 through 12/2026. This full service co-op features a 24-hour doorman, live-in superintendent, on-site laundry room, dry cleaner/tailor, health club with indoor pool, gym, exercise classes of all kinds, and a magnificently designed landscaped outdoor green roof with waterfall, gazebo, fire pit, walking path, and sitting areas for relaxing. Washer/dryers are permitted in the apartment, indoor parking is available, and dogs are welcome. The Whitehall is located in central Riverdale close to shops, restaurants, transportation, parks, schools, and houses of worship. The Public Library, tennis courts and baseball fields at Seton Park are across the street. A 25 minute commute to NYC via Metro North and a 15 minute drive to midtown Manhattan makes this a truly special home in one of Riverdale's premiere buildings.
Key facts
- Lots of closets
- Separate kitchen
- Eastern vista views
Tags
Property features AI
Exterior
- Parking: Assigned parking available; Driveway access; Garage access; Off-street parking; On-street parking
- Utilities: Sewer described as other; Utilities: see remarks
- Home design: Stock cooperative property type; Entry at level 1
- Construction: Construction materials and foundation described as other
- Exterior features: No waterfront; Construction materials listed as other; Foundation details listed as other
Interior
- Kitchen: Appliances included (specifics not detailed)
- Bedrooms: Total of 3 rooms (bedroom count and individual room levels not specified)
- Flooring: Flooring details not specified
- Bathrooms: One full bathroom
- Heating & cooling: Central air conditioning; Baseboard heating; Additional heating type listed as other
- Interior features: Additional interior features noted (details available on request)
- Laundry & utility: Washer/dryer information not specified
Neighborhood map
What this means for you Summary
Snapshot
- This is a 1-bed/1.0-bath condo listed at $299k. Condition is rated good.
Deal economics
- At list price, monthly cash flow is $-1k ($-14k/yr) — negative.
- To cash-flow at today's rent, offer at most $284k (5.2% below list).
- To meet the 1% rule (rent ≥ 1% of price), the offer needs to be $248k (17.0% below list).
- Recommended offer: $248k (17.0% below list) — sets the bar for 1% rule.
- Cap rate 1.8% vs local median 2.6% in New York — below-typical yield; the buyer is paying a premium for something (appreciation thesis, condition, location) that the cap rate doesn't capture.
Location & tenants
- Location reads 75/100 on livability (#268 in NY, #4,188 nationally) — a middle-class / working-renter tenant base. Strengths: amenities A+, commute A+, health & safety A; Watch: crime F, cost of living F.
- Market conditions: Rents rising fast (+11.6%/yr); 342 active listings in the ZIP; 1 comparable units currently listed for rent nearby; 6,929 units permitted in Bronx County in 2024 (6,829 in 5+ unit buildings).
- This rent runs 40% of the median local income ($75k/yr) — at the standard rent-burdened threshold; future hikes will face affordability resistance.
Forward outlook
- Local home prices are declining (-3.0%/yr); year-one equity from $2k of loan paydown is wiped out by about $9k of value loss. Plan a longer hold.
- Bronx County population projected at +21% by 2050 — long-run rental-demand tailwind backs the buy-and-hold thesis.
Negotiation context
- It's been on market 21 days — a 2% lower offer ($295k) is reasonable based on typical stale-listing flexibility.
- 2 sale attempts with the ask held roughly flat each time — persistent listings suggest the price (not the market) is what's stuck; bring a comps-based counter.
Risks & watch-outs
- Watch-outs: HOA is 41% of rent.
- Climate carrying-cost: major wind risk, 27% chance of damaging wind over 30y; extreme-heat days projected 7→15/yr by 2055 (HVAC capex compounding) — expect insurance premiums to compound above CPI over the hold.
Questions for the listing agent
- What do current leases actually rent for vs. the listed asking? Can we see a recent rent roll and the last 12 months of T-12 income?
- Built in 1970 — when were the roof, HVAC, electrical panel, plumbing, and water heater last replaced?
- What does the HOA fee cover, when was the last increase, and are there any pending special assessments or reserve-fund shortfalls?
- Any open or pending special assessments — roof, HVAC, plumbing, elevator, façade? What's the per-unit balance and payoff schedule, and is the seller paying it off at close or rolling it to the buyer?
- Is there a deadline driving the sale (1031 exchange, divorce, estate, relocation)? That informs how much negotiation room exists.
- Schools are B-rated — typically a magnet for longer-tenancy family renters. What's the average tenant stay here, and is there a school-zone premium baked into asking?
- Crime grade is F in this area — have there been break-ins, vandalism, or insurance claims at this property in the last 3 years? What carrier currently insures it and at what premium?
- The area grade is low — what's the realistic commute time and amenity access for the typical tenant pool here? Any planned neighborhood developments (good or bad) we should know about?
- What's the average days-on-market for RENTAL listings here right now (not sales)? A rising rental-DOM trend means longer vacancies and softer asking-rent achievability than the comps imply.
- What's the recent tenant-quality profile in this submarket — average credit score on applications, eviction rate, late-payment / NSF rate, and stable-employment percentage? A property-management company in the area should have these aggregated.
- How much new apartment / multifamily construction is in the pipeline within 1–3 miles? Heavy new supply (>2% of stock underway) typically softens rents 12–24 months out; light construction supports rent growth.
Investment metrics
- 1% rule
- 0.83% ✗
- Cap rate
- 1.77%
- Cash-on-cash
- -16.14%
- DSCR
- 0.28
- GRM
- 10.0
CMA / ARV
No comps found within radius.
Projected returns pro-forma
-3.0% appreciation · 8.0% rent growth · sell at horizon
- IRR
- -37.8%
- Equity multiple
- -0.27×
- Total profit
- $-106,386
- Equity at exit
- $44,582
- IRR
- -21.5%
- Equity multiple
- -0.46×
- Total profit
- $-122,618
- Equity at exit
- $25,852
Cash invested: $83,720 (down + closing). Projections, not guarantees.
Landlord ↔ Tenant lean methodology
- Overall (CITY)
- 0 Strongly Tenant-Friendly
- State New York
- 15 Strongly Tenant-Friendly · D+10
- County
- — inherits STATE
- City New York
- 0 Strongly Tenant-Friendly · D+34
ZIP-level market 10463
- Rents YoY
- 11.6%
- Active inventory
- 342
- Price-to-rent
- 10.0×
Monthly cashflow live
- Estimated rent
- $2,480 medium interval (Pro) →
- Mortgage (P&I)
- −$1,568
- Tax est. 1.5%
- −$374 /mo · $4,485/yr
- Insurance
- −$125
- HOA est. from 1 same-building comp
- −$1,019
- Vacancy / Maint / Mgmt
- −$521
- Net cashflow
- $-1,126
Break-even live
UW: 25.0% down · 7.5% · 30yr · 1.5% tax · 5.0% vac · 8.0% maint · 8.0% mgmt
Financing live
Cash to close
- Down payment
- $74,750
- Closing costs
- $8,970
- Reserves months
- —
- Total cash needed
- —
Loan-product check · same deal, 3 products live
Conventional
25% down · 7.5% · 30yr
- Down + closing
- —
- Monthly P&I
- —
- Monthly cashflow
- —
- DSCR
- —
- Eligible?
- —
Personal DTI + credit; lowest rate.
DSCR
20% down · 8.5% · 30yr
- Down + closing
- —
- Monthly P&I
- —
- Monthly cashflow
- —
- DSCR
- —
- Eligible?
- —
No personal income docs; deal must DSCR.
Hard money
10% down · 12.0% · 12mo
- Down + closing
- —
- Monthly P&I
- —
- Monthly cashflow
- —
- DSCR
- —
- Eligible?
- —
Short-term bridge; refi at stabilization.
Rent comps 1 comps
| Address | Beds | Baths | Sqft | Rent | $/sqft | DOM | Units | Dist |
|---|---|---|---|---|---|---|---|---|
| 2600 Netherland Ave Bronx, NY | 1.0–3.0 | 1.0–2.5 | 1132 | $2,775 | $2.45 | 22d | 3 | 0.50mi |
HOA detail condo
- Monthly dues
- $0 · $0/yr
- Likely covers
- waterpoolgymdoorman
- Assessments
- None detected in remarks — confirm with the listing agent.
Listing history 13 events
-
2026-06-18days on market $299,000 Active 21 DOM
-
2026-06-17days on market $299,000 Active 20 DOM
-
2026-06-16days on market $299,000 Active 19 DOM
-
2026-06-15days on market $299,000 Active 18 DOM
-
2026-06-13days on market $299,000 Active 16 DOM
-
2026-06-10days on market $299,000 Active 12 DOM
-
2026-06-08days on market $299,000 Active 11 DOM
-
2026-06-08days on market $299,000 Active 10 DOM
-
2026-06-04days on market $299,000 Active 7 DOM
-
2026-06-03days on market $299,000 Active 6 DOM
-
2026-06-02days on market $299,000 Active 5 DOM
-
2026-06-01days on market $299,000 Active 4 DOM
-
2026-05-31days on market $299,000 Active 3 DOM
ⓘ Source: listings_history table (triggers on properties + properties_extension) + one-shot
backfill from property_details.listing_events for pre-trigger history.
Climate risk First Street
- Flood 1/10 Low FEMA zone X (unshaded) · 0% chance over 30 yrs
- Wildfire 1/10 Low
- Heat 6/10 Major 7 d/yr ≥99°F today · 15 d/yr by 30 yrs out
- Wind 6/10 Major 27% chance of damaging wind over 30 yrs
- Air quality 3/10 Moderate 3 unhealthy d/yr today · 4 by 30 yrs out
Nearby sold comps map
Loading sold comps map…
Walkable amenities ~0.75 mi
Loading nearby amenities…
Taxation est. · year 1
- Rental income
- $29,764
- − Mortgage interest
- −$16,749
- − Property taxes
- −$4,485
- − Insurance
- −$1,495
- − Repairs & maintenance
- −$2,381
- − Management
- −$2,381
- − HOA
- −$12,228
- − Depreciation
- −$8,698
- Taxable loss
- −$18,653
- Est. tax savings @ 24.0%
- +$4,477
- After-tax cash flow
- $-9,034/yr
For passive investors: Depreciation is non-cash, so a rental often shows a tax loss while cash-flowing — sheltering income. Rental losses are passive: they offset passive income freely, and up to $25,000/yr can offset ordinary (W-2) income if you actively participate and your MAGI is under $100k (phasing out to $0 by $150k); unused losses carry forward. On sale, claimed depreciation is recaptured at up to 25%, and gains may owe capital-gains tax (a 1031 exchange can defer both). Figures are a year-1 estimate at your 24.0% rate — not tax advice; consult a CPA.
Condition & rehab AI · 8 photos
This one-bedroom condo is in good condition with modern amenities and a good location. It is ready for move-in and would benefit from some landscaping and furniture to enhance its value.
Value-add opportunities
- Both landscaping — enhances curb appeal and adds value
- Both furniture — improves living space and makes it move-in ready
Renovation cost estimate screening
Value-add ROI direction
- Both landscaping — enhances curb appeal and adds value ↑
- Both furniture — improves living space and makes it move-in ready ↑
ⓘ Cost ranges are severity-bucket heuristics (US national rule-of-thumb). Get contractor quotes + a written scope before underwriting a rehab budget.
Schools (NCES district)
No district data.
Livability — New York
- Score
- 75/100
- State rank
- #268
- US rank
- #4188
Category grades
Schools grade is shown separately in the Schools card above.
Census & demographics
- Census place
- New York, NY
- County
- Bronx County · 1,197,324 people
- City population
- 7,731,280
- Metro
- New York-Newark-Jersey City, NY-NJ-PA
- Population (ZIP)
- 69,470
- Household income
- $74,974
- Rent vs Own
- Severe rent burden
- 5586.0
Population outlook (Bronx County) Hauer SSP2
- Today (2025)
- 1,607,353 people
- By 2030
- 1,681,852 · +4.6%
- By 2040
- 1,824,421 · +13.5%
- By 2050
- 1,945,470 · +21.0%
- By 2075
- 2,187,887 · +36.1%
- By 2100
- 2,244,136 · +39.6%
Race, ethnicity, and origin ACS 2023
- Neighborhood character
- Diverse neighborhood (Simpson 0.65)
- Race & ethnicity
- Hispanic / Latino 50% White 30% Two or more races 17% Black 12% Asian 4% Native American 2%
- Hispanic origin (detail)
- Mexican 3% Puerto Rican 12% Cuban 1% Dominican 25%
- Common ancestry
- Scotch-Irish 3% Romanian 2% Lithuanian 1%
- Foreign-born
- 30% · Canada, Jamaica, China
- Languages at home
- 50% English-only · Spanish 40% Other Indo-European 3% Russian/Polish/Slavic 2%
Political lean MEDSL · Bronx
- 2024 margin
- Solid D (+45.4) · D 72.7% · R 27.3%
- 2008→2024 swing
- -32.3pp toward R · 2008: 77.8pp · 2024: 45.4pp
- All cycles
- 2024: D+45.4 2020: D+67.6 2016: D+79.1 2012: D+82.9 2008: D+77.8
Not yet ingested
- Civics
- —
Market trends
- HPI YoY
- ▼ -294.75%
- Current HPI
- 168.0211
- Rent YoY
- ▲ 11.60%
- Metro
- New York-Newark-Jersey City, NY-NJ-PA
- State GDP YoY
- ▲ 2.60%
- F500 in state
- 92
Industry mix (Fortune 500 HQ in NY)
| Industry | F500 HQs | Revenue |
|---|---|---|
| Financial Services | 10 | $950B |
|
||
| Consumer Goods | 9 | $162B |
|
||
| Insurance | 4 | $225B |
|
||
| Telecommunications | 2 | $144B |
|
||
| Pharmaceuticals | 2 | $112B |
|
||
| Media / Entertainment | 2 | $69B |
|
||
Price history
+0.0% since first listed2 events — show timeline
- 2026-05-28 Listed $299,000 OneKey® MLS as Distributed by MLS Grid
- 2026-05-28 Listed $299,000 RLS at REBNY
Cash-flow waterfall
monthlySold comps — $/sqft
last 12 mo · ≤1 miLoading sold comps…