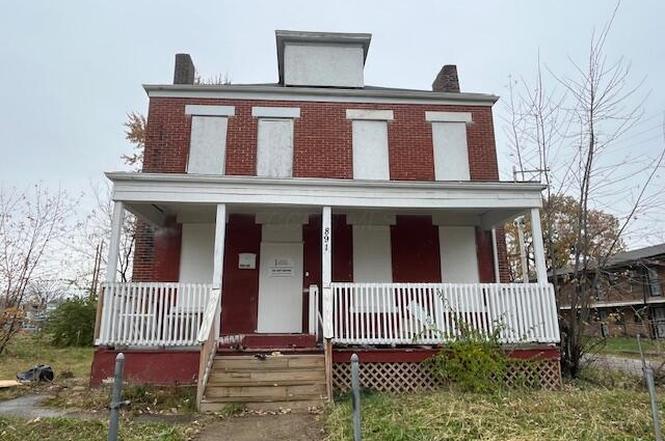
891 E Mound St · Columbus, OH
Flood risk 1/10 · Minimal
- FEMA flood zone
- X (unshaded)
- Chance of flooding over 30 yrs
- 0.0%
- Est. flood insurance / yr
- $473 – $860
Fire risk 1/10 · Minimal
- Est. fire insurance / yr
- $713 – $1,323
Heat risk 4/10 · Minor
- Hot days now (above 100°F)
- 7 days/yr
- Hot days in 30 yrs
- 18 days/yr
Wind risk 2/10 · Minimal
- Chance of severe wind over 30 yrs
- 1.0%
Air-quality risk 3/10 · Minor
- Unhealthy air days now
- 2 days/yr
- Unhealthy air days in 30 yrs
- 4 days/yr
Risk factors via First Street. Map © Google.
Why this score? — see what drove the B- grade
The composite is a weighted blend of 9 inputs, each scored 0–100. Each bar is that input's sub-score; the figure is the points it added to the 100-point composite (weight × sub-score).
- Cash flow +30.0/30.0
- 1% rule +10.0/10.0
- DSCR +10.0/10.0
- ARV discount +7.5/15.0
- Livability +4.0/5.0
- Rent growth +2.9/5.0
- Condition / age +2.5/5.0
- Schools +1.7/10.0
- Appreciation +0.0/10.0
$110,000
🖨 Deal sheet 📄 Offer letter ✓ Due diligence
Listing remarks
THE REALTOR IS THE RECEIVER APPOINTED BY THE FRANKLIN COUNTY MUNICIPAL COURT, ENVIRONMENTAL DIVISION. The buyer must provide the Receiver with a rehabilitation plan, project timeline, and proof of funds when making an offer on the property and will be responsible for abating the code violations. The accepted contract is subject to court review/ approval and will not be a quick close. This property has exterior code violations need to be resolved. The Receiver requests for in-state buyers only.
Key facts
- 9,583 sq ft lot
- Built 1895
- Listed 120 days
Neighborhood map
What this means for you Summary
Snapshot
- This is a 4-bed/2.0-bath single-family listed at $110k.
Deal economics
- At list price, monthly cash flow is $705 ($8k/yr) — positive.
- The deal already cash-flows at list — no discount required.
- Meets the 1% rule at list price ($2k rent vs $110k).
- Recommended offer: $100k (9.0% below list) — sets the bar for market timing.
- Cap rate 14.0% vs local median 3.8% in Columbus — top-decile yield for the area; either an underpriced asset or a hidden risk that comps aren't pricing in. Stress-test before assuming the spread holds.
Location & tenants
- Location reads 81/100 on livability (#97 in OH, #1,491 nationally) — a professional / high-income tenant draw. Strengths: commute A+, cost of living A+, housing A+; Watch: employment C-, crime F.
- Columbus City School District (urban): math 15% / reading 26% proficiency, ranked #626 of 656 in OH (top 95%) — low school quality limits family demand, transient renter base, plan for 1-2y turnover; 72% free/reduced lunch — lower-income household profile, screen leases tightly.
- Market conditions: Rents rising (+1.4%/yr); 142 active listings in the ZIP; 40 comparable units currently listed for rent nearby; rentals at typical pace (median 24d on market — plan ~3-4 weeks tenant-placement turnaround); 40% of comp listings sitting > 30 days — soft ceiling on asking rent; 8,139 units permitted in Franklin County in 2024 (5,940 in 5+ unit buildings).
- This rent runs 41% of the median local income ($60k/yr) — at the standard rent-burdened threshold; future hikes will face affordability resistance.
Forward outlook
- Local home prices are declining (-3.0%/yr); year-one equity from $761 of loan paydown is wiped out by about $3k of value loss. Plan a longer hold.
- Franklin County population projected at +34% by 2050 — long-run rental-demand tailwind backs the buy-and-hold thesis.
- At projected returns (-3.0% appreciation + 1.4% rent growth), your $31k cash investment doubles in ~5 years — after that, you're playing with house money.
Negotiation context
- It's been on market 120 days — a 9% lower offer ($100k) is reasonable based on typical stale-listing flexibility.
Risks & watch-outs
- Watch-outs: property tax is 3.0% of price; built in 1895 — expect roof / HVAC / electrical / plumbing capex.
Questions for the listing agent
- It's been on market 120 days. Have you received any prior offers? Is the seller open to a 9% concession, seller financing, or rate buy-down credit?
- Built in 1895 — when were the roof, HVAC, electrical panel, plumbing, and water heater last replaced?
- Property tax is high relative to price — has the assessment been appealed recently, and will the sale trigger a re-assessment?
- Why hasn't it sold? Are there any deal-killer items the seller is aware of (foundation, flood, title, zoning, code violations)?
- Is there a deadline driving the sale (1031 exchange, divorce, estate, relocation)? That informs how much negotiation room exists.
- Crime grade is F in this area — have there been break-ins, vandalism, or insurance claims at this property in the last 3 years? What carrier currently insures it and at what premium?
- What's the average days-on-market for RENTAL listings here right now (not sales)? A rising rental-DOM trend means longer vacancies and softer asking-rent achievability than the comps imply.
- What's the recent tenant-quality profile in this submarket — average credit score on applications, eviction rate, late-payment / NSF rate, and stable-employment percentage? A property-management company in the area should have these aggregated.
- How much new for-sale + rental construction is in the pipeline within 1–3 miles? Heavy new supply typically softens prices + rents 12–24 months out; constrained supply supports both.
Investment metrics
- 1% rule
- 1.85% ✓
- Cap rate
- 13.98%
- Cash-on-cash
- 27.47%
- DSCR
- 2.22
- GRM
- 4.5
CMA / ARV
- ARV (on-the-fly)
- $382,974
- Comps found
- 12
Show comp detail 12 sales within ~0.75 mi
| Address | Dist | Beds/Ba | Sqft | Sold | Price | $/sf | Match |
|---|---|---|---|---|---|---|---|
| 827 S 22nd St | 0.60mi | 4/3.0 | 1,777 (-1%) | 1mo | $300,000 | $169 | 66 |
| 1046 E Cherry St | 0.26mi | 3/2.5 (-1) | 1,582 (-12%) | 0mo | $302,500 | $191 | 61 |
| 567 Linwood Ave | 0.53mi | 4/2.5 | 1,956 (+9%) | 2mo | $637,000 | $326 | 57 |
| 935 S Ohio Ave | 0.75mi | 4/2.5 | 1,735 (-4%) | 1mo | $330,000 | $190 | 57 |
| 834 S 22nd St | 0.61mi | 3/2.5 (-1) | 1,894 (+5%) | 0mo | $380,000 | $201 | 56 |
| 70 S Champion Ave | 0.64mi | 3/1.5 (-1) | 1,729 (-4%) | 2mo | $389,000 | $225 | 55 |
| 675 Oakwood Ave | 0.47mi | 3/1.0 (-1) | 1,631 (-9%) | 1mo | $153,000 | $94 | 53 |
| 758 S 18th St | 0.53mi | 3/2.5 (-1) | 1,646 (-8%) | 1mo | $350,000 | $213 | 53 |
| 530 E Beck St | 0.62mi | 3/2.5 (-1) | 1,658 (-8%) | 1mo | $599,900 | $362 | 50 |
| 795 S Ohio Ave | 0.56mi | 3/2.5 (-1) | 1,535 (-15%) | 2mo | $340,000 | $221 | 41 |
| 831 Wilson Ave | 0.68mi | 3/2.5 (-1) | 1,586 (-12%) | 2mo | $292,500 | $184 | 40 |
| 362 Loeffler Ave | 0.75mi | 3/2.5 (-1) | 1,568 (-13%) | 2mo | $420,000 | $268 | 35 |
Match score weights: distance 35% · size 25% · config 20% · recency 20%. Top-matched comps best support the ARV.
Projected returns pro-forma
-3.0% appreciation · 1.43% rent growth · sell at horizon
- IRR
- 19.6%
- Equity multiple
- 1.78×
- Total profit
- $24,031
- Equity at exit
- $16,401
- IRR
- 26.7%
- Equity multiple
- 3.16×
- Total profit
- $66,651
- Equity at exit
- $9,511
Cash invested: $30,800 (down + closing). Projections, not guarantees.
Landlord ↔ Tenant lean methodology
- Overall (STATE)
- 73 Landlord-Friendly
- State Ohio
- 73 Landlord-Friendly · R+6
- County
- — inherits STATE
- City
- — inherits STATE
ZIP-level market 43205
- Rents YoY
- 1.4%
- Active inventory
- 142
- Price-to-rent
- 4.5×
Monthly cashflow live
- Estimated rent
- $2,032 high interval (Pro) →
- Mortgage (P&I)
- −$577
- Tax from tax record
- −$277 /mo · $3,329/yr
- Insurance
- −$46
- HOA
- −$0
- Vacancy / Maint / Mgmt
- −$427
- Net cashflow
- $705
Break-even live
UW: 25.0% down · 7.5% · 30yr · 1.5% tax · 5.0% vac · 8.0% maint · 8.0% mgmt
Financing live
Cash to close
- Down payment
- $27,500
- Closing costs
- $3,300
- Reserves months
- —
- Total cash needed
- —
Loan-product check · same deal, 3 products live
Conventional
25% down · 7.5% · 30yr
- Down + closing
- —
- Monthly P&I
- —
- Monthly cashflow
- —
- DSCR
- —
- Eligible?
- —
Personal DTI + credit; lowest rate.
DSCR
20% down · 8.5% · 30yr
- Down + closing
- —
- Monthly P&I
- —
- Monthly cashflow
- —
- DSCR
- —
- Eligible?
- —
No personal income docs; deal must DSCR.
Hard money
10% down · 12.0% · 12mo
- Down + closing
- —
- Monthly P&I
- —
- Monthly cashflow
- —
- DSCR
- —
- Eligible?
- —
Short-term bridge; refi at stabilization.
Rent comps 40 comps
| Address | Beds | Baths | Sqft | Rent | $/sqft | DOM | Units | Dist |
|---|---|---|---|---|---|---|---|---|
| 965 E Rich St Unit 965 Columbus, OH | 3.0 | 1.0 | 2184 | $1,600 | $0.73 | 23d | 1 | 0.22mi |
| 741-743 E Mound St Columbus, OH | 3.0 | 1.5 | 1528 | $1,645 | $1.08 | 7d | 1 | 0.23mi |
| 741-743 E Mound St Columbus, OH | 3.0 | 1.5 | 1528 | $1,645 | $1.08 | 43d | 1 | 0.23mi |
| 438 S Ohio Ave Columbus, OH | 5.0 | 2.0 | 1900 | $2,195 | $1.16 | 43d | 1 | 0.23mi |
| 648 Carpenter St Unit Nch Columbus, OH | 3.0 | 1.5 | 1392 | $1,475 | $1.06 | 23d | 1 | 0.31mi |
| 648 Carpenter St Unit Nch Columbus, OH | 3.0 | 1.5 | 1392 | $1,475 | $1.06 | 2d | 1 | 0.31mi |
| 461 Oakwood Ave Columbus, OH | 3.0 | 1.5 | 1386 | $1,845 | $1.33 | 43d | 1 | 0.34mi |
| 282-284 S Ohio Ave Columbus, OH | 3.0 | 2.0 | 1477 | $1,699 | $1.15 | 23d | 1 | 0.35mi |
| 173 S 18th St Columbus, OH | 3.0 | 2.5 | 1884 | $2,649 | $1.41 | 23d | 1 | 0.37mi |
| 698 S 22nd St Columbus, OH | 3.0 | 3.5 | 2400 | $2,500 | $1.04 | 43d | 1 | 0.38mi |
| 627 Oakwood Ave Columbus, OH | 3.0 | 2.5 | 2009 | $2,379 | $1.18 | 12d | 1 | 0.40mi |
| 685 S Champion Ave Unit 683 Columbus, OH | 3.0 | 1.0 | 1364 | $1,575 | $1.15 | 21d | 1 | 0.41mi |
| 890 E Livingston Ave #892 Columbus, OH | 3.0 | 1.0 | 2430 | $1,400 | $0.58 | 12d | 1 | 0.41mi |
| 1117-1119 Franklin Ave Columbus, OH | 3.0 | 1.0 | 1288 | $1,525 | $1.18 | 43d | 1 | 0.46mi |
| 663-665 Ann St Columbus, OH | 3.0 | 1.0 | 1260 | $1,299 | $1.03 | 17d | 1 | 0.47mi |
| 668 Wager St Columbus, OH | 3.0 | 2.0 | 1492 | $2,095 | $1.40 | 20d | 1 | 0.51mi |
| 730-732 Oakwood Ave Unit 732 Columbus, OH | 3.0 | 1.0 | 1232 | $1,425 | $1.16 | 43d | 1 | 0.51mi |
| 848 Oak St Columbus, OH | 3.0 | 1.5 | 1428 | $1,700 | $1.19 | 43d | 1 | 0.52mi |
| 844-848 Oak St Unit 848 Columbus, OH | 3.0 | 1.5 | 1517 | $1,700 | $1.12 | 43d | 1 | 0.52mi |
| 834 Oak St Unit 834 Columbus, OH | 3.0 | 2.5 | 1450 | $2,500 | $1.72 | 20d | 1 | 0.53mi |
| 122 Parsons Ave Columbus, OH | 3.0 | 1.0–2.0 | 1135 | $2,550 | $2.25 | 1d | 10 | 0.53mi |
| 834 Oak St Columbus, OH | 3.0 | 2.5 | 1400 | $2,500 | $1.79 | 7d | 1 | 0.53mi |
| 830 Oak St Unit 830 Columbus, OH | 3.0 | 2.5 | 1450 | $2,500 | $1.72 | 20d | 1 | 0.53mi |
| 830 Oak St Columbus, OH | 3.0 | 2.5 | 1451 | $2,500 | $1.72 | 7d | 1 | 0.53mi |
| 814 S Ohio Ave Columbus, OH | 3.0 | 1.0 | 1380 | $1,600 | $1.16 | 43d | 1 | 0.56mi |
| 555 Kimball Pl Columbus, OH | 3.0 | 2.5 | 1252 | $1,785 | $1.43 | 43d | 1 | 0.60mi |
| 143 Sherman Ave Unit 301 Columbus, OH | 3.0 | 2.0 | 1630 | $2,450 | $1.50 | 1d | 1 | 0.62mi |
| 813 Wilson Ave Unit 1 Columbus, OH | 3.0 | 1.5 | 1400 | $1,500 | $1.07 | 7d | 1 | 0.62mi |
| 815 Wilson Ave Columbus, OH | 3.0 | 1.5 | 1400 | $1,500 | $1.07 | 7d | 1 | 0.63mi |
| 857 Wilson Ave #859 Columbus, OH | 3.0 | 2.5 | 1527 | $1,650 | $1.08 | 43d | 1 | 0.67mi |
| 705 E Columbus St Columbus, OH | 3.0 | 1.0 | 1436 | $2,300 | $1.60 | 43d | 1 | 0.69mi |
| 936 Wagner St Columbus, OH | 3.0 | 3.0 | 1560 | $2,750 | $1.76 | 23d | 1 | 0.72mi |
| 977 S Ohio Ave Columbus, OH | 3.0 | 2.5 | 1650 | $2,500 | $1.52 | 43d | 1 | 0.77mi |
| 883 Studer Ave Columbus, OH | 4.0 | 2.5 | 2217 | $2,500 | $1.13 | 1d | 1 | 0.77mi |
| 746 Beech St Columbus, OH | 3.0 | 2.0 | 1610 | $2,750 | $1.71 | 43d | 1 | 0.78mi |
| 966 S 18th St Columbus, OH | 3.0 | 1.5 | 1428 | $2,400 | $1.68 | 43d | 1 | 0.81mi |
| 630 Stanley Ave Columbus, OH | 3.0 | 1.0 | 1300 | $1,949 | $1.50 | 23d | 1 | 0.81mi |
| 932 Linwood Ave Columbus, OH | 4.0 | 1.5 | 1663 | $2,045 | $1.23 | 43d | 1 | 0.81mi |
| 904 Studer Ave Columbus, OH | 3.0 | 1.5 | 1364 | $1,780 | $1.30 | 23d | 1 | 0.81mi |
| 997 Oakwood Ave Columbus, OH | 3.0 | 1.5 | 1260 | $1,800 | $1.43 | 12d | 1 | 0.82mi |
Listing history 7 events
-
2026-04-01status Pending
-
2026-03-04price $110,000
-
2026-02-06price $120,000
-
2026-01-16price $130,000
-
2026-01-06price $140,000
-
2025-12-09price $160,000
-
2025-12-02$180,000 Active
ⓘ Source: listings_history table (triggers on properties + properties_extension) + one-shot
backfill from property_details.listing_events for pre-trigger history.
Tax reassessment forecast OH · Partial reset (capped growth)
- Current annual tax
- $3,329 · $277/mo
- Projected year-2 tax
- $3,329 · $277/mo
- Expected delta
- $0/yr ($0/mo · 0.0%)
ⓘ Screening estimate from a state-policy table — verify with the county assessor before closing.
Climate risk First Street
- Flood 1/10 Low FEMA zone X (unshaded) · 0% chance over 30 yrs
- Wildfire 1/10 Low
- Heat 4/10 Moderate 7 d/yr ≥100°F today · 18 d/yr by 30 yrs out
- Wind 2/10 Low 100% chance of damaging wind over 30 yrs
- Air quality 3/10 Moderate 2 unhealthy d/yr today · 4 by 30 yrs out
Nearby sold comps map
Loading sold comps map…
Walkable amenities ~0.75 mi
Loading nearby amenities…
Taxation est. · year 1
- Rental income
- $24,380
- − Mortgage interest
- −$6,162
- − Property taxes
- −$3,329
- − Insurance
- −$550
- − Repairs & maintenance
- −$1,950
- − Management
- −$1,950
- − Depreciation
- −$3,200
- Taxable income
- $7,239
- Est. tax owed @ 24.0%
- −$1,737
- After-tax cash flow
- $6,722/yr
For passive investors: Depreciation is non-cash, so a rental often shows a tax loss while cash-flowing — sheltering income. Rental losses are passive: they offset passive income freely, and up to $25,000/yr can offset ordinary (W-2) income if you actively participate and your MAGI is under $100k (phasing out to $0 by $150k); unused losses carry forward. On sale, claimed depreciation is recaptured at up to 25%, and gains may owe capital-gains tax (a 1031 exchange can defer both). Figures are a year-1 estimate at your 24.0% rate — not tax advice; consult a CPA.
Schools (NCES district)
- District
- Columbus City School District
- NCES district ID
- 3904380
- Math proficiency
- 15% ▼ -17.00%
- Reading proficiency
- 26% ▼ -12.00%
- Median HH income
- $38,483
- Composite
- 17.19/100
- National rank
- #9105
- State rank
- #626 of 656 in OH
Livability — Columbus
- Score
- 81/100
- State rank
- #97
- US rank
- #1491
Category grades
Schools grade is shown separately in the Schools card above.
Census & demographics
- Census place
- Columbus, OH
- County
- Franklin County · 1,351,780 people
- City population
- 612,189
- Metro
- Columbus, OH
- Population (ZIP)
- 12,618
- Household income
- $60,181
- Rent vs Own
- Severe rent burden
- 823.0
Population outlook (Franklin County) Hauer SSP2
- Today (2025)
- 1,456,139 people
- By 2030
- 1,556,890 · +6.9%
- By 2040
- 1,757,349 · +20.7%
- By 2050
- 1,950,539 · +34.0%
- By 2075
- 2,376,171 · +63.2%
- By 2100
- 2,636,796 · +81.1%
Race, ethnicity, and origin ACS 2023
- Neighborhood character
- Diverse neighborhood (Simpson 0.60)
- Race & ethnicity
- Black 47% White 42% Two or more races 7% Hispanic / Latino 3% Asian 1%
- Common ancestry
- Lithuanian 2% Slovak 2% Romanian 2%
- Foreign-born
- 3% · Canada
- Languages at home
- 95% English-only · Spanish 1% Other Asian/Pacific 1% Other Indo-European 1%
Political lean MEDSL · Franklin
- 2024 margin
- Strong D (+28.4) · D 63.7% · R 35.3% · Other 1.0%
- 2008→2024 swing
- +7.7pp toward D · 2008: 20.7pp · 2024: 28.4pp
- All cycles
- 2024: D+28.4 2020: D+31.4 2016: D+25.9 2012: D+21.7 2008: D+20.7
Not yet ingested
- Civics
- —
Market trends
- HPI YoY
- ▼ -282.36%
- Current HPI
- 212.5692
- Rent YoY
- ▲ 1.43%
- Metro
- Columbus, OH
- State GDP YoY
- ▲ 1.98%
- F500 in state
- 48
Industry mix (Fortune 500 HQ in OH)
| Industry | F500 HQs | Revenue |
|---|---|---|
| Insurance | 3 | $145B |
|
||
| Industrial Machinery | 3 | $49B |
|
||
| Financial Services | 3 | $24B |
|
||
| Consumer Goods | 2 | $93B |
|
||
| Aerospace / Defense | 2 | $47B |
|
||
| Utilities | 2 | $33B |
|
||
Price history
-38.9% since first listed7 events — show timeline
- 2026-04-01 Pending — CBRMLS
- 2026-03-04 Price Changed $110,000 CBRMLS
- 2026-02-06 Price Changed $120,000 CBRMLS
- 2026-01-16 Price Changed $130,000 CBRMLS
- 2026-01-06 Price Changed $140,000 CBRMLS
- 2025-12-09 Price Changed $160,000 CBRMLS
- 2025-12-02 Listed $180,000 CBRMLS
Property tax history
+10.7%/yrLatest (2024): $3,329 · -4.6% YoY. Source: county tax records.
Cash-flow waterfall
monthlySold comps — $/sqft
last 12 mo · ≤1 miLoading sold comps…