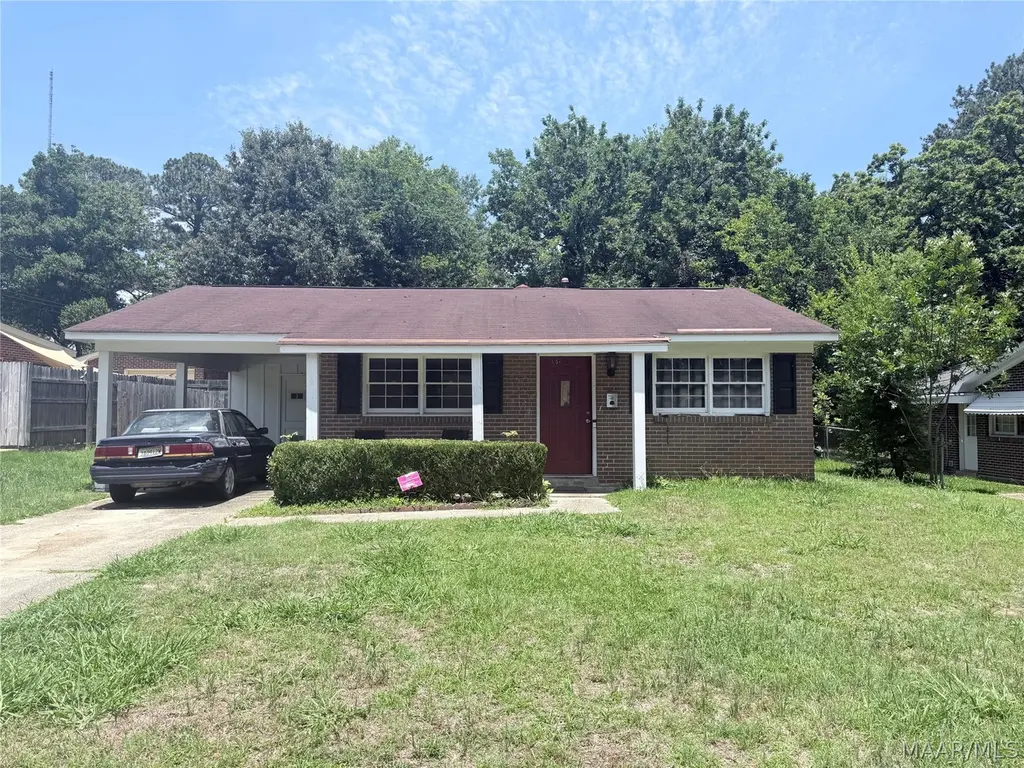
3351 Habersham Rd · Montgomery, AL
Flood risk 1/10 · Minimal
- FEMA flood zone
- X (unshaded)
- Chance of flooding over 30 yrs
- 0.0%
- Est. flood insurance / yr
- $507 – $1,088
Fire risk 3/10 · Minor
- Est. fire insurance / yr
- $916 – $1,700
Heat risk 7/10 · Major
- Hot days now (above 107°F)
- 7 days/yr
- Hot days in 30 yrs
- 20 days/yr
Wind risk 8/10 · Major
- Chance of severe wind over 30 yrs
- 80.0%
Air-quality risk 3/10 · Minor
- Unhealthy air days now
- 4 days/yr
- Unhealthy air days in 30 yrs
- 4 days/yr
Risk factors via First Street. Map © Google.
Why this score? — see what drove the C grade
The composite is a weighted blend of 9 inputs, each scored 0–100. Each bar is that input's sub-score; the figure is the points it added to the 100-point composite (weight × sub-score).
- Cash flow +29.1/30.0
- DSCR +10.0/10.0
- 1% rule +6.9/10.0
- Rent growth +3.2/5.0
- Livability +3.2/5.0
- Condition / age +2.5/5.0
- Schools +1.7/10.0
- ARV discount +0.0/15.0
- Appreciation +0.0/10.0
$110,000
🖨 Deal sheet 📄 Offer letter ✓ Due diligence
Listing remarks
Step into timeless charm with this beautifully maintained older home, where classic character meets everyday comfort. Warm and inviting atmosphere with a layout for a relaxing time in your new home that is ready for its next chapter! Updates are as follows: 2020 NEW plumbing in bathroom walls with NEW tile and new flooring in the kitchen 2023 NEW Privacy fence connecting to the house and NEW electrical panel and line ran from home to power pole 2024 NEW AC Unit 2025 NEW Water heater. It is literally move in ready!
Key facts
- New privacy fence
- New ac unit
- New plumbing
Tags
Property features AI
Exterior
- Parking: Attached carport; Driveway; 1-car carport
- Utilities: Public water; Public sewer; Electric service
- Home design: Single-story property
- Construction: Block and concrete construction; Slab foundation; Built (year from public records)
- Exterior features: Front porch; City lot
Interior
- Bedrooms: Bedroom(s) located on the first level
- Flooring: Plank; Vinyl; Wood
- Bathrooms: 1 full bathroom
- Heating & cooling: Central heating (electric); Central air conditioning (electric)
- Interior features: Plank, vinyl, and wood flooring; Gas water heater
Neighborhood map
What this means for you Summary
Snapshot
- This is a 3-bed/1.0-bath single-family listed at $110k.
Deal economics
- At list price, monthly cash flow is $379 ($5k/yr) — positive.
- The deal already cash-flows at list — no discount required.
- Meets the 1% rule at list price ($1k rent vs $110k).
- Cap rate 10.4% vs local median 6.0% in Montgomery — top-decile yield for the area; either an underpriced asset or a hidden risk that comps aren't pricing in. Stress-test before assuming the spread holds.
Location & tenants
- Location reads 65/100 on livability (#138 in AL) — a middle-class / working-renter tenant base. Strengths: cost of living A+, housing A+; Watch: schools C-, employment D, crime F.
- Montgomery County (urban): math 9% / reading 31% proficiency, ranked #106 of 129 in AL (top 82%) — low school quality limits family demand, transient renter base, plan for 1-2y turnover; 70% free/reduced lunch — lower-income household profile, screen leases tightly.
- Market conditions: Rents rising (+2.6%/yr); 207 active listings in the ZIP; 40 comparable units currently listed for rent nearby; rentals lingering (median 44d on market — plan ~5-8 weeks vacancy on turnover, expect pricing pressure); 52% of comp listings sitting > 30 days — soft ceiling on asking rent; 460 units permitted in Montgomery County in 2024 (37 in 5+ unit buildings).
Forward outlook
- Local home prices are declining (-3.0%/yr); year-one equity from $761 of loan paydown is wiped out by about $3k of value loss. Plan a longer hold.
- Montgomery County population projected to shrink 8% by 2050 — rents likely to lag national; underwrite the cash flow, not the appreciation.
- At projected returns (-3.0% appreciation + 2.6% rent growth), your $31k cash investment doubles in ~9 years — after that, you're playing with house money.
Negotiation context
- Only 13 days on market — expect competitive offers; lowballing is unlikely to land.
Risks & watch-outs
- Climate carrying-cost: severe wind risk, 80% chance of damaging wind over 30y; extreme-heat days projected 7→20/yr by 2055 (HVAC capex compounding) — expect insurance premiums to compound above CPI over the hold.
Questions for the listing agent
- Built in 1960 — when were the roof, HVAC, electrical panel, plumbing, and water heater last replaced?
- Is there a deadline driving the sale (1031 exchange, divorce, estate, relocation)? That informs how much negotiation room exists.
- Crime grade is F in this area — have there been break-ins, vandalism, or insurance claims at this property in the last 3 years? What carrier currently insures it and at what premium?
- What's the average days-on-market for RENTAL listings here right now (not sales)? A rising rental-DOM trend means longer vacancies and softer asking-rent achievability than the comps imply.
- What's the recent tenant-quality profile in this submarket — average credit score on applications, eviction rate, late-payment / NSF rate, and stable-employment percentage? A property-management company in the area should have these aggregated.
- How much new for-sale + rental construction is in the pipeline within 1–3 miles? Heavy new supply typically softens prices + rents 12–24 months out; constrained supply supports both.
Investment metrics
- 1% rule
- 1.19% ✓
- Cap rate
- 10.43%
- Cash-on-cash
- 14.77%
- DSCR
- 1.66
- GRM
- 7.0
CMA / ARV
- ARV (on-the-fly)
- $83,160
- Comps found
- 12
Show comp detail 12 sales within ~0.75 mi
| Address | Dist | Beds/Ba | Sqft | Sold | Price | $/sf | Match |
|---|---|---|---|---|---|---|---|
| 3316 Loch Haven Rd | 0.10mi | 3/1.0 | 1,080 (0%) | 1mo | $110,000 | $102 | 95 |
| 1100 Lombard Dr | 0.19mi | 3/1.0 | 1,100 (+2%) | 7mo | $100,000 | $91 | 82 |
| 3346 Bedford Ln | 0.14mi | 3/1.0 | 1,134 (+5%) | 6mo | $86,500 | $76 | 80 |
| 3318 Bedford Ln | 0.14mi | 3/2.0 | 1,134 (+5%) | 2mo | $72,999 | $64 | 79 |
| 3205 Asbury Ln | 0.31mi | 3/1.5 | 1,092 (+1%) | 6mo | $63,500 | $58 | 77 |
| 3506 Farwood Dr | 0.42mi | 3/1.0 | 1,053 (-2%) | 3mo | $81,000 | $77 | 74 |
| 963 Green Ridge Rd | 0.34mi | 3/1.0 | 1,032 (-4%) | 5mo | $104,000 | $101 | 73 |
| 975 Green Ridge Rd | 0.31mi | 3/1.0 | 952 (-12%) | 2mo | $60,000 | $63 | 64 |
| 3618 Nottingham Rd | 0.69mi | 3/1.0 | 1,035 (-4%) | 6mo | $97,000 | $94 | 56 |
| 968 Karen Rd | 0.33mi | 3/2.0 | 1,221 (+13%) | 4mo | $92,000 | $75 | 55 |
| 1227 Avondale Rd | 0.73mi | 3/1.0 | 944 (-13%) | 1mo | $70,000 | $74 | 44 |
| 2933 Willow Lane Dr | 0.75mi | 3/2.0 | 1,234 (+14%) | 6mo | $121,000 | $98 | 32 |
Match score weights: distance 35% · size 25% · config 20% · recency 20%. Top-matched comps best support the ARV.
Projected returns pro-forma
-3.0% appreciation · 2.65% rent growth · sell at horizon
- IRR
- 4.9%
- Equity multiple
- 1.19×
- Total profit
- $5,812
- Equity at exit
- $16,401
- IRR
- 14.0%
- Equity multiple
- 2.11×
- Total profit
- $34,090
- Equity at exit
- $9,511
Cash invested: $30,800 (down + closing). Projections, not guarantees.
Landlord ↔ Tenant lean methodology
- Overall (STATE)
- 90 Strongly Landlord-Friendly
- State Alabama
- 90 Strongly Landlord-Friendly · R+15
- County
- — inherits STATE
- City
- — inherits STATE
ZIP-level market 36109
- Home prices YoY
- -20.1%
- Rents YoY
- 2.6%
- Active inventory
- 207
- Price-to-rent
- 7.0×
Monthly cashflow live
- Estimated rent
- $1,305 high interval (Pro) →
- Mortgage (P&I)
- −$577
- Tax from tax record
- −$29 /mo · $351/yr
- Insurance
- −$46
- HOA
- −$0
- Vacancy / Maint / Mgmt
- −$274
- Net cashflow
- $379
Break-even live
UW: 25.0% down · 7.5% · 30yr · 1.5% tax · 5.0% vac · 8.0% maint · 8.0% mgmt
Financing live
Cash to close
- Down payment
- $27,500
- Closing costs
- $3,300
- Reserves months
- —
- Total cash needed
- —
Loan-product check · same deal, 3 products live
Conventional
25% down · 7.5% · 30yr
- Down + closing
- —
- Monthly P&I
- —
- Monthly cashflow
- —
- DSCR
- —
- Eligible?
- —
Personal DTI + credit; lowest rate.
DSCR
20% down · 8.5% · 30yr
- Down + closing
- —
- Monthly P&I
- —
- Monthly cashflow
- —
- DSCR
- —
- Eligible?
- —
No personal income docs; deal must DSCR.
Hard money
10% down · 12.0% · 12mo
- Down + closing
- —
- Monthly P&I
- —
- Monthly cashflow
- —
- DSCR
- —
- Eligible?
- —
Short-term bridge; refi at stabilization.
Rent comps 40 comps
| Address | Beds | Baths | Sqft | Rent | $/sqft | DOM | Units | Dist |
|---|---|---|---|---|---|---|---|---|
| 3318 Habersham Rd Montgomery, AL | 3.0 | 2.0 | 1134 | $1,250 | $1.10 | 14d | 1 | 0.06mi |
| 3346 Bedford Ln Montgomery, AL | 3.0 | 1.0 | 1134 | $1,295 | $1.14 | 14d | 1 | 0.14mi |
| 3323 Bedford Ln Montgomery, AL | 3.0 | 2.0 | 1134 | $1,200 | $1.06 | 21d | 1 | 0.16mi |
| 1117 Karen Rd Montgomery, AL | 3.0 | 1.0 | 1308 | $1,195 | $0.91 | 44d | 1 | 0.29mi |
| 1154 Lakewood Dr Montgomery, AL | 3.0 | 2.0 | 1066 | $1,350 | $1.27 | 44d | 1 | 0.32mi |
| 1229 Karen Rd Montgomery, AL | 4.0 | 2.0 | 1344 | $1,590 | $1.18 | 44d | 1 | 0.34mi |
| 3456 Harrison Rd Montgomery, AL | 3.0 | 1.0 | 1008 | $1,300 | $1.29 | 44d | 1 | 0.36mi |
| 2845 Zelda Rd Montgomery, AL | 2.0 | 2.0 | 1013 | $1,042 | $1.03 | 14d | 3 | 0.37mi |
| 3136 Harrison Rd Montgomery, AL | 3.0 | 1.5 | 1355 | $1,025 | $0.76 | 44d | 1 | 0.39mi |
| 2736 Chevy Chase Dr Montgomery, AL | 3.0 | 1.0 | 1100 | $1,300 | $1.18 | 44d | 1 | 0.62mi |
| 1216 Beechdale Rd Montgomery, AL | 4.0 | 2.0 | 1495 | $1,325 | $0.89 | 44d | 1 | 0.64mi |
| 1814 Pinecrest Dr Montgomery, AL | 3.0 | 1.0 | 1053 | $990 | $0.94 | 44d | 1 | 0.72mi |
| 895 Greg Dr Montgomery, AL | 3.0 | 2.0 | 1489 | $1,600 | $1.07 | 14d | 1 | 0.73mi |
| 860 Greg Dr Montgomery, AL | 3.0 | 2.0 | 1400 | $1,295 | $0.93 | 14d | 1 | 0.76mi |
| 688 Joryne Dr Montgomery, AL | 3.0 | 2.0 | 1500 | $1,200 | $0.80 | 44d | 1 | 0.81mi |
| 1839 Robison Hill Rd Montgomery, AL | 4.0 | 2.0 | 1370 | $1,550 | $1.13 | 21d | 1 | 0.83mi |
| 3233 Hillcrest Ln Montgomery, AL | 3.0 | 2.0 | 1278 | $1,395 | $1.09 | 21d | 1 | 0.92mi |
| 311 Bradley Dr Montgomery, AL | 3.0 | 1.0 | 1104 | $825 | $0.75 | 44d | 1 | 0.92mi |
| 2454 Spruce Curv Montgomery, AL | 3.0 | 1.0 | 988 | $1,100 | $1.11 | 44d | 1 | 0.94mi |
| 3602 Little John Dr Montgomery, AL | 4.0 | 1.0 | 1286 | $1,400 | $1.09 | 21d | 1 | 0.95mi |
| 301 Bradley Dr Montgomery, AL | 2.0 | 1.0 | 841 | $935 | $1.11 | 14d | 1 | 0.96mi |
| 4041A Beth Manor Dr Montgomery, AL | 1.0–3.0 | 1.0–2.0 | 925 | $1,000 | $1.08 | 21d | 20 | 1.00mi |
| 319 Olivia Ct Montgomery, AL | 2.0 | 1.0 | 850 | $700 | $0.82 | 21d | 1 | 1.07mi |
| 122 Oak Forest Dr Montgomery, AL | 3.0 | 1.0 | 1092 | $975 | $0.89 | 21d | 1 | 1.08mi |
| 750 S Marquette Dr Montgomery, AL | 3.0 | 1.0 | 1325 | $1,195 | $0.90 | 44d | 1 | 1.10mi |
| 3329 Vermont Dr Montgomery, AL | 3.0 | 1.5 | 1465 | $1,395 | $0.95 | 14d | 1 | 1.12mi |
| 3334 Cottonwood Dr Montgomery, AL | 3.0 | 2.0 | 1025 | $1,295 | $1.26 | 14d | 1 | 1.15mi |
| 118 Nottingham Ct Montgomery, AL | 3.0 | 2.0 | 1344 | $1,275 | $0.95 | 44d | 1 | 1.18mi |
| 3515 Cottonwood Dr Montgomery, AL | 3.0 | 1.5 | 1246 | $1,350 | $1.08 | 44d | 1 | 1.18mi |
| 239 Forest Hills Dr Montgomery, AL | 4.0 | 1.5 | 1500 | $1,450 | $0.97 | 21d | 1 | 1.19mi |
| 3319 Willow Lane Dr Montgomery, AL | 3.0 | 2.0 | 1032 | $1,200 | $1.16 | 44d | 1 | 1.20mi |
| 2205 E 5th St Montgomery, AL | 3.0 | 1.0 | 1020 | $800 | $0.78 | 44d | 1 | 1.21mi |
| 15 Bradley Dr Montgomery, AL | 3.0 | 2.0 | 1365 | $1,500 | $1.10 | 21d | 1 | 1.30mi |
| 2020 E 3rd St Montgomery, AL | 2.0 | 1.0 | 1186 | $750 | $0.63 | 21d | 1 | 1.36mi |
| 2000 Cherry St Montgomery, AL | 2.0 | 1.0 | 1106 | $950 | $0.86 | 44d | 1 | 1.38mi |
| 4132 Carmichael Rd Montgomery, AL | 1.0–3.0 | 1.0–2.0 | 900 | $1,156 | $1.28 | 14d | 10 | 1.38mi |
| 2113 Brewton St Montgomery, AL | 3.0 | 1.0 | 1363 | $1,150 | $0.84 | 44d | 1 | 1.43mi |
| 7 Calhoun Rd Unit B Montgomery, AL | 2.0 | 1.0 | 961 | $850 | $0.88 | 44d | 1 | 1.45mi |
| 2009 Palmetto St Montgomery, AL | 3.0 | 1.0 | 1487 | $1,050 | $0.71 | 44d | 1 | 1.47mi |
| 2229 Madison Ave Montgomery, AL | 2.0 | 1.0 | 1100 | $625 | $0.57 | 44d | 1 | 1.49mi |
Listing history 11 events
-
2026-06-18days on market $110,000 Active 13 DOM
-
2026-06-17days on market $110,000 Active 12 DOM
-
2026-06-16days on market $110,000 Active 11 DOM
-
2026-06-15days on market $110,000 Active 10 DOM
-
2026-06-14days on market $110,000 Active 8 DOM
-
2026-06-13days on market $110,000 Active 7 DOM
-
2026-06-10days on market $110,000 Active 5 DOM
-
2026-06-09days on market $110,000 Active 4 DOM
-
2026-06-08days on market $110,000 Active 3 DOM
-
2026-06-07remarks 523-char remark
-
2026-06-07$110,000 Active 2 DOM
ⓘ Source: listings_history table (triggers on properties + properties_extension) + one-shot
backfill from property_details.listing_events for pre-trigger history.
Tax reassessment forecast AL · Resets to sale price
- Current annual tax
- $351 · $29/mo
- Projected year-2 tax
- $451 · $38/mo
- Expected delta
- +$100/yr (+$8/mo · 28.5%)
ⓘ Screening estimate from a state-policy table — verify with the county assessor before closing.
Climate risk First Street
- Flood 1/10 Low FEMA zone X (unshaded) · 0% chance over 30 yrs
- Wildfire 3/10 Moderate
- Heat 7/10 Severe 7 d/yr ≥107°F today · 20 d/yr by 30 yrs out
- Wind 8/10 Severe 80% chance of damaging wind over 30 yrs
- Air quality 3/10 Moderate 4 unhealthy d/yr today · 4 by 30 yrs out
Nearby sold comps map
Loading sold comps map…
Walkable amenities ~0.75 mi
Loading nearby amenities…
Taxation est. · year 1
- Rental income
- $15,660
- − Mortgage interest
- −$6,162
- − Property taxes
- −$351
- − Insurance
- −$550
- − Repairs & maintenance
- −$1,253
- − Management
- −$1,253
- − Depreciation
- −$3,200
- Taxable income
- $2,892
- Est. tax owed @ 24.0%
- −$694
- After-tax cash flow
- $3,854/yr
For passive investors: Depreciation is non-cash, so a rental often shows a tax loss while cash-flowing — sheltering income. Rental losses are passive: they offset passive income freely, and up to $25,000/yr can offset ordinary (W-2) income if you actively participate and your MAGI is under $100k (phasing out to $0 by $150k); unused losses carry forward. On sale, claimed depreciation is recaptured at up to 25%, and gains may owe capital-gains tax (a 1031 exchange can defer both). Figures are a year-1 estimate at your 24.0% rate — not tax advice; consult a CPA.
Schools (NCES district)
- District
- Montgomery County
- NCES district ID
- 0102430
- Math proficiency
- 9% ▼ -21.00%
- Reading proficiency
- 31% ▼ -1.00%
- Median HH income
- $43,902
- Composite
- 17.24/100
- National rank
- #9093
- State rank
- #106 of 129 in AL
Livability — Montgomery
- Score
- 65/100
- State rank
- #138
- US rank
- #13416
Category grades
Schools grade is shown separately in the Schools card above.
Census & demographics
- Census place
- Montgomery, AL
- County
- Montgomery County · 190,016 people
- City population
- 175,913
- Metro
- Montgomery, AL
- Population (ZIP)
- 23,581
- Household income
- $59,193
- Rent vs Own
- Severe rent burden
- 1039.0
Population outlook (Montgomery County) Hauer SSP2
- Today (2025)
- 224,008 people
- By 2030
- 221,460 · -1.1%
- By 2040
- 214,179 · -4.4%
- By 2050
- 204,912 · -8.5%
- By 2075
- 177,821 · -20.6%
- By 2100
- 145,134 · -35.2%
Race, ethnicity, and origin ACS 2023
- Neighborhood character
- Diverse neighborhood (Simpson 0.60)
- Race & ethnicity
- White 49% Black 39% Hispanic / Latino 8% Two or more races 4%
- Hispanic origin (detail)
- Mexican 4%
- Common ancestry
- Slovak 2% Lithuanian 1% Serbian 1%
- Foreign-born
- 4% · Canada, South Korea
- Languages at home
- 94% English-only · Spanish 5%
Political lean MEDSL · Montgomery
- 2024 margin
- Solid D (+30.7) · D 64.8% · R 34.1% · Other 1.1%
- 2008→2024 swing
- +11.5pp toward D · 2008: 19.2pp · 2024: 30.7pp
- All cycles
- 2024: D+30.7 2020: D+31.5 2016: D+26.2 2012: D+24.3 2008: D+19.2
Not yet ingested
- Civics
- —
Market trends
- HPI YoY
- ▼ -37.64%
- Current HPI
- 149.3867
- Rent YoY
- ▲ 2.65%
- Metro
- Montgomery, AL
- State GDP YoY
- ▲ 2.94%
- F500 in state
- 4
Industry mix (Fortune 500 HQ in AL)
| Industry | F500 HQs | Revenue |
|---|---|---|
| Financial Services | 1 | $8B |
|
||
| Healthcare | 1 | $5B |
|
||
Price history
1 event — show timeline
- 2026-06-05 Listed $110,000 MAAR
Property tax history
+3.8%/yrLatest (2025): $351 · -4.7% YoY. Source: county tax records.
Cash-flow waterfall
monthlySold comps — $/sqft
last 12 mo · ≤1 miLoading sold comps…