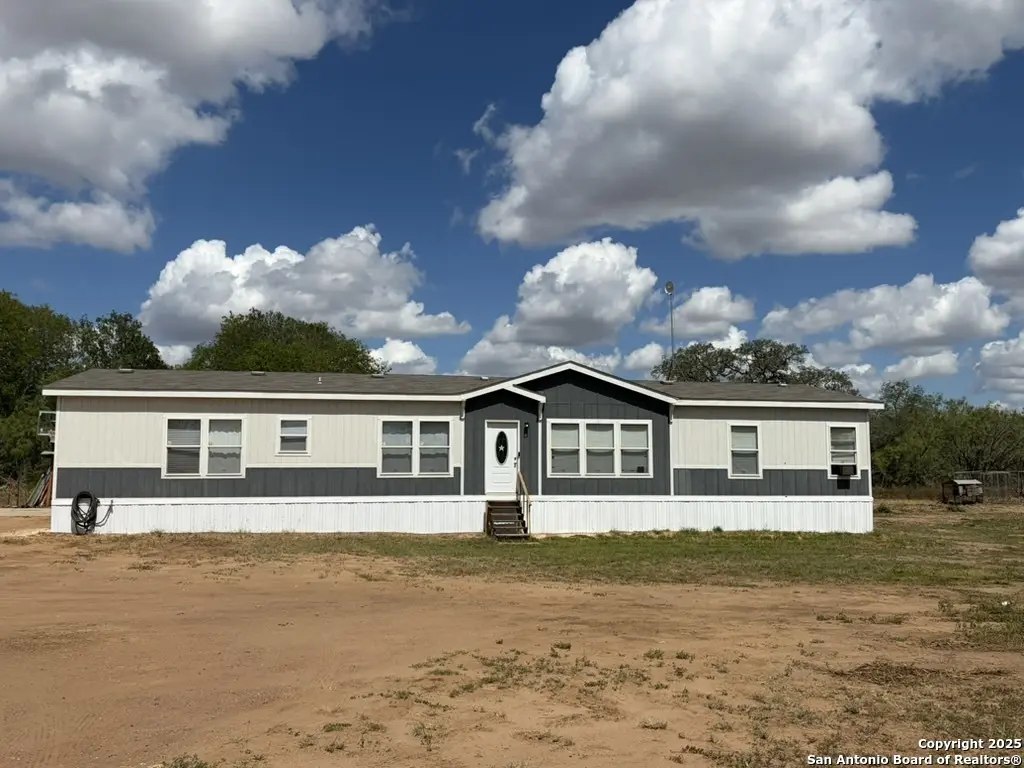
474 Peach · Leming, TX
Flood risk 1/10 · Minimal
- FEMA flood zone
- X (unshaded)
- Chance of flooding over 30 yrs
- 0.0%
- Est. flood insurance / yr
- $507 – $1,088
Fire risk 6/10 · Moderate
- Est. fire insurance / yr
- $1,222 – $2,270
Heat risk 8/10 · Major
- Hot days now (above 110°F)
- 6 days/yr
- Hot days in 30 yrs
- 18 days/yr
Wind risk 8/10 · Major
- Chance of severe wind over 30 yrs
- 80.0%
Air-quality risk 1/10 · Minimal
- Unhealthy air days now
- 0 days/yr
- Unhealthy air days in 30 yrs
- 0 days/yr
Risk factors via First Street. Map © Google.
Why this score? — see what drove the D grade
The composite is a weighted blend of 9 inputs, each scored 0–100. Each bar is that input's sub-score; the figure is the points it added to the 100-point composite (weight × sub-score).
- ARV discount +15.0/15.0
- Cash flow +6.9/30.0
- Appreciation +5.0/10.0
- Schools +3.2/10.0
- Rent growth +2.5/5.0
- Condition / age +2.5/5.0
- Livability +2.2/5.0
- 1% rule +1.7/10.0
- DSCR +1.1/10.0
$300,000
🖨 Deal sheet (PDF) 📄 Offer letter ✓ Due diligence
Listing remarks MLS
Experience delightful country living with stunning sunsets and breathtaking sunrises. Come explore this spacious four-bedroom, two-bath home featuring a beautiful open kitchen. Enjoy your evenings on the amazing back porch, perfect for relaxation. Don't wait-this gem won't last long! Schedule your showing today.
Key facts
- Back porch
- Open kitchen
- 2.71 acre lot
Tags
Neighborhood map
What this means for you Summary
Snapshot
- This is a 4-bed/2.0-bath townhouse listed at $300k.
Deal economics
- At list price, monthly cash flow is $-456 ($-5k/yr) — negative.
- To cash-flow at today's rent, offer at most $220k (26.8% below list).
- To meet the 1% rule (rent ≥ 1% of price), the offer needs to be $200k (33.3% below list).
- Recommended offer: $200k (33.3% below list) — sets the bar for 1% rule.
Location & tenants
- Location reads 44/100 on livability (#1,568 in TX) — a working-class tenant base; expect higher turnover. Strengths: cost of living A+, crime A; Watch: amenities F, commute F, employment F.
- Pleasanton ISD (town): math 36% / reading 37% proficiency, ranked #470 of 826 in TX (top 57%) — families likely to look elsewhere, expect single-tenant / working-renter base with shorter leases.
- Zoned schools: Pleasanton El (math 35% / reading 35%, grade F, #1,965 of 4,322 statewide, top 46%, 958 students, 70% FRL); Pleasanton J H (math 30% / reading 34%, grade F, #971 of 1,662 statewide, top 60%, 772 students, 66% FRL); Pleasanton H S (math 59% / reading 51%, grade C, #373 of 1,632 statewide, top 23%, 944 students, 60% FRL).
- Market conditions: 2 active listings in the ZIP; 1 comparable units currently listed for rent nearby; 224 units permitted in Atascosa County in 2024 (0 in 5+ unit buildings).
Forward outlook
- In year one you build about $11k of equity ($2k loan paydown + $9k appreciation (3.0% local appreciation)).
- Atascosa County population projected at +41% by 2050 — long-run rental-demand tailwind backs the buy-and-hold thesis.
- By year 4, paydown + projected appreciation supports a ~$38k cash-out refi (75% LTV) — recoverable capital for the next deal without selling this one.
Negotiation context
- It's been on market 271 days — a 12% lower offer ($264k) is reasonable based on typical stale-listing flexibility.
Risks & watch-outs
- Climate carrying-cost: severe wind risk, 80% chance of damaging wind over 30y; major wildfire risk; extreme-heat days projected 6→18/yr by 2055 (HVAC capex compounding) — expect insurance premiums to compound above CPI over the hold.
Questions for the listing agent
- What do current leases actually rent for vs. the listed asking? Can we see a recent rent roll and the last 12 months of T-12 income?
- It's been on market 271 days. Have you received any prior offers? Is the seller open to a 33% concession, seller financing, or rate buy-down credit?
- Why hasn't it sold? Are there any deal-killer items the seller is aware of (foundation, flood, title, zoning, code violations)?
- Is there a deadline driving the sale (1031 exchange, divorce, estate, relocation)? That informs how much negotiation room exists.
- Schools are F-rated, which usually means shorter tenancies and higher turnover. Who's the typical renter profile here, and what's been the actual vacancy rate?
- The area grade is low — what's the realistic commute time and amenity access for the typical tenant pool here? Any planned neighborhood developments (good or bad) we should know about?
- What's the average days-on-market for RENTAL listings here right now (not sales)? A rising rental-DOM trend means longer vacancies and softer asking-rent achievability than the comps imply.
- What's the recent tenant-quality profile in this submarket — average credit score on applications, eviction rate, late-payment / NSF rate, and stable-employment percentage? A property-management company in the area should have these aggregated.
- How much new for-sale + rental construction is in the pipeline within 1–3 miles? Heavy new supply typically softens prices + rents 12–24 months out; constrained supply supports both.
Investment metrics
- 1% rule
- 0.67% ✗
- Cap rate
- 4.47%
- Cash-on-cash
- -6.51%
- DSCR
- 0.71
- GRM
- 12.5
CMA / ARV
- ARV (median comp)
- $414,919
- List price
- $300,000
- Delta
- -27.70%
- Verdict
- UNDERPRICED
- Comps
- 5 within 1.0 mi
Projected returns pro-forma
3.0% appreciation · 3.0% rent growth · sell at horizon
- IRR
- 1.5%
- Equity multiple
- 1.08×
- Total profit
- $7,127
- Equity at exit
- $134,893
- IRR
- 5.1%
- Equity multiple
- 1.79×
- Total profit
- $66,098
- Equity at exit
- $207,886
Cash invested: $84,000 (down + closing). Projections, not guarantees.
Landlord ↔ Tenant lean methodology
- Overall (STATE)
- 87 Strongly Landlord-Friendly
- State Texas
- 87 Strongly Landlord-Friendly · R+5
- County
- — inherits STATE
- City
- — inherits STATE
ZIP-level market 78050
- Active inventory
- 2
- Price-to-rent
- 12.5×
Monthly cashflow live
- Estimated rent
- $2,000 medium interval (Pro) →
- Mortgage (P&I)
- −$1,573
- Tax from tax record
- −$337 /mo · $4,049/yr
- Insurance
- −$125
- HOA
- −$0
- Lot rent
- −$0
- Vacancy / Maint / Mgmt
- −$420
- Net cashflow
- $-456
Break-even live
Sensitivity live
| Price | -10% $-286 | -5% $-371 | +0% $-456 | +5% $-541 | +10% $-625 |
|---|---|---|---|---|---|
| Rent | -10% $-614 | -5% $-535 | +0% $-456 | +5% $-377 | +10% $-298 |
| Rate | -1.0pp $-305 | -0.5pp $-379 | base $-456 | +0.5pp $-533 | +1.0pp $-612 |
UW: 25.0% down · 7.5% · 30yr · 1.5% tax · 5.0% vac · 8.0% maint · 8.0% mgmt
Financing live
Cash to close
- Down payment
- $75,000
- Closing costs
- $9,000
- Reserves months
- —
- Total cash needed
- —
Loan-product check · same deal, 3 products live
Conventional
25% down · 7.5% · 30yr
- Down + closing
- —
- Monthly P&I
- —
- Monthly cashflow
- —
- DSCR
- —
- Eligible?
- —
Personal DTI + credit; lowest rate.
DSCR
20% down · 8.5% · 30yr
- Down + closing
- —
- Monthly P&I
- —
- Monthly cashflow
- —
- DSCR
- —
- Eligible?
- —
No personal income docs; deal must DSCR.
Hard money
10% down · 12.0% · 12mo
- Down + closing
- —
- Monthly P&I
- —
- Monthly cashflow
- —
- DSCR
- —
- Eligible?
- —
Short-term bridge; refi at stabilization.
Rent comps 1 comps
| Address | Beds | Baths | Sqft | Rent | $/sqft | DOM | Units | Dist |
|---|---|---|---|---|---|---|---|---|
| 275 Western St Pleasanton, TX | 4.0 | 2.0 | 1768 | $2,000 | $1.13 | 46d | 1 | 0.63mi |
Listing history 19 events
-
2026-06-22days on market $300,000 Active 271 DOM
-
2026-06-21days on market $300,000 Active 270 DOM
-
2026-06-18days on market $300,000 Active 267 DOM
-
2026-06-17days on market $300,000 Active 266 DOM
-
2026-06-16days on market $300,000 Active 265 DOM
-
2026-06-15days on market $300,000 Active 264 DOM
-
2026-06-13days on market $300,000 Active 262 DOM
-
2026-06-09days on market $300,000 Active 258 DOM
-
2026-06-08days on market $300,000 Active 257 DOM
-
2026-06-07days on market $300,000 Active 256 DOM
-
2026-06-04days on market $300,000 Active 253 DOM
-
2026-06-03days on market $300,000 Active 252 DOM
-
2026-06-02days on market $300,000 Active 251 DOM
-
2026-06-01days on market $300,000 Active 250 DOM
-
2026-05-31days on market $300,000 Active 249 DOM
-
2026-05-06price $300,000 313-char remark
Show marketing remark (313 chars)
Experience delightful country living with stunning sunsets and breathtaking sunrises. Come explore this spacious four-bedroom, two-bath home featuring a beautiful open kitchen. Enjoy your evenings on the amazing back porch, perfect for relaxation. Don't wait-this gem won't last long! Schedule your showing today.
-
2025-11-01price $305,000 313-char remark
Show marketing remark (313 chars)
Experience delightful country living with stunning sunsets and breathtaking sunrises. Come explore this spacious four-bedroom, two-bath home featuring a beautiful open kitchen. Enjoy your evenings on the amazing back porch, perfect for relaxation. Don't wait-this gem won't last long! Schedule your showing today.
-
2025-09-24$308,000 New 313-char remark
Show marketing remark (313 chars)
Experience delightful country living with stunning sunsets and breathtaking sunrises. Come explore this spacious four-bedroom, two-bath home featuring a beautiful open kitchen. Enjoy your evenings on the amazing back porch, perfect for relaxation. Don't wait-this gem won't last long! Schedule your showing today.
-
2019-02-13soldstatus
ⓘ Source: listings_history table (triggers on properties + properties_extension) + one-shot
backfill from property_details.listing_events for pre-trigger history.
Tax reassessment forecast TX · Resets to sale price
- Current annual tax
- $4,049 · $337/mo
- Projected year-2 tax
- $5,490 · $458/mo
- Expected delta
- +$1,441/yr (+$120/mo · 35.6%)
ⓘ Screening estimate from a state-policy table — verify with the county assessor before closing.
Climate risk First Street
- Flood 1/10 Low FEMA zone X (unshaded) · 0% chance over 30 yrs
- Wildfire 6/10 Major
- Heat 8/10 Severe 6 d/yr ≥110°F today · 18 d/yr by 30 yrs out
- Wind 8/10 Severe 80% chance of damaging wind over 30 yrs
- Air quality 1/10 Low 0 unhealthy d/yr today · 0 by 30 yrs out
Nearby sold comps map
Loading sold comps map…
Walkable amenities ~0.75 mi
Loading nearby amenities…
Taxation est. · year 1
- Rental income
- $24,000
- − Mortgage interest
- −$16,805
- − Property taxes
- −$4,049
- − Insurance
- −$1,500
- − Repairs & maintenance
- −$1,920
- − Management
- −$1,920
- − Depreciation
- −$8,727
- Taxable loss
- −$10,921
- Est. tax savings @ 24.0%
- +$2,621
- After-tax cash flow
- $-2,847/yr
For passive investors: Depreciation is non-cash, so a rental often shows a tax loss while cash-flowing — sheltering income. Rental losses are passive: they offset passive income freely, and up to $25,000/yr can offset ordinary (W-2) income if you actively participate and your MAGI is under $100k (phasing out to $0 by $150k); unused losses carry forward. On sale, claimed depreciation is recaptured at up to 25%, and gains may owe capital-gains tax (a 1031 exchange can defer both). Figures are a year-1 estimate at your 24.0% rate — not tax advice; consult a CPA.
Schools (NCES district)
- District
- Pleasanton ISD
- NCES district ID
- 4835190
- Math proficiency
- 36% ▼ -2.00%
- Reading proficiency
- 37% ▲ 4.00%
- Median HH income
- $53,885
- Composite
- 31.97/100
- National rank
- #5843
- State rank
- #470 of 826 in TX
Livability — Leming
- Score
- 44/100
- State rank
- #1568
- US rank
- #26744
Category grades
Schools grade is shown separately in the Schools card above.
Census & demographics
- Census place
- Leming, TX
- Population (ZIP)
- 697
Population outlook (Atascosa County) Hauer SSP2
- Today (2025)
- 57,233 people
- By 2030
- 61,729 · +7.9%
- By 2040
- 71,122 · +24.3%
- By 2050
- 80,906 · +41.4%
- By 2075
- 106,134 · +85.4%
- By 2100
- 122,415 · +113.9%
Race, ethnicity, and origin ACS 2023
- Neighborhood character
- Predominantly Hispanic (74%)
- Race & ethnicity
- Hispanic / Latino 74% Two or more races 68% White 22% Black 5%
- Hispanic origin (detail)
- Mexican 74%
- Common ancestry
- Romanian 15% Lithuanian 2%
- Foreign-born
- 3% · Canada
- Languages at home
- 43% English-only · Spanish 57%
Political lean MEDSL · Atascosa
- 2024 margin
- Solid R (+43.3) · D 27.9% · R 71.3%
- 2008→2024 swing
- -32.8pp toward R · 2008: -10.5pp · 2024: -43.3pp
- All cycles
- 2024: R+43.3 2020: R+34.0 2016: R+29.1 2012: R+18.3 2008: R+10.5
Not yet ingested
- Civics
- —
Market trends
- HPI YoY
- —
- Current HPI
- —
- Rent YoY
- —
- Metro
- —
- State GDP YoY
- ▲ 3.95%
- F500 in state
- 110
Industry mix (Fortune 500 HQ in TX)
| Industry | F500 HQs | Revenue |
|---|---|---|
| Energy | 16 | $1,198B |
|
||
| Technology | 5 | $198B |
|
||
| Engineering / Construction | 4 | $72B |
|
||
| Energy Services | 3 | $60B |
|
||
| Utilities | 3 | $41B |
|
||
| Healthcare | 2 | $330B |
|
||
Price history
-2.6% since first listed4 events — show timeline
- 2026-05-06 Price Changed $300,000 LERA
- 2025-11-01 Price Changed $305,000 LERA
- 2025-09-24 Listed $308,000 LERA
- 2019-02-13 Sold (Public Records) — Public Records
Property tax history
+23.1%/yrLatest (2025): $4,049 · +9.4% YoY. Source: county tax records.
Cash-flow waterfall
monthlySold comps — $/sqft
last 12 mo · ≤1 miLoading sold comps…