80649 Brown Rd · Twentynine Palms, CA
Flood risk 1/10 · Minimal
- FEMA flood zone
- X (unshaded)
- Chance of flooding over 30 yrs
- 0.0%
- Est. flood insurance / yr
- $507 – $1,088
Fire risk 1/10 · Minimal
- Est. fire insurance / yr
- $659 – $1,223
Heat risk 9/10 · Severe
- Hot days now (above 110°F)
- 7 days/yr
- Hot days in 30 yrs
- 18 days/yr
Wind risk 1/10 · Minimal
- Chance of severe wind over 30 yrs
- —
Air-quality risk 4/10 · Minor
- Unhealthy air days now
- 5 days/yr
- Unhealthy air days in 30 yrs
- 6 days/yr
Risk factors via First Street. Map © Google.
Why this score? — see what drove the B grade
The composite is a weighted blend of 9 inputs, each scored 0–100. Each bar is that input's sub-score; the figure is the points it added to the 100-point composite (weight × sub-score).
- Cash flow +28.3/30.0
- ARV discount +15.0/15.0
- DSCR +10.0/10.0
- 1% rule +7.8/10.0
- Rent growth +3.6/5.0
- Livability +3.0/5.0
- Condition / age +2.5/5.0
- Schools +2.2/10.0
- Appreciation +0.0/10.0
$92,000
🖨 Deal sheet 📄 Offer letter ✓ Due diligence
Listing remarks MLS
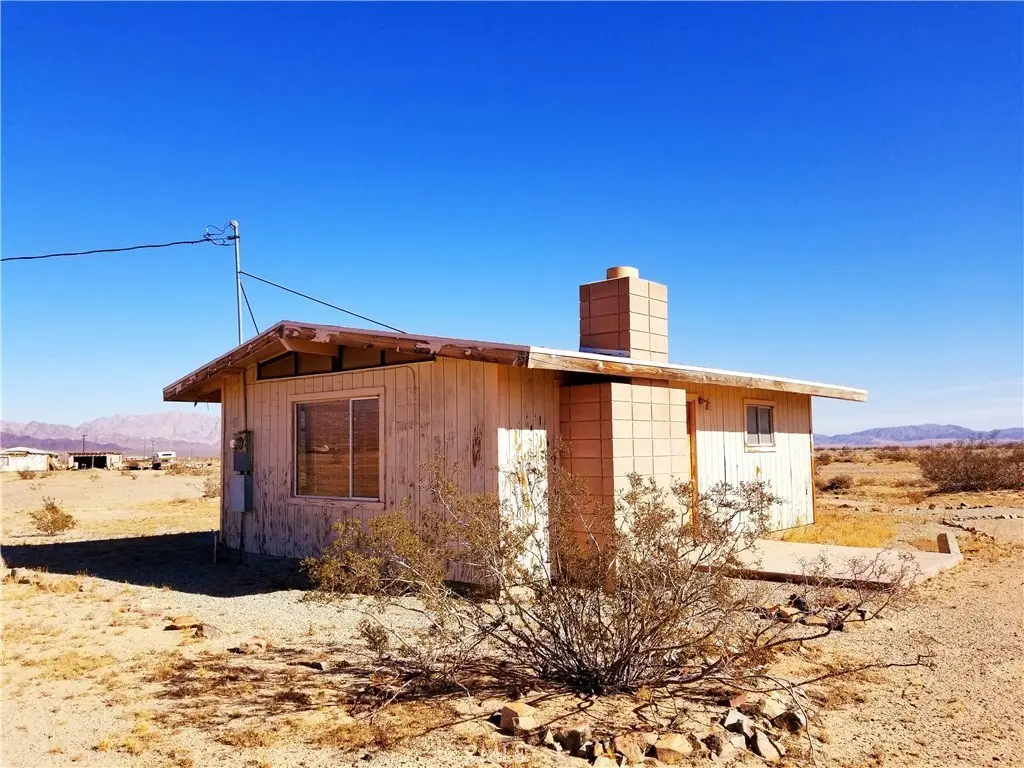
Escape to this charming cabin nestled on 5 private acres in Wonder Valley, surrounded on two sides by 50 acres of pristine government land. Enjoy unparalleled stargazing with clear night skies, offering spectacular views of shooting stars and the Milky Way—perfect for those seeking tranquility away from light pollution and development. This rustic cabin features an original wood-burning fireplace, vintage sink, and a bathtub, providing a cozy and nostalgic atmosphere. Power is connected, and U-Haul water is available, though reconnecting will be needed. Ideal as a weekend getaway or a year-round residence, this property is just moments from the renowned Palms Restaurant, the 29 Palms USMC Base, and the East Entrance to Joshua Tree National Park. With a little TLC, it could be transformed into your perfect desert retreat!
Key facts
- Private acres
- Year-round residence
- 29 palms usmc base
Tags
Neighborhood map
What this means for you Summary
Snapshot
- This is a 1-bed/1.0-bath other listed at $92k.
Deal economics
- At list price, monthly cash flow is $294 ($4k/yr) — positive.
- The deal already cash-flows at list — no discount required.
- Meets the 1% rule at list price ($1k rent vs $92k).
- Recommended offer: $84k (9.0% below list) — sets the bar for market timing.
- Cap rate 10.1% vs local median 4.3% in Twentynine Palms — top-decile yield for the area; either an underpriced asset or a hidden risk that comps aren't pricing in. Stress-test before assuming the spread holds.
Location & tenants
- Location reads 59/100 on livability (#622 in CA) — a working-class tenant base; expect higher turnover. Strengths: commute A+, housing A+; Watch: schools D, amenities F, employment D-.
- Morongo Unified (town): math 15% / reading 38% proficiency, ranked #395 of 517 in CA (top 76%) — low school quality limits family demand, transient renter base, plan for 1-2y turnover.
- Market conditions: Rents rising fast (+4.5%/yr); 734 active listings in the ZIP; 5,458 units permitted in San Bernardino County in 2024 (1,500 in 5+ unit buildings).
Forward outlook
- Local home prices are declining (-3.0%/yr); year-one equity from $636 of loan paydown is wiped out by about $3k of value loss. Plan a longer hold.
- San Bernardino County population projected at +15% by 2050 — modest demand growth; plan on rents tracking national, not racing it.
- At projected returns (-3.0% appreciation + 4.5% rent growth), your $26k cash investment doubles in ~8 years — after that, you're playing with house money.
Negotiation context
- It's been on market 111 days — a 9% lower offer ($84k) is reasonable based on typical stale-listing flexibility.
- 7 sale attempts since 9y ago with the ask held roughly flat each time — persistent listings suggest the price (not the market) is what's stuck; bring a comps-based counter.
Risks & watch-outs
- Watch-outs: built in 1959 — expect roof / HVAC / electrical / plumbing capex.
- Climate carrying-cost: extreme-heat days projected 7→18/yr by 2055 (HVAC capex compounding) — expect insurance premiums to compound above CPI over the hold.
Questions for the listing agent
- It's been on market 111 days. Have you received any prior offers? Is the seller open to a 9% concession, seller financing, or rate buy-down credit?
- Built in 1959 — when were the roof, HVAC, electrical panel, plumbing, and water heater last replaced?
- Why hasn't it sold? Are there any deal-killer items the seller is aware of (foundation, flood, title, zoning, code violations)?
- Is there a deadline driving the sale (1031 exchange, divorce, estate, relocation)? That informs how much negotiation room exists.
- Schools are D-rated, which usually means shorter tenancies and higher turnover. Who's the typical renter profile here, and what's been the actual vacancy rate?
- What's the average days-on-market for RENTAL listings here right now (not sales)? A rising rental-DOM trend means longer vacancies and softer asking-rent achievability than the comps imply.
- What's the recent tenant-quality profile in this submarket — average credit score on applications, eviction rate, late-payment / NSF rate, and stable-employment percentage? A property-management company in the area should have these aggregated.
- How much new for-sale + rental construction is in the pipeline within 1–3 miles? Heavy new supply typically softens prices + rents 12–24 months out; constrained supply supports both.
Investment metrics
- 1% rule
- 1.28% ✓
- Cap rate
- 10.13%
- Cash-on-cash
- 13.72%
- DSCR
- 1.61
- GRM
- 6.5
CMA / ARV
- ARV (median comp)
- $130,803
- List price
- $92,000
- Delta
- -29.67%
- Verdict
- UNDERPRICED
- Comps
- 10 within 2.0 mi
Projected returns pro-forma
-3.0% appreciation · 4.45% rent growth · sell at horizon
- IRR
- 5.5%
- Equity multiple
- 1.22×
- Total profit
- $5,602
- Equity at exit
- $13,717
- IRR
- 16.2%
- Equity multiple
- 2.41×
- Total profit
- $36,444
- Equity at exit
- $7,954
Cash invested: $25,760 (down + closing). Projections, not guarantees.
Landlord ↔ Tenant lean methodology
- Overall (STATE)
- 18 Strongly Tenant-Friendly
- State California
- 18 Strongly Tenant-Friendly · D+13
- County
- — inherits STATE
- City
- — inherits STATE
ZIP-level market 92277
- Home prices YoY
- -3.1%
- Rents YoY
- 4.5%
- Active inventory
- 734
- Price-to-rent
- 6.5×
Monthly cashflow live
- Estimated rent
- $1,175 medium interval (Pro) →
- Mortgage (P&I)
- −$482
- Tax from tax record
- −$113 /mo · $1,354/yr
- Insurance
- −$38
- HOA
- −$0
- Vacancy / Maint / Mgmt
- −$247
- Net cashflow
- $294
Break-even live
UW: 25.0% down · 7.5% · 30yr · 1.5% tax · 5.0% vac · 8.0% maint · 8.0% mgmt
Financing live
Cash to close
- Down payment
- $23,000
- Closing costs
- $2,760
- Reserves months
- —
- Total cash needed
- —
Loan-product check · same deal, 3 products live
Conventional
25% down · 7.5% · 30yr
- Down + closing
- —
- Monthly P&I
- —
- Monthly cashflow
- —
- DSCR
- —
- Eligible?
- —
Personal DTI + credit; lowest rate.
DSCR
20% down · 8.5% · 30yr
- Down + closing
- —
- Monthly P&I
- —
- Monthly cashflow
- —
- DSCR
- —
- Eligible?
- —
No personal income docs; deal must DSCR.
Hard money
10% down · 12.0% · 12mo
- Down + closing
- —
- Monthly P&I
- —
- Monthly cashflow
- —
- DSCR
- —
- Eligible?
- —
Short-term bridge; refi at stabilization.
Listing history 38 events
-
2026-06-18days on market $92,000 Active 111 DOM
-
2026-06-17days on market $92,000 Active 110 DOM
-
2026-06-16days on market $92,000 Active 109 DOM
-
2026-06-15days on market $92,000 Active 108 DOM
-
2026-06-13days on market $92,000 Active 106 DOM
-
2026-06-13days on market $92,000 Active 105 DOM
-
2026-06-09days on market $92,000 Active 102 DOM
-
2026-06-08days on market $92,000 Active 101 DOM
-
2026-06-07days on market $92,000 Active 100 DOM
-
2026-06-04days on market $92,000 Active 97 DOM
-
2026-06-03days on market $92,000 Active 96 DOM
-
2026-06-02days on market $92,000 Active 95 DOM
-
2026-06-01days on market $92,000 Active 94 DOM
-
2026-05-31days on market $92,000 Active 93 DOM
-
2026-02-27$92,000 Active 838-char remark
Show marketing remark (838 chars)
Escape to this charming cabin nestled on 5 private acres in Wonder Valley, surrounded on two sides by 50 acres of pristine government land. Enjoy unparalleled stargazing with clear night skies, offering spectacular views of shooting stars and the Milky Way—perfect for those seeking tranquility away from light pollution and development. This rustic cabin features an original wood-burning fireplace, vintage sink, and a bathtub, providing a cozy and nostalgic atmosphere. Power is connected, and U-Haul water is available, though reconnecting will be needed. Ideal as a weekend getaway or a year-round residence, this property is just moments from the renowned Palms Restaurant, the 29 Palms USMC Base, and the East Entrance to Joshua Tree National Park. With a little TLC, it could be transformed into your perfect desert retreat!
-
2025-07-31historical
-
2025-02-19$97,000 Active
-
2023-09-04historical
-
2023-05-04price $115,000
-
2023-03-05$120,000 Active
-
2020-12-31soldstatus $90,000 Closed Sale
-
2020-12-30soldstatus $90,000
-
2020-12-09status Pending Sale
-
2020-10-29price $95,000
-
2020-09-05$99,000 Active
-
2020-02-20soldstatus $68,650 Closed Sale
-
2020-02-20soldstatus $69,000
-
2020-01-18status Pending Sale
-
2020-01-09price $69,500
-
2019-12-15price $74,500
-
2019-11-13$79,900 Active
-
2018-06-01historical
-
2018-02-03$65,000 Active
-
2018-02-01historical
-
2017-11-03$65,000 Active
-
2005-08-01soldstatus $35,000
-
2003-03-07soldstatus $10,000
-
1996-07-09soldstatus $5,500
ⓘ Source: listings_history table (triggers on properties + properties_extension) + one-shot
backfill from property_details.listing_events for pre-trigger history.
Tax reassessment forecast CA · Resets to sale price
- Current annual tax
- $1,354 · $113/mo
- Projected year-2 tax
- $1,354 · $113/mo
- Expected delta
- $0/yr ($0/mo · 0.0%)
ⓘ Screening estimate from a state-policy table — verify with the county assessor before closing.
Climate risk First Street
- Flood 1/10 Low FEMA zone X (unshaded) · 0% chance over 30 yrs
- Wildfire 1/10 Low
- Heat 9/10 Extreme 7 d/yr ≥110°F today · 18 d/yr by 30 yrs out
- Wind 1/10 Low
- Air quality 4/10 Moderate 5 unhealthy d/yr today · 6 by 30 yrs out
Nearby sold comps map
Loading sold comps map…
Walkable amenities ~0.75 mi
Loading nearby amenities…
Taxation est. · year 1
- Rental income
- $14,098
- − Mortgage interest
- −$5,153
- − Property taxes
- −$1,354
- − Insurance
- −$460
- − Repairs & maintenance
- −$1,128
- − Management
- −$1,128
- − Depreciation
- −$2,676
- Taxable income
- $2,198
- Est. tax owed @ 24.0%
- −$528
- After-tax cash flow
- $3,006/yr
For passive investors: Depreciation is non-cash, so a rental often shows a tax loss while cash-flowing — sheltering income. Rental losses are passive: they offset passive income freely, and up to $25,000/yr can offset ordinary (W-2) income if you actively participate and your MAGI is under $100k (phasing out to $0 by $150k); unused losses carry forward. On sale, claimed depreciation is recaptured at up to 25%, and gains may owe capital-gains tax (a 1031 exchange can defer both). Figures are a year-1 estimate at your 24.0% rate — not tax advice; consult a CPA.
Schools (NCES district)
- District
- Morongo Unified
- NCES district ID
- 0625860
- Math proficiency
- 15% ▼ -12.00%
- Reading proficiency
- 38% ▼ -3.00%
- Median HH income
- $39,399
- Composite
- 22.19/100
- National rank
- #8156
- State rank
- #395 of 517 in CA
Livability — Twentynine Palms
- Score
- 59/100
- State rank
- #622
- US rank
- #19731
Category grades
Schools grade is shown separately in the Schools card above.
Census & demographics
- County
- San Bernardino County · 2,030,291 people
- City population
- 26,277
- Metro
- Riverside-San Bernardino-Ontario, CA
- Population (ZIP)
- 26,277
- Household income
- $60,901
- Rent vs Own
- Severe rent burden
- 1057.0
Population outlook (San Bernardino County) Hauer SSP2
- Today (2025)
- 2,300,329 people
- By 2030
- 2,378,907 · +3.4%
- By 2040
- 2,523,137 · +9.7%
- By 2050
- 2,642,388 · +14.9%
- By 2075
- 2,880,769 · +25.2%
- By 2100
- 2,909,436 · +26.5%
Race, ethnicity, and origin ACS 2023
- Neighborhood character
- Diverse neighborhood (Simpson 0.70)
- Race & ethnicity
- White 49% Two or more races 24% Hispanic / Latino 24% Black 9% Asian 4% Pacific Islander 1% Native American 1%
- Hispanic origin (detail)
- Mexican 20%
- Common ancestry
- Italian 5% Lithuanian 3% Slovak 3%
- Foreign-born
- 9% · Canada, China, South Korea
- Languages at home
- 81% English-only · Spanish 12% Other Asian/Pacific 2% Tagalog/Filipino 1%
Political lean MEDSL · San Bernardino
- 2024 margin
- Toss-up / Even · D 47.5% · R 49.7% · Other 2.8%
- 2008→2024 swing
- -8.5pp toward R · 2008: 6.3pp · 2024: -2.1pp
- All cycles
- 2024: R+2.1 2020: D+10.7 2016: D+9.8 2012: D+5.4 2008: D+6.3
Not yet ingested
- Civics
- —
Market trends
- HPI YoY
- ▼ -12.15%
- Current HPI
- 380.5083
- Rent YoY
- ▲ 4.45%
- Metro
- Riverside-San Bernardino-Ontario, CA
- State GDP YoY
- ▲ 3.21%
- F500 in state
- 116
Industry mix (Fortune 500 HQ in CA)
| Industry | F500 HQs | Revenue |
|---|---|---|
| Technology | 27 | $1,492B |
|
||
| Financial Services | 3 | $174B |
|
||
| Retail | 3 | $44B |
|
||
| Insurance | 3 | $26B |
|
||
| Media / Entertainment | 2 | $115B |
|
||
| Pharmaceuticals / Biotech | 2 | $62B |
|
||
Price history
+1572.7% since first listed24 events — show timeline
- 2026-02-27 Listed $92,000 CRMLS
- 2025-07-31 Listing Removed — CRMLS
- 2025-02-19 Listed $97,000 CRMLS
- 2023-09-04 Listing Removed — CRMLS
- 2023-05-04 Price Changed $115,000 CRMLS
- 2023-03-05 Listed $120,000 CRMLS
- 2020-12-31 Sold (MLS) $90,000 CRMLS
- 2020-12-30 Sold (Public Records) $90,000 Public Records
- 2020-12-09 Pending — CRMLS
- 2020-10-29 Price Changed $95,000 CRMLS
- 2020-09-05 Listed $99,000 CRMLS
- 2020-02-20 Sold (Public Records) $69,000 Public Records
- 2020-02-20 Sold (MLS) $68,650 CRMLS
- 2020-01-18 Pending — CRMLS
- 2020-01-09 Price Changed $69,500 CRMLS
- 2019-12-15 Price Changed $74,500 CRMLS
- 2019-11-13 Listed $79,900 CRMLS
- 2018-06-01 Listing Removed — CRMLS
- 2018-02-03 Listed $65,000 CRMLS
- 2018-02-01 Listing Removed — CRMLS
- 2017-11-03 Listed $65,000 CRMLS
- 2005-08-01 Sold (Public Records) $35,000 Public Records
- 2003-03-07 Sold (Public Records) $10,000 Public Records
- 1996-07-09 Sold (Public Records) $5,500 Public Records
Property tax history
+6.0%/yrLatest (2025): $1,354 · +4.4% YoY. Source: county tax records.
Cash-flow waterfall
monthlySold comps — $/sqft
last 12 mo · ≤1 miLoading sold comps…