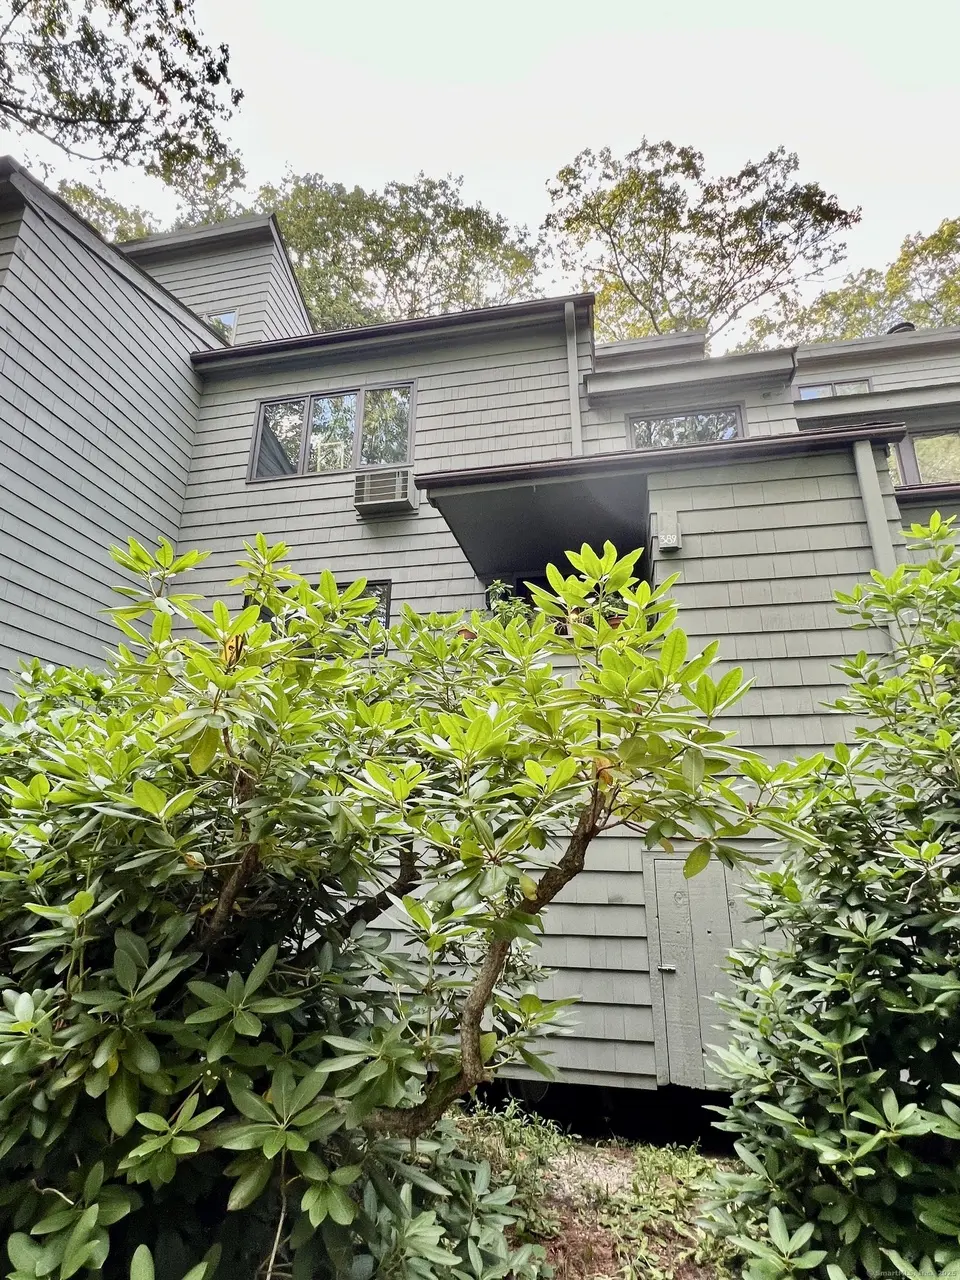
389 Trailsend Dr · Torrington, CT
Flood risk No data
- FEMA flood zone
- —
- Chance of flooding over 30 yrs
- —
- Est. flood insurance / yr
- —
Fire risk No data
- Est. fire insurance / yr
- —
Heat risk No data
- Hot days now (above threshold)
- —
- Hot days in 30 yrs
- —
Wind risk No data
- Chance of severe wind over 30 yrs
- —
Air-quality risk No data
- Unhealthy air days now
- —
- Unhealthy air days in 30 yrs
- —
Risk factors via First Street. Map © Google.
Why this score? — see what drove the D grade
The composite is a weighted blend of 9 inputs, each scored 0–100. Each bar is that input's sub-score; the figure is the points it added to the 100-point composite (weight × sub-score).
- Cash flow +12.2/30.0
- ARV discount +8.0/15.0
- 1% rule +5.3/10.0
- Rent growth +4.0/5.0
- Livability +3.8/5.0
- DSCR +3.6/10.0
- Schools +2.7/10.0
- Condition / age +2.5/5.0
- Appreciation +0.0/10.0
$225,000
🖨 Deal sheet (PDF) 📄 Offer letter ✓ Due diligence
Listing remarks MLS
Hearthstone model with beautifully remodelled kitchen. Hardwood flooring & recessed lighting throughout the main level. Living room has a wood burning stone fireplace surrounded by cabinetry, perfect for books, tv, etc. The dining room, open to living room & kitchen has an upgraded slider to large expanded deck. The kitchen has a breakfast bar and a peninsula with additional storage. Upstairs, the primary has a vaulted ceiling and its own bathroom. Two other bedrooms share a full bath. The attic has been converted and is accessed via a staircase. It is the perfect size for a home office. It also has additional storage under the eaves. Some windows have been upgraded and all are in excellent condition. The crawlspace can be accessed from both inside and outside. It has a cement floor and a finished cedar closet. There is a separate detached garage available for an additional cost.
Key facts
- Upgraded slider
- Converted attic
- Remodelled kitchen
Tags
Neighborhood map
What this means for you Summary
Snapshot
- This is a 3-bed/2.5-bath condo listed at $225k.
Deal economics
- At list price, monthly cash flow is $-44 ($-528/yr) — negative.
- To cash-flow at today's rent, offer at most $217k (3.5% below list).
- Meets the 1% rule at list price ($2k rent vs $225k).
- Recommended offer: $198k (12.0% below list) — sets the bar for market timing.
- Cap rate 6.1% vs local median 4.0% in Torrington — top-decile yield for the area; either an underpriced asset or a hidden risk that comps aren't pricing in. Stress-test before assuming the spread holds.
Location & tenants
- Location reads 76/100 on livability (#53 in CT, #3,449 nationally) — a middle-class / working-renter tenant base. Strengths: crime A+, cost of living A+, housing A+; Watch: commute F.
- Torrington School District (town): math 22% / reading 39% proficiency, ranked #125 of 153 in CT (top 82%) — families likely to look elsewhere, expect single-tenant / working-renter base with shorter leases.
- Zoned schools: Torringford School (math 32% / reading 32%, grade F, #361 of 553 statewide, top 68%, 612 students, 62% FRL); Torrington Middle School (math 18% / reading 39%, grade F, #146 of 175 statewide, top 84%, 975 students, 61% FRL); Torrington High School (math 22% / reading 47%, grade F, #121 of 194 statewide, top 64%, 1,010 students, 57% FRL) — zoned schools average 60% FRL vs 40% district-wide (20 pts higher); higher-poverty schools than district average — tighter screening recommended.
- Market conditions: Rents rising fast (+5.9%/yr); 189 active listings in the ZIP; 1 comparable units currently listed for rent nearby; 154 units permitted in Northwest Hills Planning Region in 2024 (6 in 5+ unit buildings).
- This rent runs 39% of the median local income ($71k/yr) — at the standard rent-burdened threshold; future hikes will face affordability resistance.
Forward outlook
- Local home prices are declining (-3.0%/yr); year-one equity from $2k of loan paydown is wiped out by about $7k of value loss. Plan a longer hold.
Negotiation context
- It's been on market 309 days — a 12% lower offer ($198k) is reasonable based on typical stale-listing flexibility.
Questions for the listing agent
- What do current leases actually rent for vs. the listed asking? Can we see a recent rent roll and the last 12 months of T-12 income?
- It's been on market 309 days. Have you received any prior offers? Is the seller open to a 12% concession, seller financing, or rate buy-down credit?
- What does the HOA fee cover, when was the last increase, and are there any pending special assessments or reserve-fund shortfalls?
- Any open or pending special assessments — roof, HVAC, plumbing, elevator, façade? What's the per-unit balance and payoff schedule, and is the seller paying it off at close or rolling it to the buyer?
- Why hasn't it sold? Are there any deal-killer items the seller is aware of (foundation, flood, title, zoning, code violations)?
- Is there a deadline driving the sale (1031 exchange, divorce, estate, relocation)? That informs how much negotiation room exists.
- Schools are D-rated, which usually means shorter tenancies and higher turnover. Who's the typical renter profile here, and what's been the actual vacancy rate?
- The area grade is low — what's the realistic commute time and amenity access for the typical tenant pool here? Any planned neighborhood developments (good or bad) we should know about?
- What's the average days-on-market for RENTAL listings here right now (not sales)? A rising rental-DOM trend means longer vacancies and softer asking-rent achievability than the comps imply.
- What's the recent tenant-quality profile in this submarket — average credit score on applications, eviction rate, late-payment / NSF rate, and stable-employment percentage? A property-management company in the area should have these aggregated.
- How much new apartment / multifamily construction is in the pipeline within 1–3 miles? Heavy new supply (>2% of stock underway) typically softens rents 12–24 months out; light construction supports rent growth.
Investment metrics
- 1% rule
- 1.03% ✓
- Cap rate
- 6.06%
- Cash-on-cash
- -0.84%
- DSCR
- 0.96
- GRM
- 8.1
CMA / ARV
- ARV (median comp)
- $227,439
- List price
- $225,000
- Delta
- -1.07%
- Verdict
- FAIR
- Comps
- 20 within 1.0 mi
Projected returns pro-forma
-3.0% appreciation · 5.89% rent growth · sell at horizon
- IRR
- -13.8%
- Equity multiple
- 0.49×
- Total profit
- $-32,128
- Equity at exit
- $33,548
- IRR
- -0.1%
- Equity multiple
- 0.99×
- Total profit
- $-582
- Equity at exit
- $19,454
Cash invested: $63,000 (down + closing). Projections, not guarantees.
Landlord ↔ Tenant lean methodology
- Overall (STATE)
- 27 Tenant-Leaning
- State Connecticut
- 27 Tenant-Leaning · D+7
- County
- — inherits STATE
- City
- — inherits STATE
ZIP-level market 06790
- Rents YoY
- 5.9%
- Active inventory
- 189
- Price-to-rent
- 8.1×
Monthly cashflow live
- Estimated rent
- $2,309 medium interval (Pro) →
- Mortgage (P&I)
- −$1,180
- Tax from tax record
- −$215 /mo · $2,585/yr
- Insurance
- −$94
- HOA
- −$379
- Vacancy / Maint / Mgmt
- −$485
- Net cashflow
- $-44
Break-even live
Sensitivity live
| Price | -10% $83 | -5% $20 | +0% $-44 | +5% $-108 | +10% $-171 |
|---|---|---|---|---|---|
| Rent | -10% $-226 | -5% $-135 | +0% $-44 | +5% $47 | +10% $138 |
| Rate | -1.0pp $69 | -0.5pp $13 | base $-44 | +0.5pp $-102 | +1.0pp $-162 |
UW: 25.0% down · 7.5% · 30yr · 1.5% tax · 5.0% vac · 8.0% maint · 8.0% mgmt
Financing live
Cash to close
- Down payment
- $56,250
- Closing costs
- $6,750
- Reserves months
- —
- Total cash needed
- —
Loan-product check · same deal, 3 products live
Conventional
25% down · 7.5% · 30yr
- Down + closing
- —
- Monthly P&I
- —
- Monthly cashflow
- —
- DSCR
- —
- Eligible?
- —
Personal DTI + credit; lowest rate.
DSCR
20% down · 8.5% · 30yr
- Down + closing
- —
- Monthly P&I
- —
- Monthly cashflow
- —
- DSCR
- —
- Eligible?
- —
No personal income docs; deal must DSCR.
Hard money
10% down · 12.0% · 12mo
- Down + closing
- —
- Monthly P&I
- —
- Monthly cashflow
- —
- DSCR
- —
- Eligible?
- —
Short-term bridge; refi at stabilization.
Rent comps 1 comps
| Address | Beds | Baths | Sqft | Rent | $/sqft | DOM | Units | Dist |
|---|---|---|---|---|---|---|---|---|
| 355 Ledge Dr #355 Torrington, CT | 3.0 | 2.0 | 1410 | $6,000 | $4.26 | 45d | 1 | 0.26mi |
HOA detail condo
- Monthly dues
- $379 · $4,548/yr
- Assessments
- None detected in remarks — confirm with the listing agent.
Listing history 20 events
-
2026-06-21days on market $225,000 Active 309 DOM
-
2026-06-19days on market $225,000 Active 307 DOM
-
2026-06-18days on market $225,000 Active 306 DOM
-
2026-06-17days on market $225,000 Active 305 DOM
-
2026-06-16days on market $225,000 Active 304 DOM
-
2026-06-15days on market $225,000 Active 303 DOM
-
2026-06-14days on market $225,000 Active 301 DOM
-
2026-06-13days on market $225,000 Active 300 DOM
-
2026-06-10days on market $225,000 Active 298 DOM
-
2026-06-09days on market $225,000 Active 297 DOM
-
2026-06-08days on market $225,000 Active 296 DOM
-
2026-06-07days on market $225,000 Active 295 DOM
-
2026-06-05days on market $225,000 Active 292 DOM
-
2026-06-03days on market $225,000 Active 291 DOM
-
2026-06-02days on market $225,000 Active 290 DOM
-
2026-06-01days on market $225,000 Active 289 DOM
-
2026-05-31days on market $225,000 Active 288 DOM
-
2026-05-30days on market $225,000 Active 287 DOM
-
2026-01-08price $225,000 900-char remark
Show marketing remark (900 chars)
Hearthstone model with beautifully remodelled kitchen. Hardwood flooring & recessed lighting throughout the main level. Living room has a wood burning stone fireplace surrounded by cabinetry, perfect for books, tv, etc. The dining room, open to living room & kitchen has an upgraded slider to large expanded deck. The kitchen has a breakfast bar and a peninsula with additional storage. Upstairs, the primary has a vaulted ceiling and its own bathroom. Two other bedrooms share a full bath. The attic has been converted and is accessed via a staircase. It is the perfect size for a home office. It also has additional storage under the eaves. Some windows have been upgraded and all are in excellent condition. The crawlspace can be accessed from both inside and outside. It has a cement floor and a finished cedar closet. There is a separate detached garage available for an additional cost.
-
2025-08-15$250,000 Active 900-char remark
Show marketing remark (900 chars)
Hearthstone model with beautifully remodelled kitchen. Hardwood flooring & recessed lighting throughout the main level. Living room has a wood burning stone fireplace surrounded by cabinetry, perfect for books, tv, etc. The dining room, open to living room & kitchen has an upgraded slider to large expanded deck. The kitchen has a breakfast bar and a peninsula with additional storage. Upstairs, the primary has a vaulted ceiling and its own bathroom. Two other bedrooms share a full bath. The attic has been converted and is accessed via a staircase. It is the perfect size for a home office. It also has additional storage under the eaves. Some windows have been upgraded and all are in excellent condition. The crawlspace can be accessed from both inside and outside. It has a cement floor and a finished cedar closet. There is a separate detached garage available for an additional cost.
ⓘ Source: listings_history table (triggers on properties + properties_extension) + one-shot
backfill from property_details.listing_events for pre-trigger history.
Tax reassessment forecast CT · Partial reset (capped growth)
- Current annual tax
- $2,585 · $215/mo
- Projected year-2 tax
- $3,700 · $308/mo
- Expected delta
- +$1,115/yr (+$93/mo · 43.1%)
ⓘ Screening estimate from a state-policy table — verify with the county assessor before closing.
Nearby sold comps map
Loading sold comps map…
Walkable amenities ~0.75 mi
Loading nearby amenities…
Taxation est. · year 1
- Rental income
- $27,708
- − Mortgage interest
- −$12,603
- − Property taxes
- −$2,585
- − Insurance
- −$1,125
- − Repairs & maintenance
- −$2,217
- − Management
- −$2,217
- − HOA
- −$4,548
- − Depreciation
- −$6,545
- Taxable loss
- −$4,133
- Est. tax savings @ 24.0%
- +$992
- After-tax cash flow
- $464/yr
For passive investors: Depreciation is non-cash, so a rental often shows a tax loss while cash-flowing — sheltering income. Rental losses are passive: they offset passive income freely, and up to $25,000/yr can offset ordinary (W-2) income if you actively participate and your MAGI is under $100k (phasing out to $0 by $150k); unused losses carry forward. On sale, claimed depreciation is recaptured at up to 25%, and gains may owe capital-gains tax (a 1031 exchange can defer both). Figures are a year-1 estimate at your 24.0% rate — not tax advice; consult a CPA.
Schools (NCES district)
- District
- Torrington School District
- NCES district ID
- 0904590
- Math proficiency
- 22% ▼ -8.00%
- Reading proficiency
- 39% ▼ -6.00%
- Median HH income
- $53,647
- Composite
- 26.9/100
- National rank
- #7087
- State rank
- #125 of 153 in CT
Livability — Torrington
- Score
- 76/100
- State rank
- #53
- US rank
- #3449
Category grades
Schools grade is shown separately in the Schools card above.
Census & demographics
- Census place
- Torrington, CT
- County
- Litchfield County · 81,203 people
- City population
- 35,566
- Metro
- Torrington, CT
- Population (ZIP)
- 35,566
- Household income
- $70,912
- Rent vs Own
- Severe rent burden
- 1401.0
Population outlook (Northwest Hills County) Hauer SSP2
- By 2040
- 118,998
Race, ethnicity, and origin ACS 2023
- Neighborhood character
- Predominantly White (73%)
- Race & ethnicity
- White 73% Hispanic / Latino 14% Two or more races 8% Black 6% Asian 3%
- Hispanic origin (detail)
- Puerto Rican 5% Dominican 2%
- Common ancestry
- Romanian 8% Lithuanian 5% Slovak 2%
- Foreign-born
- 12% · Canada, South Korea, Jamaica
- Languages at home
- 86% English-only · Spanish 8% Other Indo-European 2% Russian/Polish/Slavic 1%
Political lean MEDSL · Northwest Hills
- 2024 margin
- Toss-up / Even · D 48.6% · R 49.9% · Other 1.6%
- All cycles
- 2024: R+1.3
Not yet ingested
- Civics
- —
Market trends
- HPI YoY
- ▼ -122.78%
- Current HPI
- 208.4818
- Rent YoY
- ▲ 5.89%
- Metro
- Torrington, CT
- State GDP YoY
- ▲ 1.06%
- F500 in state
- 38
Industry mix (Fortune 500 HQ in CT)
| Industry | F500 HQs | Revenue |
|---|---|---|
| Industrial Machinery | 4 | $38B |
|
||
| Insurance | 3 | $71B |
|
||
| Financial Services | 2 | $25B |
|
||
| Transportation / Logistics | 2 | $18B |
|
||
| Healthcare | 1 | $247B |
|
||
| Telecommunications | 1 | $55B |
|
||
Price history
-10.0% since first listed2 events — show timeline
- 2026-01-08 Price Changed $225,000 Smart MLS
- 2025-08-15 Listed $250,000 Smart MLS
Property tax history
-5.0%/yrLatest (2023): $2,585 · +1.7% YoY. Source: county tax records.
Cash-flow waterfall
monthlySold comps — $/sqft
last 12 mo · ≤1 miLoading sold comps…