 Triplex
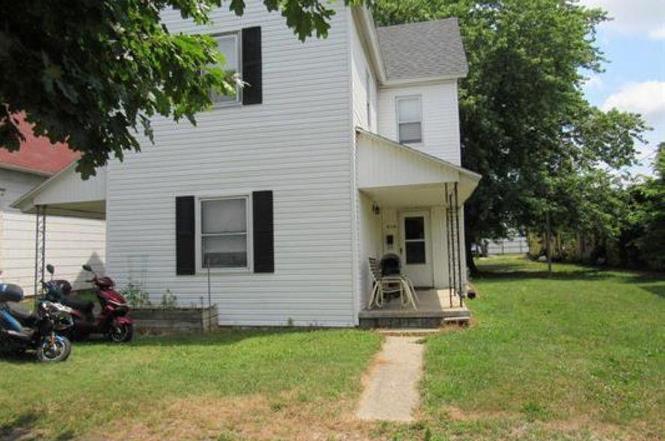
914 S Market St · Kokomo, IN
Flood risk 1/10 · Minimal
- FEMA flood zone
- X (unshaded)
- Chance of flooding over 30 yrs
- 0.0%
- Est. flood insurance / yr
- $507 – $1,088
Fire risk 1/10 · Minimal
- Est. fire insurance / yr
- $717 – $1,331
Heat risk 3/10 · Minor
- Hot days now (above 102°F)
- 7 days/yr
- Hot days in 30 yrs
- 17 days/yr
Wind risk 2/10 · Minimal
- Chance of severe wind over 30 yrs
- —
Air-quality risk 3/10 · Minor
- Unhealthy air days now
- 2 days/yr
- Unhealthy air days in 30 yrs
- 3 days/yr
Risk factors via First Street. Map © Google.
Why this score? — see what drove the B+ grade
The composite is a weighted blend of 9 inputs, each scored 0–100. Each bar is that input's sub-score; the figure is the points it added to the 100-point composite (weight × sub-score).
- Cash flow +30.0/30.0
- ARV discount +15.0/15.0
- 1% rule +10.0/10.0
- DSCR +10.0/10.0
- Livability +3.4/5.0
- Rent growth +3.0/5.0
- Condition / age +2.5/5.0
- Schools +2.1/10.0
- Appreciation +0.0/10.0
$125,000
🖨 Deal sheet 📄 Offer letter ✓ Due diligence
Multi-family units
County records classify this as Multi-Family (2-4 Unit). Listing-text estimate: 3 units. confirmed
Listing remarks
INVESTORS DELIGHT - Looking for a 3 Unit to enhance your portfolio? Look no more. All units are 1 Bedroom. Seller pays for gas that is for the hot water heater only, water and sanitation. Term of leases are month to month. All 3 units are occupied. Units are being sold in "As Is" condition. Street Parking.
Key facts
- 3 unit
- 2 br
- 1 br
Tags
Property features AI
Finance
- Other: Breed restrictions for pets
Exterior
- Utilities: Public water; Public sewer; Cable available
- Home design: Residential income property (triplex); Single-story
- Construction: Aluminum siding
- Exterior features: Level lot; Lot dimensions approximately 55 x 150
Interior
- Kitchen: Range; Refrigerator
- Flooring: Carpet
- Bathrooms: Three full bathrooms (all on the main level)
- Heating & cooling: Electric heating
- Interior features: Range and refrigerator included; Carpet flooring; Crawl space basement
Neighborhood map
What this means for you Summary
Snapshot
- This is a 3 × 1-bed/1.0-bath units multifamily listed at $125k.
Deal economics
- At list price, monthly cash flow is $1k ($14k/yr) — positive. Per door: $391/mo.
- The deal already cash-flows at list — no discount required.
- Meets the 1% rule at list price ($3k rent vs $125k).
- Recommended offer: $110k (12.0% below list) — sets the bar for market timing.
- Cap rate 17.6% vs local median 5.2% in Kokomo — top-decile yield for the area; either an underpriced asset or a hidden risk that comps aren't pricing in. Stress-test before assuming the spread holds.
Location & tenants
- Location reads 68/100 on livability (#227 in IN) — a middle-class / working-renter tenant base. Strengths: cost of living A+, housing A+, health & safety A; Watch: crime D, amenities F, commute F.
- Kokomo School Corporation (urban): math 22% / reading 30% proficiency, ranked #264 of 301 in IN (top 88%) — low school quality limits family demand, transient renter base, plan for 1-2y turnover; 62% free/reduced lunch — lower-income household profile, screen leases tightly.
- Zoned schools: Sycamore Elementary School (math 32% / reading 27%, grade F, #697 of 994 statewide, top 73%, 401 students, 75% FRL); Maple Crest Middle School (math 10% / reading 16%, grade F, #304 of 330 statewide, top 94%, 372 students, 77% FRL); Kokomo High School (math 19% / reading 48%, grade F, #289 of 369 statewide, top 78%, 1,519 students, 58% FRL).
- Market conditions: Rents rising (+1.8%/yr); 232 active listings in the ZIP; 194 units permitted in Howard County in 2024 (0 in 5+ unit buildings).
- At $2,569/mo this rent would consume 50% of the median local household income ($62k/yr) (locally 1262% of renters already pay >50% of income on rent) — very limited rent-growth headroom before tenants either downsize or default.
Forward outlook
- Local home prices are declining (-3.0%/yr); year-one equity from $864 of loan paydown is wiped out by about $4k of value loss. Plan a longer hold.
- Howard County population projected at -11% by 2050 — secular population decline; favor cash flow + early exit over multi-decade hold.
- At projected returns (-3.0% appreciation + 1.8% rent growth), your $35k cash investment doubles in ~3 years — after that, you're playing with house money.
Negotiation context
- It's been on market 336 days — a 12% lower offer ($110k) is reasonable based on typical stale-listing flexibility.
Risks & watch-outs
- Watch-outs: built in 1890 — expect roof / HVAC / electrical / plumbing capex.
Questions for the listing agent
- It's been on market 336 days. Have you received any prior offers? Is the seller open to a 12% concession, seller financing, or rate buy-down credit?
- Can we see the unit-by-unit rent roll, current vacancy, and any below-market leases? What's the average tenancy length?
- What capital expenditures (roof, boiler, parking lot, exteriors) have been made in the last 5 years, and what's planned in the next 2?
- Built in 1890 — when were the roof, HVAC, electrical panel, plumbing, and water heater last replaced?
- Why hasn't it sold? Are there any deal-killer items the seller is aware of (foundation, flood, title, zoning, code violations)?
- Is there a deadline driving the sale (1031 exchange, divorce, estate, relocation)? That informs how much negotiation room exists.
- Schools are F-rated, which usually means shorter tenancies and higher turnover. Who's the typical renter profile here, and what's been the actual vacancy rate?
- Crime grade is D in this area — have there been break-ins, vandalism, or insurance claims at this property in the last 3 years? What carrier currently insures it and at what premium?
- What's the average days-on-market for RENTAL listings here right now (not sales)? A rising rental-DOM trend means longer vacancies and softer asking-rent achievability than the comps imply.
- What's the recent tenant-quality profile in this submarket — average credit score on applications, eviction rate, late-payment / NSF rate, and stable-employment percentage? A property-management company in the area should have these aggregated.
- How much new apartment / multifamily construction is in the pipeline within 1–3 miles? Heavy new supply (>2% of stock underway) typically softens rents 12–24 months out; light construction supports rent growth.
Investment metrics
- 1% rule
- 2.06% ✓
- Cap rate
- 17.56%
- Cash-on-cash
- 40.23%
- DSCR
- 2.79
- GRM
- 4.1
CMA / ARV
- ARV (on-the-fly)
- $150,612
- Comps found
- 4
Show comp detail 4 sales within ~0.75 mi
| Address | Dist | Beds/Ba | Sqft | Sold | Price | $/sf | Match |
|---|---|---|---|---|---|---|---|
| 820 S Market St | 0.03mi | 5/2.0 (+1) | 2,168 (+11%) | 7mo | $153,500 | $71 | 66 |
| 409 W State St | 0.54mi | 4/3.0 | 1,984 (+1%) | 19mo | $190,000 | $96 | 56 |
| 921 S Buckeye St | 0.24mi | 5/4.0 (+1) | 2,218 (+13%) | 2mo | $170,000 | $77 | 56 |
| 418 & 420 W Park Ave | 0.61mi | 4/2.0 | 1,850 (-5%) | 7mo | $42,000 | $23 | 52 |
Match score weights: distance 35% · size 25% · config 20% · recency 20%. Top-matched comps best support the ARV.
Projected returns pro-forma
-3.0% appreciation · 1.8% rent growth · sell at horizon
- IRR
- 35.3%
- Equity multiple
- 2.47×
- Total profit
- $51,449
- Equity at exit
- $18,638
- IRR
- 41.4%
- Equity multiple
- 4.68×
- Total profit
- $128,894
- Equity at exit
- $10,808
Cash invested: $35,000 (down + closing). Projections, not guarantees.
Landlord ↔ Tenant lean methodology
- Overall (STATE)
- 90 Strongly Landlord-Friendly
- State Indiana
- 90 Strongly Landlord-Friendly · R+11
- County
- — inherits STATE
- City
- — inherits STATE
ZIP-level market 46902
- Home prices YoY
- -20.7%
- Rents YoY
- 1.8%
- Active inventory
- 232
- Price-to-rent
- 12.2×
Monthly cashflow live
- Estimated rent
- $2,569 medium interval (Pro) →
- Mortgage (P&I)
- −$656
- Tax from tax record
- −$148 /mo · $1,782/yr
- Insurance
- −$52
- HOA
- −$0
- Vacancy / Maint / Mgmt
- −$539
- Net cashflow
- $1,173
Break-even live
3-unit breakdown (identical units grouped — click to expand)
| Units | Beds | Baths | Est. rent |
|---|---|---|---|
| 3× units | 1 | 1 | $2,568 |
| #1 | 1 | 1 | $856 |
| #2 | 1 | 1 | $856 |
| #3 | 1 | 1 | $856 |
| Total (3 units) | $2,569 | ||
UW: 25.0% down · 7.5% · 30yr · 1.5% tax · 5.0% vac · 8.0% maint · 8.0% mgmt
Financing live
Cash to close
- Down payment
- $31,250
- Closing costs
- $3,750
- Reserves months
- —
- Total cash needed
- —
Loan-product check · same deal, 3 products live
Conventional
25% down · 7.5% · 30yr
- Down + closing
- —
- Monthly P&I
- —
- Monthly cashflow
- —
- DSCR
- —
- Eligible?
- —
Personal DTI + credit; lowest rate.
DSCR
20% down · 8.5% · 30yr
- Down + closing
- —
- Monthly P&I
- —
- Monthly cashflow
- —
- DSCR
- —
- Eligible?
- —
No personal income docs; deal must DSCR.
Hard money
10% down · 12.0% · 12mo
- Down + closing
- —
- Monthly P&I
- —
- Monthly cashflow
- —
- DSCR
- —
- Eligible?
- —
Short-term bridge; refi at stabilization.
Listing history 18 events
-
2026-06-19days on market $125,000 Active 336 DOM
-
2026-06-18days on market $125,000 Active 335 DOM
-
2026-06-17days on market $125,000 Active 334 DOM
-
2026-06-16days on market $125,000 Active 333 DOM
-
2026-06-15days on market $125,000 Active 332 DOM
-
2026-06-14days on market $125,000 Active 330 DOM
-
2026-06-13days on market $125,000 Active 329 DOM
-
2026-06-10days on market $125,000 Active 327 DOM
-
2026-06-09days on market $125,000 Active 326 DOM
-
2026-06-08days on market $125,000 Active 325 DOM
-
2026-06-07days on market $125,000 Active 324 DOM
-
2026-06-02days on market $125,000 Active 319 DOM
-
2026-06-01days on market $125,000 Active 318 DOM
-
2026-05-31days on market $125,000 Active 317 DOM
-
2026-05-30days on market $125,000 Active 316 DOM
-
2025-09-29price $125,000
-
2025-08-04price $135,000
-
2025-07-18$145,000 Active
ⓘ Source: listings_history table (triggers on properties + properties_extension) + one-shot
backfill from property_details.listing_events for pre-trigger history.
Tax reassessment forecast IN · Partial reset (capped growth)
- Current annual tax
- $1,782 · $148/mo
- Projected year-2 tax
- $1,782 · $148/mo
- Expected delta
- $0/yr ($0/mo · 0.0%)
ⓘ Screening estimate from a state-policy table — verify with the county assessor before closing.
Climate risk First Street
- Flood 1/10 Low FEMA zone X (unshaded) · 0% chance over 30 yrs
- Wildfire 1/10 Low
- Heat 3/10 Moderate 7 d/yr ≥102°F today · 17 d/yr by 30 yrs out
- Wind 2/10 Low
- Air quality 3/10 Moderate 2 unhealthy d/yr today · 3 by 30 yrs out
Nearby sold comps map
Loading sold comps map…
Walkable amenities ~0.75 mi
Loading nearby amenities…
Taxation est. · year 1
- Rental income
- $30,828
- − Mortgage interest
- −$7,002
- − Property taxes
- −$1,782
- − Insurance
- −$625
- − Repairs & maintenance
- −$2,466
- − Management
- −$2,466
- − Depreciation
- −$3,636
- Taxable income
- $12,850
- Est. tax owed @ 24.0%
- −$3,084
- After-tax cash flow
- $10,997/yr
For passive investors: Depreciation is non-cash, so a rental often shows a tax loss while cash-flowing — sheltering income. Rental losses are passive: they offset passive income freely, and up to $25,000/yr can offset ordinary (W-2) income if you actively participate and your MAGI is under $100k (phasing out to $0 by $150k); unused losses carry forward. On sale, claimed depreciation is recaptured at up to 25%, and gains may owe capital-gains tax (a 1031 exchange can defer both). Figures are a year-1 estimate at your 24.0% rate — not tax advice; consult a CPA.
Schools (NCES district)
- District
- Kokomo School Corporation
- NCES district ID
- 1805370
- Math proficiency
- 22% ▼ -8.00%
- Reading proficiency
- 30% ▼ -5.00%
- Median HH income
- $35,804
- Composite
- 21.5/100
- National rank
- #8325
- State rank
- #264 of 301 in IN
Livability — Kokomo
- Score
- 68/100
- State rank
- #227
- US rank
- #9912
Category grades
Schools grade is shown separately in the Schools card above.
Census & demographics
- Census place
- Kokomo, IN
- County
- Howard County · 75,099 people
- City population
- 75,099
- Metro
- Kokomo, IN
- Population (ZIP)
- 37,017
- Household income
- $62,126
- Rent vs Own
- Severe rent burden
- 1262.0
Population outlook (Howard County) Hauer SSP2
- Today (2025)
- 81,522 people
- By 2030
- 80,104 · -1.7%
- By 2040
- 76,708 · -5.9%
- By 2050
- 72,880 · -10.6%
- By 2075
- 64,016 · -21.5%
- By 2100
- 51,705 · -36.6%
Race, ethnicity, and origin ACS 2023
- Neighborhood character
- Predominantly White (81%)
- Race & ethnicity
- White 81% Black 9% Two or more races 5% Hispanic / Latino 4% Asian 3%
- Common ancestry
- Italian 2% Lithuanian 1% Slovak 1%
- Foreign-born
- 3% · Canada, Vietnam, China
- Languages at home
- 96% English-only · Vietnamese 1% Other Asian/Pacific 1% Spanish 1%
Political lean MEDSL · Howard
- 2024 margin
- Solid R (+35.3) · D 31.4% · R 66.7% · Other 1.8%
- 2008→2024 swing
- -29.1pp toward R · 2008: -6.2pp · 2024: -35.3pp
- All cycles
- 2024: R+35.3 2020: R+32.4 2016: R+33.9 2012: R+14.3 2008: R+6.2
Not yet ingested
- Civics
- —
Market trends
- HPI YoY
- ▼ -61.76%
- Current HPI
- 236.8237
- Rent YoY
- ▲ 1.80%
- Metro
- Kokomo, IN
- State GDP YoY
- ▲ 2.90%
- F500 in state
- 18
Industry mix (Fortune 500 HQ in IN)
| Industry | F500 HQs | Revenue |
|---|---|---|
| Industrial Machinery | 2 | $37B |
|
||
| Healthcare | 1 | $177B |
|
||
| Pharmaceuticals | 1 | $45B |
|
||
| Metals / Steel | 1 | $18B |
|
||
| Agriculture | 1 | $17B |
|
||
| Packaging | 1 | $12B |
|
||
Price history
-13.8% since first listed3 events — show timeline
- 2025-09-29 Price Changed $125,000 IRMLS
- 2025-08-04 Price Changed $135,000 IRMLS
- 2025-07-18 Listed $145,000 IRMLS
Property tax history
+6.7%/yrLatest (2024): $1,782 · +11.8% YoY. Source: county tax records.
Cash-flow waterfall
monthlySold comps — $/sqft
last 12 mo · ≤1 miLoading sold comps…