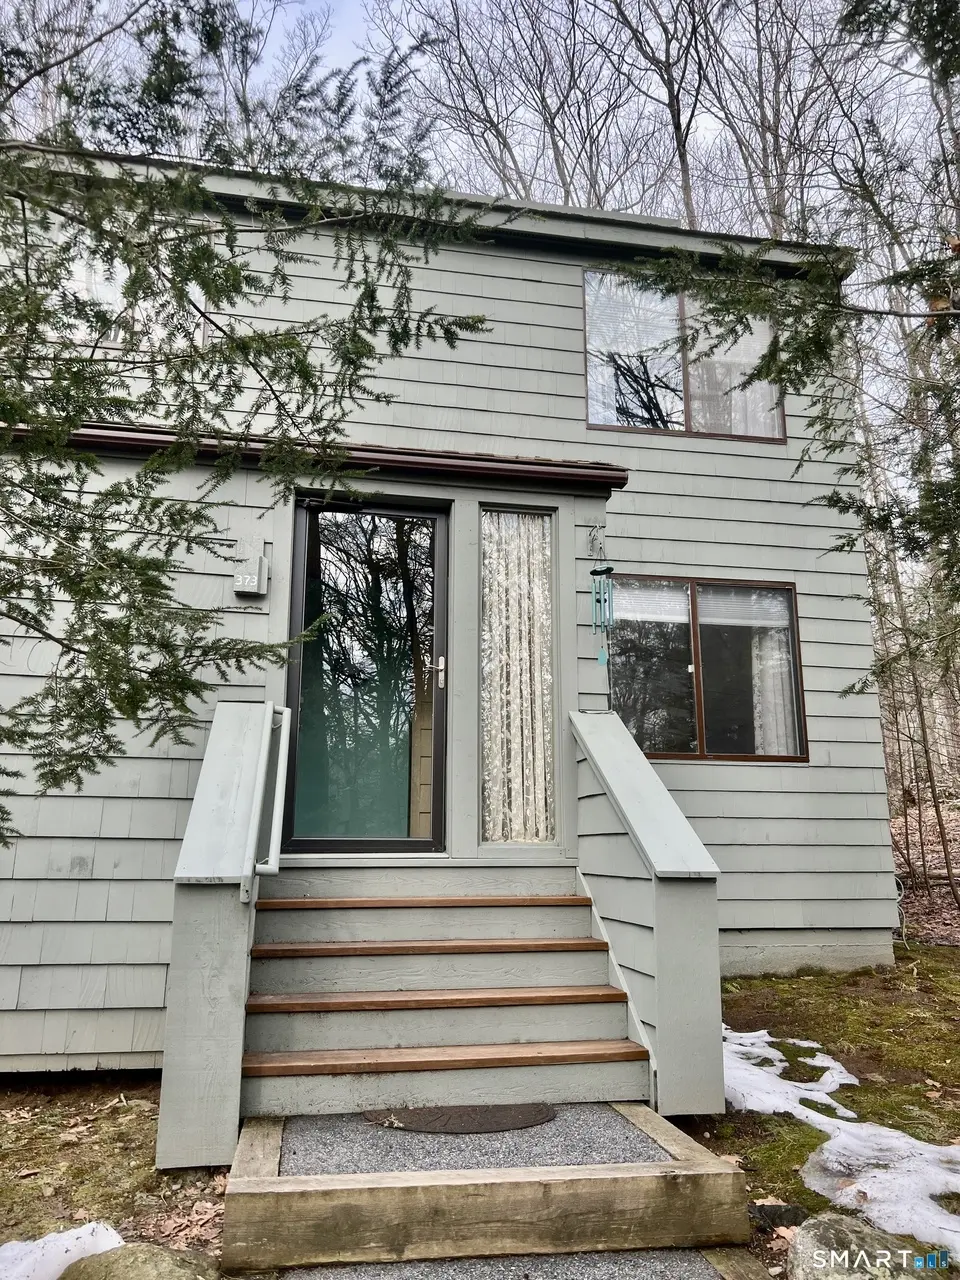
373 Trailsend Dr · Torrington, CT
Flood risk No data
- FEMA flood zone
- —
- Chance of flooding over 30 yrs
- —
- Est. flood insurance / yr
- —
Fire risk No data
- Est. fire insurance / yr
- —
Heat risk No data
- Hot days now (above threshold)
- —
- Hot days in 30 yrs
- —
Wind risk No data
- Chance of severe wind over 30 yrs
- —
Air-quality risk No data
- Unhealthy air days now
- —
- Unhealthy air days in 30 yrs
- —
Risk factors via First Street. Map © Google.
Why this score? — see what drove the D grade
The composite is a weighted blend of 9 inputs, each scored 0–100. Each bar is that input's sub-score; the figure is the points it added to the 100-point composite (weight × sub-score).
- Cash flow +11.9/30.0
- ARV discount +7.2/15.0
- 1% rule +5.1/10.0
- Rent growth +4.0/5.0
- Livability +3.8/5.0
- DSCR +3.5/10.0
- Schools +2.7/10.0
- Condition / age +2.5/5.0
- Appreciation +0.0/10.0
$229,000
🖨 Deal sheet 📄 Offer letter ✓ Due diligence
Listing remarks MLS
3-bedroom Woodhaven model in excellent condition. Bedroom and full bath on main level. Living room has a pellet stove insert and a split system for heat & a/c. It also has a half-vaulted ceiling with a ceiling fan & skylight. Engineered hardwood throughout the main level. Sliders from dining room to a large expanded deck. Upstairs you have the primary bedroom with vaulted ceiling and another bedroom. The laundry is on this level. The attic has been finished off & has a skylight and a/c unit. There is also extra storage space. This end unit is a 3-minute walk to the indoor lodge for swimming/tennis/pickle ball/exercise room and the large recreation area.
Key facts
- Finished attic
- Large expanded deck
- Engineered hardwood
Tags
Neighborhood map
What this means for you Summary
Snapshot
- This is a 3-bed/2.0-bath condo listed at $229k.
Deal economics
- At list price, monthly cash flow is $-60 ($-716/yr) — negative.
- To cash-flow at today's rent, offer at most $218k (4.6% below list).
- Meets the 1% rule at list price ($2k rent vs $229k).
- Recommended offer: $208k (9.0% below list) — sets the bar for market timing.
- Cap rate 6.0% vs local median 3.9% in Torrington — top-decile yield for the area; either an underpriced asset or a hidden risk that comps aren't pricing in. Stress-test before assuming the spread holds.
Location & tenants
- Location reads 76/100 on livability (#53 in CT, #3,449 nationally) — a middle-class / working-renter tenant base. Strengths: crime A+, cost of living A+, housing A+; Watch: schools D, commute F.
- Torrington School District (town): math 22% / reading 39% proficiency, ranked #125 of 153 in CT (top 82%) — families likely to look elsewhere, expect single-tenant / working-renter base with shorter leases.
- Market conditions: Rents rising fast (+5.9%/yr); 188 active listings in the ZIP; 1 comparable units currently listed for rent nearby; 154 units permitted in Northwest Hills Planning Region in 2024 (6 in 5+ unit buildings).
- This rent runs 39% of the median local income ($71k/yr) — at the standard rent-burdened threshold; future hikes will face affordability resistance.
Forward outlook
- Local home prices are declining (-3.0%/yr); year-one equity from $2k of loan paydown is wiped out by about $7k of value loss. Plan a longer hold.
Negotiation context
- It's been on market 100 days — a 9% lower offer ($208k) is reasonable based on typical stale-listing flexibility.
- Current owner paid $60k; list at $229k implies a 282% gain — meaningful room to come down on a strong offer.
Questions for the listing agent
- What do current leases actually rent for vs. the listed asking? Can we see a recent rent roll and the last 12 months of T-12 income?
- It's been on market 100 days. Have you received any prior offers? Is the seller open to a 9% concession, seller financing, or rate buy-down credit?
- Built in 1977 — when were the roof, HVAC, electrical panel, plumbing, and water heater last replaced?
- What does the HOA fee cover, when was the last increase, and are there any pending special assessments or reserve-fund shortfalls?
- Any open or pending special assessments — roof, HVAC, plumbing, elevator, façade? What's the per-unit balance and payoff schedule, and is the seller paying it off at close or rolling it to the buyer?
- Why hasn't it sold? Are there any deal-killer items the seller is aware of (foundation, flood, title, zoning, code violations)?
- Is there a deadline driving the sale (1031 exchange, divorce, estate, relocation)? That informs how much negotiation room exists.
- Schools are D-rated, which usually means shorter tenancies and higher turnover. Who's the typical renter profile here, and what's been the actual vacancy rate?
- The area grade is low — what's the realistic commute time and amenity access for the typical tenant pool here? Any planned neighborhood developments (good or bad) we should know about?
- What's the average days-on-market for RENTAL listings here right now (not sales)? A rising rental-DOM trend means longer vacancies and softer asking-rent achievability than the comps imply.
- What's the recent tenant-quality profile in this submarket — average credit score on applications, eviction rate, late-payment / NSF rate, and stable-employment percentage? A property-management company in the area should have these aggregated.
- How much new apartment / multifamily construction is in the pipeline within 1–3 miles? Heavy new supply (>2% of stock underway) typically softens rents 12–24 months out; light construction supports rent growth.
Investment metrics
- 1% rule
- 1.01% ✓
- Cap rate
- 5.98%
- Cash-on-cash
- -1.12%
- DSCR
- 0.95
- GRM
- 8.3
CMA / ARV
- ARV (median comp)
- $227,530
- List price
- $229,000
- Delta
- 0.65%
- Verdict
- FAIR
- Comps
- 20 within 1.0 mi
Projected returns pro-forma
-3.0% appreciation · 5.89% rent growth · sell at horizon
- IRR
- -14.2%
- Equity multiple
- 0.47×
- Total profit
- $-33,775
- Equity at exit
- $34,145
- IRR
- -0.6%
- Equity multiple
- 0.95×
- Total profit
- $-3,306
- Equity at exit
- $19,800
Cash invested: $64,120 (down + closing). Projections, not guarantees.
Landlord ↔ Tenant lean methodology
- Overall (STATE)
- 27 Tenant-Leaning
- State Connecticut
- 27 Tenant-Leaning · D+7
- County
- — inherits STATE
- City
- — inherits STATE
ZIP-level market 06790
- Rents YoY
- 5.9%
- Active inventory
- 188
- Price-to-rent
- 8.3×
Monthly cashflow live
- Estimated rent
- $2,311 medium interval (Pro) →
- Mortgage (P&I)
- −$1,201
- Tax from tax record
- −$209 /mo · $2,504/yr
- Insurance
- −$95
- HOA
- −$380
- Vacancy / Maint / Mgmt
- −$485
- Net cashflow
- $-60
Break-even live
UW: 25.0% down · 7.5% · 30yr · 1.5% tax · 5.0% vac · 8.0% maint · 8.0% mgmt
Financing live
Cash to close
- Down payment
- $57,250
- Closing costs
- $6,870
- Reserves months
- —
- Total cash needed
- —
Loan-product check · same deal, 3 products live
Conventional
25% down · 7.5% · 30yr
- Down + closing
- —
- Monthly P&I
- —
- Monthly cashflow
- —
- DSCR
- —
- Eligible?
- —
Personal DTI + credit; lowest rate.
DSCR
20% down · 8.5% · 30yr
- Down + closing
- —
- Monthly P&I
- —
- Monthly cashflow
- —
- DSCR
- —
- Eligible?
- —
No personal income docs; deal must DSCR.
Hard money
10% down · 12.0% · 12mo
- Down + closing
- —
- Monthly P&I
- —
- Monthly cashflow
- —
- DSCR
- —
- Eligible?
- —
Short-term bridge; refi at stabilization.
Rent comps 1 comps
| Address | Beds | Baths | Sqft | Rent | $/sqft | DOM | Units | Dist |
|---|---|---|---|---|---|---|---|---|
| 355 Ledge Dr #355 Torrington, CT | 3.0 | 2.0 | 1410 | $6,000 | $4.26 | 43d | 1 | 0.21mi |
HOA detail condo
- Monthly dues
- $380 · $4,560/yr
- Assessments
- None detected in remarks — confirm with the listing agent.
Listing history 22 events
-
2026-06-19days on market $229,000 Active 100 DOM
-
2026-06-18days on market $229,000 Active 99 DOM
-
2026-06-17days on market $229,000 Active 98 DOM
-
2026-06-16days on market $229,000 Active 97 DOM
-
2026-06-15days on market $229,000 Active 96 DOM
-
2026-06-14days on market $229,000 Active 94 DOM
-
2026-06-13days on market $229,000 Active 93 DOM
-
2026-06-10days on market $229,000 Active 91 DOM
-
2026-06-09days on market $229,000 Active 90 DOM
-
2026-06-08days on market $229,000 Active 89 DOM
-
2026-06-07days on market $229,000 Active 88 DOM
-
2026-06-05days on market $229,000 Active 85 DOM
-
2026-06-03days on market $229,000 Active 84 DOM
-
2026-06-02days on market $229,000 Active 83 DOM
-
2026-06-01days on market $229,000 Active 82 DOM
-
2026-05-31days on market $229,000 Active 81 DOM
-
2026-05-30days on market $229,000 Active 80 DOM
-
2026-05-01price $229,000 673-char remark
Show marketing remark (673 chars)
3-bedroom Woodhaven model in excellent condition. Bedroom and full bath on main level. Living room has a pellet stove insert and a split system for heat & a/c. It also has a half-vaulted ceiling with a ceiling fan & skylight. Engineered hardwood throughout the main level. Sliders from dining room to a large expanded deck. Upstairs you have the primary bedroom with vaulted ceiling and another bedroom. The laundry is on this level. The attic has been finished off & has a skylight and a/c unit. There is also extra storage space. This end unit is a 3-minute walk to the indoor lodge for swimming/tennis/pickle ball/exercise room and the large recreation area.
-
2026-03-11$250,000 Active 673-char remark
Show marketing remark (673 chars)
3-bedroom Woodhaven model in excellent condition. Bedroom and full bath on main level. Living room has a pellet stove insert and a split system for heat & a/c. It also has a half-vaulted ceiling with a ceiling fan & skylight. Engineered hardwood throughout the main level. Sliders from dining room to a large expanded deck. Upstairs you have the primary bedroom with vaulted ceiling and another bedroom. The laundry is on this level. The attic has been finished off & has a skylight and a/c unit. There is also extra storage space. This end unit is a 3-minute walk to the indoor lodge for swimming/tennis/pickle ball/exercise room and the large recreation area.
-
2014-10-20soldstatus $60,000
-
2010-09-27soldstatus $80,000
-
2001-02-02soldstatus $150,000
ⓘ Source: listings_history table (triggers on properties + properties_extension) + one-shot
backfill from property_details.listing_events for pre-trigger history.
Tax reassessment forecast CT · Partial reset (capped growth)
- Current annual tax
- $2,504 · $209/mo
- Projected year-2 tax
- $3,702 · $309/mo
- Expected delta
- +$1,198/yr (+$100/mo · 47.9%)
ⓘ Screening estimate from a state-policy table — verify with the county assessor before closing.
Nearby sold comps map
Loading sold comps map…
Walkable amenities ~0.75 mi
Loading nearby amenities…
Taxation est. · year 1
- Rental income
- $27,726
- − Mortgage interest
- −$12,828
- − Property taxes
- −$2,504
- − Insurance
- −$1,145
- − Repairs & maintenance
- −$2,218
- − Management
- −$2,218
- − HOA
- −$4,560
- − Depreciation
- −$6,662
- Taxable loss
- −$4,408
- Est. tax savings @ 24.0%
- +$1,058
- After-tax cash flow
- $342/yr
For passive investors: Depreciation is non-cash, so a rental often shows a tax loss while cash-flowing — sheltering income. Rental losses are passive: they offset passive income freely, and up to $25,000/yr can offset ordinary (W-2) income if you actively participate and your MAGI is under $100k (phasing out to $0 by $150k); unused losses carry forward. On sale, claimed depreciation is recaptured at up to 25%, and gains may owe capital-gains tax (a 1031 exchange can defer both). Figures are a year-1 estimate at your 24.0% rate — not tax advice; consult a CPA.
Schools (NCES district)
- District
- Torrington School District
- NCES district ID
- 0904590
- Math proficiency
- 22% ▼ -8.00%
- Reading proficiency
- 39% ▼ -6.00%
- Median HH income
- $53,647
- Composite
- 26.9/100
- National rank
- #7087
- State rank
- #125 of 153 in CT
Livability — Torrington
- Score
- 76/100
- State rank
- #53
- US rank
- #3449
Category grades
Schools grade is shown separately in the Schools card above.
Census & demographics
- Census place
- Torrington, CT
- County
- Litchfield County · 81,203 people
- City population
- 35,566
- Metro
- Torrington, CT
- Population (ZIP)
- 35,566
- Household income
- $70,912
- Rent vs Own
- Severe rent burden
- 1401.0
Population outlook (Northwest Hills County) Hauer SSP2
- By 2040
- 118,998
Race, ethnicity, and origin ACS 2023
- Neighborhood character
- Predominantly White (73%)
- Race & ethnicity
- White 73% Hispanic / Latino 14% Two or more races 8% Black 6% Asian 3%
- Hispanic origin (detail)
- Puerto Rican 5% Dominican 2%
- Common ancestry
- Romanian 8% Lithuanian 5% Slovak 2%
- Foreign-born
- 12% · Canada, South Korea, Jamaica
- Languages at home
- 86% English-only · Spanish 8% Other Indo-European 2% Russian/Polish/Slavic 1%
Political lean MEDSL · Northwest Hills
- 2024 margin
- Toss-up / Even · D 48.6% · R 49.9% · Other 1.6%
- All cycles
- 2024: R+1.3
Not yet ingested
- Civics
- —
Market trends
- HPI YoY
- ▼ -122.78%
- Current HPI
- 208.4818
- Rent YoY
- ▲ 5.89%
- Metro
- Torrington, CT
- State GDP YoY
- ▲ 1.06%
- F500 in state
- 38
Industry mix (Fortune 500 HQ in CT)
| Industry | F500 HQs | Revenue |
|---|---|---|
| Industrial Machinery | 4 | $38B |
|
||
| Insurance | 3 | $71B |
|
||
| Financial Services | 2 | $25B |
|
||
| Transportation / Logistics | 2 | $18B |
|
||
| Healthcare | 1 | $247B |
|
||
| Telecommunications | 1 | $55B |
|
||
Price history
+52.7% since first listed5 events — show timeline
- 2026-05-01 Price Changed $229,000 Smart MLS
- 2026-03-11 Listed $250,000 Smart MLS
- 2014-10-20 Sold (Public Records) $60,000 Public Records
- 2010-09-27 Sold (Public Records) $80,000 Public Records
- 2001-02-02 Sold (Public Records) $150,000 Public Records
Property tax history
-5.6%/yrLatest (2023): $2,504 · +1.7% YoY. Source: county tax records.
Cash-flow waterfall
monthlySold comps — $/sqft
last 12 mo · ≤1 miLoading sold comps…