1406 NW 19th St · Cape Coral, FL
Flood risk 4/10 · Minor
- FEMA flood zone
- X (unshaded)
- Chance of flooding over 30 yrs
- 0.22%
- Est. flood insurance / yr
- $507 – $1,088
Fire risk 5/10 · Moderate
- Est. fire insurance / yr
- $947 – $1,759
Heat risk 10/10 · Severe
- Hot days now (above 107°F)
- 6 days/yr
- Hot days in 30 yrs
- 25 days/yr
Wind risk 10/10 · Severe
- Chance of severe wind over 30 yrs
- 99.0%
Air-quality risk 2/10 · Minimal
- Unhealthy air days now
- 1 days/yr
- Unhealthy air days in 30 yrs
- 1 days/yr
Risk factors via First Street. Map © Google.
Why this score? — see what drove the F grade
The composite is a weighted blend of 9 inputs, each scored 0–100. Each bar is that input's sub-score; the figure is the points it added to the 100-point composite (weight × sub-score).
- Cash flow +10.8/30.0
- ARV discount +7.5/15.0
- Schools +4.1/10.0
- Livability +3.9/5.0
- DSCR +3.1/10.0
- Condition / age +2.5/5.0
- 1% rule +1.9/10.0
- Rent growth +1.1/5.0
- Appreciation +0.0/10.0
$325,000
🖨 Deal sheet (PDF) 📄 Offer letter ✓ Due diligence
Listing remarks
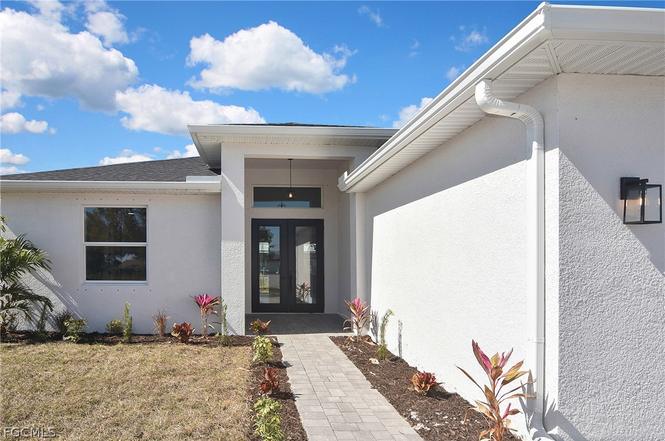
Come view this gorgeous brand-new home nestled in a quiet setting. Enjoy high ceilings & upgraded finishes in this 4 bed, 1,800 SF home. Luxurious showers are made for relaxation. Tray ceilings in living room & owner suite. Hardwood cabinets, energy efficient windows, granite countertops, 9'-wide wood look tile plank flooring throughout, paver driveway, impact front door, stainless steel appliances, ceiling fans throughout, & ample closet space all make this home an ideal place for a family to call home. No flood insurance required. Several parks nearby. Short drive to restaurants & shopping.
Key facts
- Luxurious showers
- Hardwood cabinets
- Upgraded finishes
Tags
Property features AI
Finance
- Financial info: Pets allowed
- HOA & community: No association fee listed
Exterior
- Parking: Attached 2-car garage; Driveway parking; Paved parking; Garage door opener
- Security: Smoke detectors
- Utilities: Well water; Septic tank; Cable available
- Home design: Single-story; New construction; South-facing; Entry level: 1
- Construction: Built with block, concrete and stucco; Shingle roof; New construction
- Exterior features: Security/high impact doors; Sprinkler/irrigation system (automatic); Patio; Room for pool; Open patio/porch; Porch
Interior
- Kitchen: Dishwasher; Disposal; Icemaker; Microwave; Range; Self-cleaning oven; Refrigerator (with ice maker)
- Bedrooms: Den
- Flooring: Tile
- Bathrooms: 2 full bathrooms
- Heating & cooling: Central heating (electric); Central air conditioning (electric); Ceiling fans
- Interior features: Breakfast bar; Tray ceilings; Dual sinks; Handicap access; Kitchen island; Multiple shower heads; Pantry; Cable TV; Walk-in pantry; Walk-in closets; Split bedroom floorplan; Single hung windows; Interior shutters; Unfurnished
- Laundry & utility: Washer hookup inside; Dryer hookup inside
Neighborhood map
What this means for you Summary
Snapshot
- This is a 4-bed/2.0-bath land listed at $325k.
Deal economics
- At list price, monthly cash flow is $-152 ($-2k/yr) — negative.
- To cash-flow at today's rent, offer at most $298k (8.2% below list).
- To meet the 1% rule (rent ≥ 1% of price), the offer needs to be $224k (31.0% below list).
- Recommended offer: $224k (31.0% below list) — sets the bar for 1% rule.
- Cap rate 5.7% vs local median 3.1% in Cape Coral — top-decile yield for the area; either an underpriced asset or a hidden risk that comps aren't pricing in. Stress-test before assuming the spread holds.
Location & tenants
- Location reads 77/100 on livability (#208 in FL, #3,098 nationally) — a middle-class / working-renter tenant base. Strengths: housing A+, health & safety A+, amenities B+; Watch: commute F.
- Lee (suburban): math 47% / reading 50% proficiency, ranked #42 of 73 in FL (top 58%) — families likely to look elsewhere, expect single-tenant / working-renter base with shorter leases.
- Zoned schools: Gulf Elementary School (math 70% / reading 65%, grade B+, #435 of 2,144 statewide, top 21%, 1,231 students, 38% FRL); Challenger Middle School (math 59% / reading 56%, grade B, #157 of 571 statewide, top 28%, 1,124 students, 50% FRL); Ida S. Baker High School (math 44% / reading 47%, grade D-, #223 of 667 statewide, top 34%, 1,933 students, 39% FRL) — zoned schools average 42% FRL vs 57% district-wide (15 pts lower); this property's tenant base skews higher-income than the district average.
- Market conditions: Rents falling (-5.5%/yr); 2671 active listings in the ZIP; 40 comparable units currently listed for rent nearby; rentals at typical pace (median 17d on market — plan ~3-4 weeks tenant-placement turnaround); solid renter incomes; 15,411 units permitted in Lee County in 2024 (4,686 in 5+ unit buildings).
Forward outlook
- Local home prices are declining (-3.0%/yr); year-one equity from $2k of loan paydown is wiped out by about $10k of value loss. Plan a longer hold.
- Lee County population projected at +44% by 2050 — long-run rental-demand tailwind backs the buy-and-hold thesis.
Negotiation context
- It's been on market 111 days — a 9% lower offer ($296k) is reasonable based on typical stale-listing flexibility.
- 4 sale attempts; this cycle's ask is 14030% above the opening price — seller raised mid-cycle; expect resistance to lowballs.
- Current owner paid $40k; list at $325k implies a 712% gain — meaningful room to come down on a strong offer.
Risks & watch-outs
- Climate carrying-cost: severe wind risk, 99% chance of damaging wind over 30y; moderate wildfire risk; extreme-heat days projected 6→25/yr by 2055 (HVAC capex compounding) — expect insurance premiums to compound above CPI over the hold.
Questions for the listing agent
- What do current leases actually rent for vs. the listed asking? Can we see a recent rent roll and the last 12 months of T-12 income?
- It's been on market 111 days. Have you received any prior offers? Is the seller open to a 31% concession, seller financing, or rate buy-down credit?
- Why hasn't it sold? Are there any deal-killer items the seller is aware of (foundation, flood, title, zoning, code violations)?
- Is there a deadline driving the sale (1031 exchange, divorce, estate, relocation)? That informs how much negotiation room exists.
- Schools are B-rated — typically a magnet for longer-tenancy family renters. What's the average tenant stay here, and is there a school-zone premium baked into asking?
- The area grade is low — what's the realistic commute time and amenity access for the typical tenant pool here? Any planned neighborhood developments (good or bad) we should know about?
- What's the average days-on-market for RENTAL listings here right now (not sales)? A rising rental-DOM trend means longer vacancies and softer asking-rent achievability than the comps imply.
- What's the recent tenant-quality profile in this submarket — average credit score on applications, eviction rate, late-payment / NSF rate, and stable-employment percentage? A property-management company in the area should have these aggregated.
- How much new for-sale + rental construction is in the pipeline within 1–3 miles? Heavy new supply typically softens prices + rents 12–24 months out; constrained supply supports both.
Investment metrics
- 1% rule
- 0.69% ✗
- Cap rate
- 5.73%
- Cash-on-cash
- -2.00%
- DSCR
- 0.91
- GRM
- 12.1
CMA / ARV
No comps found within radius.
Projected returns pro-forma
-3.0% appreciation · 0.0% rent growth · sell at horizon
- IRR
- -22.6%
- Equity multiple
- 0.24×
- Total profit
- $-69,054
- Equity at exit
- $48,459
- IRR
- -25.1%
- Equity multiple
- -0.08×
- Total profit
- $-98,635
- Equity at exit
- $28,100
Cash invested: $91,000 (down + closing). Projections, not guarantees.
Landlord ↔ Tenant lean methodology
- Overall (STATE)
- 87 Strongly Landlord-Friendly
- State Florida
- 87 Strongly Landlord-Friendly · R+3
- County
- — inherits STATE
- City
- — inherits STATE
ZIP-level market 33993
- Home prices YoY
- -14.1%
- Rents YoY
- -5.5%
- Active inventory
- 2671
- Price-to-rent
- 12.1×
Monthly cashflow live
- Estimated rent
- $2,244 high interval (Pro) →
- Mortgage (P&I)
- −$1,704
- Tax from tax record
- −$84 /mo · $1,010/yr
- Insurance
- −$135
- HOA
- −$0
- Vacancy / Maint / Mgmt
- −$471
- Net cashflow
- $-152
Break-even live
Sensitivity live
| Price | -10% $32 | -5% $-60 | +0% $-152 | +5% $-244 | +10% $-336 |
|---|---|---|---|---|---|
| Rent | -10% $-329 | -5% $-240 | +0% $-152 | +5% $-63 | +10% $26 |
| Rate | -1.0pp $12 | -0.5pp $-69 | base $-152 | +0.5pp $-236 | +1.0pp $-321 |
UW: 25.0% down · 7.5% · 30yr · 1.5% tax · 5.0% vac · 8.0% maint · 8.0% mgmt
Financing live
Cash to close
- Down payment
- $81,250
- Closing costs
- $9,750
- Reserves months
- —
- Total cash needed
- —
Loan-product check · same deal, 3 products live
Conventional
25% down · 7.5% · 30yr
- Down + closing
- —
- Monthly P&I
- —
- Monthly cashflow
- —
- DSCR
- —
- Eligible?
- —
Personal DTI + credit; lowest rate.
DSCR
20% down · 8.5% · 30yr
- Down + closing
- —
- Monthly P&I
- —
- Monthly cashflow
- —
- DSCR
- —
- Eligible?
- —
No personal income docs; deal must DSCR.
Hard money
10% down · 12.0% · 12mo
- Down + closing
- —
- Monthly P&I
- —
- Monthly cashflow
- —
- DSCR
- —
- Eligible?
- —
Short-term bridge; refi at stabilization.
Rent comps 40 comps
| Address | Beds | Baths | Sqft | Rent | $/sqft | DOM | Units | Dist |
|---|---|---|---|---|---|---|---|---|
| 1427 NW 20th St Cape Coral, FL | 4.0 | 2.0 | 1617 | $1,895 | $1.17 | 18d | 1 | 0.17mi |
| 1431 NW 20th Ter Cape Coral, FL | 3.0 | 2.0 | 2052 | $1,775 | $0.87 | 21d | 1 | 0.23mi |
| 1917 NW 12th Ave Cape Coral, FL | 3.0 | 2.0 | 1528 | $2,200 | $1.44 | 25d | 1 | 0.29mi |
| 2014 NW 16th Pl Cape Coral, FL | 4.0 | 2.0 | 1712 | $1,701 | $0.99 | 16d | 1 | 0.35mi |
| 1026 NW 21st Ter Cape Coral, FL | 4.0 | 2.0 | 1760 | $1,825 | $1.04 | 5d | 1 | 0.51mi |
| 2227 NW 11th Ct Cape Coral, FL | 4.0 | 2.0 | 1650 | $1,895 | $1.15 | 25d | 1 | 0.58mi |
| 2124 NW 18th Ave Cape Coral, FL | 3.0 | 2.0 | 1556 | $2,000 | $1.29 | 21d | 1 | 0.60mi |
| 1823 NW 19th Ave Cape Coral, FL | 4.0 | 2.0 | 1712 | $1,850 | $1.08 | 25d | 1 | 0.60mi |
| 2103 NW 10th Ave Cape Coral, FL | 3.0 | 2.0 | 1455 | $2,200 | $1.51 | 25d | 1 | 0.60mi |
| 1023 NW 22nd Ter Cape Coral, FL | 3.0 | 2.0 | 1469 | $1,831 | $1.25 | 16d | 1 | 0.61mi |
| 1809 NW 17th Ter Cape Coral, FL | 3.0 | 2.0 | 1750 | $1,980 | $1.13 | 25d | 1 | 0.62mi |
| 1820 NW 19th Ave Cape Coral, FL | 4.0 | 3.0 | 2340 | $2,500 | $1.07 | 13d | 1 | 0.63mi |
| 2206 NW 17th Pl Cape Coral, FL | 4.0 | 2.0 | 1779 | $2,075 | $1.17 | 25d | 1 | 0.64mi |
| 1319 NW 15th Ave Cape Coral, FL | 4.0 | 2.0 | 2009 | $2,150 | $1.07 | 25d | 1 | 0.69mi |
| 1818 Diplomat Pkwy W Cape Coral, FL | 4.0 | 2.0 | 1787 | $2,025 | $1.13 | 25d | 1 | 0.71mi |
| 1822 Diplomat Pkwy W Cape Coral, FL | 4.0 | 2.0 | 1787 | $2,145 | $1.20 | 25d | 1 | 0.72mi |
| 1731 NW 14th St Cape Coral, FL | 4.0 | 2.0 | 1337 | $1,866 | $1.40 | 5d | 1 | 0.79mi |
| 1011 Kismet Pkwy W Cape Coral, FL | 4.0 | 2.0 | 1787 | $2,100 | $1.18 | 5d | 1 | 0.80mi |
| 2308 NW 9th Ave Cape Coral, FL | 4.0 | 3.0 | 1683 | $2,200 | $1.31 | 25d | 1 | 0.83mi |
| 1212 Chiquita Blvd N Cape Coral, FL | 3.0 | 2.0 | 1672 | $2,100 | $1.26 | 25d | 1 | 0.88mi |
| 2027 NW 17th St Cape Coral, FL | 4.0 | 2.0 | 2000 | $2,450 | $1.23 | 25d | 1 | 0.89mi |
| 1411 NW 9th Ave Cape Coral, FL | 4.0 | 2.0 | 1760 | $2,150 | $1.22 | 16d | 1 | 0.90mi |
| 1840 NW 14th Ter Cape Coral, FL | 3.0 | 2.0 | 1994 | $1,871 | $0.94 | 5d | 1 | 0.90mi |
| 2000 NW 7th Ave Cape Coral, FL | 4.0 | 2.0 | 1708 | $1,950 | $1.14 | 25d | 1 | 0.91mi |
| 2000 NW 7th Ave Cape Coral, FL | 4.0 | 2.0 | 1708 | $1,950 | $1.14 | 16d | 1 | 0.91mi |
| 1406 NW 8th Pl Cape Coral, FL | 3.0 | 2.0 | 1403 | $1,855 | $1.32 | 25d | 1 | 0.92mi |
| 1426 NW 12th St Cape Coral, FL | 3.0 | 2.0 | 1455 | $1,699 | $1.17 | 16d | 1 | 0.95mi |
| 1426 NW 12th St Cape Coral, FL | 3.0 | 2.0 | 1455 | $1,699 | $1.17 | 23d | 1 | 0.95mi |
| 1426 NW 12th St Cape Coral, FL | 3.0 | 2.0 | 1455 | $1,699 | $1.17 | 12d | 1 | 0.95mi |
| 1903 NW 22nd Ave Cape Coral, FL | 4.0 | 2.0 | 1984 | $2,200 | $1.11 | 25d | 1 | 0.96mi |
| 2423 NW 19th Pl Cape Coral, FL | 4.0 | 2.0 | 1829 | $1,761 | $0.96 | 12d | 1 | 0.98mi |
| 2105 NW 22nd Ave Cape Coral, FL | 4.0 | 2.0 | 1833 | $2,265 | $1.24 | 16d | 1 | 1.00mi |
| 1719 NW 25th Ln Cape Coral, FL | 4.0 | 2.0 | 1829 | $2,291 | $1.25 | 5d | 1 | 1.00mi |
| 1120 NW 11th Pl Cape Coral, FL | 3.0 | 2.0 | 1528 | $1,816 | $1.19 | 16d | 1 | 1.01mi |
| 1926 NW 15th St Cape Coral, FL | 3.0 | 2.0 | 1461 | $2,100 | $1.44 | 12d | 1 | 1.01mi |
| 2216 NW 18th Ter Cape Coral, FL | 3.0 | 2.0 | 1548 | $1,816 | $1.17 | 16d | 1 | 1.06mi |
| 1831 NW 6th Ave Cape Coral, FL | 4.0 | 2.0 | 1833 | $1,795 | $0.98 | 4d | 1 | 1.07mi |
| 1104 NW 11th Pl Cape Coral, FL | 3.0 | 2.5 | 2014 | $1,695 | $0.84 | 5d | 1 | 1.07mi |
| 1821 NW 23rd Ave Cape Coral, FL | 3.0 | 2.0 | 1876 | $1,856 | $0.99 | 16d | 1 | 1.08mi |
| 1137 NW 19th Ave Cape Coral, FL | 4.0 | 2.0 | 1771 | $2,215 | $1.25 | 16d | 1 | 1.09mi |
Listing history 23 events
-
2026-06-22days on market $325,000 Active 111 DOM
-
2026-06-17days on market $325,000 Active 107 DOM
-
2026-06-16days on market $325,000 Active 106 DOM
-
2026-06-15pricedays on market $325,000 Active 105 DOM
-
2026-06-13days on market $360,000 Active 103 DOM
-
2026-06-10days on market $360,000 Active 100 DOM
-
2026-06-09days on market $360,000 Active 99 DOM
-
2026-06-07days on market $360,000 Active 97 DOM
-
2026-06-02days on market $360,000 Active 92 DOM
-
2026-06-01days on market $360,000 Active 91 DOM
-
2026-06-01days on market $360,000 Active 90 DOM
-
2026-04-21historical $2,050
-
2026-04-14historical $2,300
-
2026-04-14$2,300
-
2026-04-13price $360,000
-
2026-04-10$2,300
-
2026-04-10historical $2,300
-
2026-04-09$2,300
-
2026-03-02$430,000 Active
-
2023-12-27soldstatus $40,000
-
2021-06-10soldstatus $15,000
-
1999-08-17soldstatus $7,000
-
1999-06-22soldstatus $7,000
ⓘ Source: listings_history table (triggers on properties + properties_extension) + one-shot
backfill from property_details.listing_events for pre-trigger history.
Tax reassessment forecast FL · Resets to sale price
- Current annual tax
- $1,010 · $84/mo
- Projected year-2 tax
- $2,698 · $225/mo
- Expected delta
- +$1,687/yr (+$141/mo · 167.0%)
ⓘ Screening estimate from a state-policy table — verify with the county assessor before closing.
Climate risk First Street
- Flood 4/10 Moderate FEMA zone X (unshaded) · 22% chance over 30 yrs
- Wildfire 5/10 Major
- Heat 10/10 Extreme 6 d/yr ≥107°F today · 25 d/yr by 30 yrs out
- Wind 10/10 Extreme 99% chance of damaging wind over 30 yrs
- Air quality 2/10 Low 1 unhealthy d/yr today · 1 by 30 yrs out
Nearby sold comps map
Loading sold comps map…
Walkable amenities ~0.75 mi
Loading nearby amenities…
Taxation est. · year 1
- Rental income
- $26,923
- − Mortgage interest
- −$18,205
- − Property taxes
- −$1,010
- − Insurance
- −$1,625
- − Repairs & maintenance
- −$2,154
- − Management
- −$2,154
- − Depreciation
- −$9,455
- Taxable loss
- −$7,680
- Est. tax savings @ 24.0%
- +$1,843
- After-tax cash flow
- $25/yr
For passive investors: Depreciation is non-cash, so a rental often shows a tax loss while cash-flowing — sheltering income. Rental losses are passive: they offset passive income freely, and up to $25,000/yr can offset ordinary (W-2) income if you actively participate and your MAGI is under $100k (phasing out to $0 by $150k); unused losses carry forward. On sale, claimed depreciation is recaptured at up to 25%, and gains may owe capital-gains tax (a 1031 exchange can defer both). Figures are a year-1 estimate at your 24.0% rate — not tax advice; consult a CPA.
Schools (NCES district)
- District
- Lee
- NCES district ID
- 1201080
- Math proficiency
- 47% ▼ -11.00%
- Reading proficiency
- 50% ▼ -4.00%
- Median HH income
- $49,518
- Composite
- 41.49/100
- National rank
- #3458
- State rank
- #42 of 73 in FL
Livability — Cape Coral
- Score
- 77/100
- State rank
- #208
- US rank
- #3098
Category grades
Schools grade is shown separately in the Schools card above.
Census & demographics
- Census place
- Cape Coral, FL
- County
- Lee County · 788,662 people
- City population
- 217,388
- Metro
- Cape Coral-Fort Myers, FL
- Population (ZIP)
- 35,580
- Household income
- $90,577
- Rent vs Own
- Severe rent burden
- 286.0
Population outlook (Lee County) Hauer SSP2
- Today (2025)
- 871,946 people
- By 2030
- 955,468 · +9.6%
- By 2040
- 1,113,587 · +27.7%
- By 2050
- 1,256,891 · +44.1%
- By 2075
- 1,560,270 · +78.9%
- By 2100
- 1,726,848 · +98.0%
Race, ethnicity, and origin ACS 2023
- Neighborhood character
- Diverse neighborhood (Simpson 0.58)
- Race & ethnicity
- White 57% Hispanic / Latino 30% Two or more races 21% Black 7% Asian 2%
- Hispanic origin (detail)
- Mexican 2% Puerto Rican 6% Cuban 17% Dominican 1%
- Common ancestry
- Romanian 2% Hispanic 2% Lithuanian 2%
- Foreign-born
- 21% · Canada, Jamaica, China
- Languages at home
- 73% English-only · Spanish 24% French/Haitian/Cajun 1% Russian/Polish/Slavic 1%
Political lean MEDSL · Lee
- 2024 margin
- Strong R (+28.4) · D 35.5% · R 63.9%
- 2008→2024 swing
- -18.0pp toward R · 2008: -10.4pp · 2024: -28.4pp
- All cycles
- 2024: R+28.4 2020: R+19.2 2016: R+20.4 2012: R+16.6 2008: R+10.4
Not yet ingested
- Civics
- —
Market trends
- HPI YoY
- ▼ -55.34%
- Current HPI
- 337.0575
- Rent YoY
- ▼ -5.51%
- Metro
- Cape Coral-Fort Myers, FL
- State GDP YoY
- ▲ 3.28%
- F500 in state
- 36
Industry mix (Fortune 500 HQ in FL)
| Industry | F500 HQs | Revenue |
|---|---|---|
| Industrial Technology | 2 | $29B |
|
||
| Insurance | 2 | $17B |
|
||
| Retail | 1 | $60B |
|
||
| Technology Distribution | 1 | $58B |
|
||
| Homebuilding | 1 | $35B |
|
||
| Technology Manufacturing | 1 | $35B |
|
||
Price history
-70.7% since first listed12 events — show timeline
- 2026-04-21 Rental Removed $2,050 NAPLESMLS
- 2026-04-14 Rental Removed $2,300 FGCMLS
- 2026-04-14 Listed for Rent $2,300 FGCMLS
- 2026-04-13 Price Changed $360,000 FORTMLS
- 2026-04-10 Listed for Rent $2,300 NAPLESMLS
- 2026-04-10 Rental Removed $2,300 FORTMLS
- 2026-04-09 Listed for Rent $2,300 FORTMLS
- 2026-03-02 Listed $430,000 FORTMLS
- 2023-12-27 Sold (Public Records) $40,000 Public Records
- 2021-06-10 Sold (Public Records) $15,000 Public Records
- 1999-08-17 Sold (Public Records) $7,000 Public Records
- 1999-06-22 Sold (Public Records) $7,000 Public Records
Property tax history
+12.7%/yrLatest (2025): $1,010 · +2.8% YoY. Source: county tax records.
Cash-flow waterfall
monthlySold comps — $/sqft
last 12 mo · ≤1 miLoading sold comps…