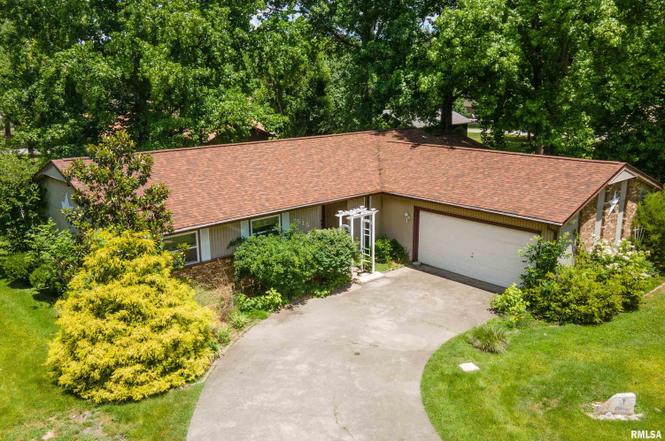
515 E Clark Trl · Herrin, IL
Flood risk 1/10 · Minimal
- FEMA flood zone
- X (unshaded)
- Chance of flooding over 30 yrs
- 0.0%
- Est. flood insurance / yr
- $507 – $1,088
Fire risk 1/10 · Minimal
- Est. fire insurance / yr
- $804 – $1,492
Heat risk 5/10 · Moderate
- Hot days now (above 107°F)
- 7 days/yr
- Hot days in 30 yrs
- 20 days/yr
Wind risk 2/10 · Minimal
- Chance of severe wind over 30 yrs
- 3.0%
Air-quality risk 2/10 · Minimal
- Unhealthy air days now
- 0 days/yr
- Unhealthy air days in 30 yrs
- 2 days/yr
Risk factors via First Street. Map © Google.
Why this score? — see what drove the B grade
The composite is a weighted blend of 9 inputs, each scored 0–100. Each bar is that input's sub-score; the figure is the points it added to the 100-point composite (weight × sub-score).
- Cash flow +29.6/30.0
- ARV discount +15.0/15.0
- DSCR +10.0/10.0
- 1% rule +9.2/10.0
- Livability +3.2/5.0
- Rent growth +2.5/5.0
- Condition / age +2.5/5.0
- Schools +2.1/10.0
- Appreciation +0.0/10.0
$155,000
🖨 Deal sheet 📄 Offer letter ✓ Due diligence
Listing remarks
Welcome home to this spacious brick ranch, offering the perfect blend of comfort, potential, and outdoor living! Featuring 3 bedrooms, 2 full baths, plus an additional convenient commode located just off the garage and laundry area, this home provides over 1,800 square feet of functional living space. The flexible floor plan is designed for everyday convenience, with room for everyone to spread out and enjoy. The spacious living room features one of two gas fireplaces, creating a warm and inviting atmosphere, while the large family room offers additional space for entertaining, gatherings, or relaxing evenings at home. Step outside and enjoy a backyard designed for relaxing and making memor
Key facts
- Covered deck
- Gas fireplaces
- Mature shade trees
Tags
Property features AI
Exterior
- Parking: Attached 2-car garage
- Utilities: Public water; Public sewer
- Home design: Single-family residence; Built in 1976
- Construction: Shingle roof; Crawl space / no finished basement
- Exterior features: Shed(s); Level lot; Paved road access
Interior
- Kitchen: Dishwasher; Refrigerator
- Bedrooms: 3 bedrooms (all on main level)
- Flooring: Carpet in bedrooms and many living areas; Vinyl flooring in kitchen, family room, and some dining areas
- Bathrooms: 2 full bathrooms
- Heating & cooling: Forced air heating; Central air conditioning
- Interior features: Ceiling fans; High-speed internet; Gas log fireplace (2 total fireplaces)
- Laundry & utility: Main level laundry room
Neighborhood map
What this means for you Summary
Snapshot
- This is a 3-bed/2.0-bath single-family listed at $155k.
Deal economics
- At list price, monthly cash flow is $561 ($7k/yr) — positive.
- The deal already cash-flows at list — no discount required.
- Meets the 1% rule at list price ($2k rent vs $155k).
- Cap rate 10.6% vs local median 8.5% in Herrin — meaningfully above typical; check what's discounted (condition, days-on-market, listing class) to confirm the premium yield is real.
Location & tenants
- Location reads 64/100 on livability (#667 in IL) — a middle-class / working-renter tenant base. Strengths: cost of living A+, housing A+, health & safety B; Watch: crime D-, amenities F, commute F.
- Herrin CUSD 4 (suburban): math 22% / reading 27% proficiency, ranked #364 of 620 in IL (top 59%) — low school quality limits family demand, transient renter base, plan for 1-2y turnover.
- Zoned schools: Herrin Middle School (math 24% / reading 28%, grade F, #318 of 665 statewide, top 48%, 507 students, 0% FRL); Herrin High School (math 22% / reading 32%, grade F, #218 of 693 statewide, top 35%, 686 students, 0% FRL) — zoned schools average 0% FRL vs 56% district-wide (56 pts lower); this property's tenant base skews higher-income than the district average.
- Market conditions: 91 active listings in the ZIP; 1 comparable units currently listed for rent nearby; 130 units permitted in Williamson County in 2024 (5 in 5+ unit buildings).
Forward outlook
- Local home prices are declining (-3.0%/yr); year-one equity from $1k of loan paydown is wiped out by about $5k of value loss. Plan a longer hold.
- At projected returns (-3.0% appreciation + 3.0% rent growth), your $43k cash investment doubles in ~8 years — after that, you're playing with house money.
Negotiation context
- Only 2 days on market — expect competitive offers; lowballing is unlikely to land.
- 4 sale attempts since 21y ago with the ask held roughly flat each time — persistent listings suggest the price (not the market) is what's stuck; bring a comps-based counter.
- Current owner paid $121k; 28% above their basis — modest negotiation headroom, anchor on the comps not their cost.
Risks & watch-outs
- Climate carrying-cost: extreme-heat days projected 7→20/yr by 2055 (HVAC capex compounding) — expect insurance premiums to compound above CPI over the hold.
Questions for the listing agent
- Built in 1976 — when were the roof, HVAC, electrical panel, plumbing, and water heater last replaced?
- Is there a deadline driving the sale (1031 exchange, divorce, estate, relocation)? That informs how much negotiation room exists.
- Schools are D-rated, which usually means shorter tenancies and higher turnover. Who's the typical renter profile here, and what's been the actual vacancy rate?
- Crime grade is D in this area — have there been break-ins, vandalism, or insurance claims at this property in the last 3 years? What carrier currently insures it and at what premium?
- What's the average days-on-market for RENTAL listings here right now (not sales)? A rising rental-DOM trend means longer vacancies and softer asking-rent achievability than the comps imply.
- What's the recent tenant-quality profile in this submarket — average credit score on applications, eviction rate, late-payment / NSF rate, and stable-employment percentage? A property-management company in the area should have these aggregated.
- How much new for-sale + rental construction is in the pipeline within 1–3 miles? Heavy new supply typically softens prices + rents 12–24 months out; constrained supply supports both.
Investment metrics
- 1% rule
- 1.42% ✓
- Cap rate
- 10.64%
- Cash-on-cash
- 15.51%
- DSCR
- 1.69
- GRM
- 5.9
CMA / ARV
- ARV (on-the-fly)
- $196,024
- Comps found
- 12
Show comp detail 12 sales within ~0.75 mi
| Address | Dist | Beds/Ba | Sqft | Sold | Price | $/sf | Match |
|---|---|---|---|---|---|---|---|
| 401 E Cross St | 0.17mi | 3/2.0 | 1,888 (+3%) | 5mo | $202,500 | $107 | 83 |
| 1216 S 17th St | 0.46mi | 3/2.0 | 1,832 (0%) | 2mo | $153,400 | $84 | 77 |
| 805 Hilldale Ave | 0.20mi | 3/2.0 | 1,746 (-5%) | 8mo | $174,900 | $100 | 76 |
| 659 Copper Creek Ln | 0.40mi | 3/2.0 | 1,730 (-6%) | 3mo | $267,500 | $155 | 70 |
| 1205 Wildflower Ln | 0.54mi | 4/2.0 (+1) | 1,898 (+4%) | 2mo | $304,000 | $160 | 62 |
| 1117 E Ash St | 0.69mi | 3/2.5 | 1,840 (+0%) | 6mo | $65,001 | $35 | 60 |
| 416 Park Ln | 0.19mi | 4/2.0 (+1) | 1,584 (-14%) | 9mo | $152,000 | $96 | 56 |
| 825 Melody Ln | 0.52mi | 3/2.0 | 1,668 (-9%) | 9mo | $155,000 | $93 | 53 |
| 408 W Clark Trl | 0.69mi | 3/2.0 | 1,952 (+7%) | 8mo | $250,000 | $128 | 51 |
| 521 S 5th St | 0.69mi | 4/2.0 (+1) | 1,896 (+4%) | 8mo | $150,000 | $79 | 50 |
| 212 Kane Dr | 0.62mi | 3/3.0 | 2,016 (+10%) | 2mo | $255,000 | $126 | 48 |
| 1104 E Poplar St | 0.69mi | 3/1.5 | 1,664 (-9%) | 4mo | $199,900 | $120 | 47 |
Match score weights: distance 35% · size 25% · config 20% · recency 20%. Top-matched comps best support the ARV.
Projected returns pro-forma
-3.0% appreciation · 3.0% rent growth · sell at horizon
- IRR
- 6.3%
- Equity multiple
- 1.25×
- Total profit
- $10,705
- Equity at exit
- $23,111
- IRR
- 15.7%
- Equity multiple
- 2.28×
- Total profit
- $55,720
- Equity at exit
- $13,402
Cash invested: $43,400 (down + closing). Projections, not guarantees.
Landlord ↔ Tenant lean methodology
- Overall (STATE)
- 43 Moderately Tenant-Leaning
- State Illinois
- 43 Moderately Tenant-Leaning · D+7
- County
- — inherits STATE
- City
- — inherits STATE
ZIP-level market 62948
- Home prices YoY
- -34.1%
- Active inventory
- 91
- Price-to-rent
- 5.9×
Monthly cashflow live
- Estimated rent
- $2,200 medium interval (Pro) →
- Mortgage (P&I)
- −$813
- Tax from tax record
- −$300 /mo · $3,596/yr
- Insurance
- −$65
- HOA
- −$0
- Vacancy / Maint / Mgmt
- −$462
- Net cashflow
- $561
Break-even live
UW: 25.0% down · 7.5% · 30yr · 1.5% tax · 5.0% vac · 8.0% maint · 8.0% mgmt
Financing live
Cash to close
- Down payment
- $38,750
- Closing costs
- $4,650
- Reserves months
- —
- Total cash needed
- —
Loan-product check · same deal, 3 products live
Conventional
25% down · 7.5% · 30yr
- Down + closing
- —
- Monthly P&I
- —
- Monthly cashflow
- —
- DSCR
- —
- Eligible?
- —
Personal DTI + credit; lowest rate.
DSCR
20% down · 8.5% · 30yr
- Down + closing
- —
- Monthly P&I
- —
- Monthly cashflow
- —
- DSCR
- —
- Eligible?
- —
No personal income docs; deal must DSCR.
Hard money
10% down · 12.0% · 12mo
- Down + closing
- —
- Monthly P&I
- —
- Monthly cashflow
- —
- DSCR
- —
- Eligible?
- —
Short-term bridge; refi at stabilization.
Rent comps 1 comps
| Address | Beds | Baths | Sqft | Rent | $/sqft | DOM | Units | Dist |
|---|---|---|---|---|---|---|---|---|
| 305 S McVicker Dr Unit 1 Energy, IL | 3.0 | 2.0 | 2200 | $2,200 | $1.00 | 43d | 1 | 1.28mi |
Listing history 3 events
-
2026-06-19days on market $155,000 Active 2 DOM
-
2026-06-18remarks 699-char remark
-
2026-06-18$155,000 Active 1 DOM
ⓘ Source: listings_history table (triggers on properties + properties_extension) + one-shot
backfill from property_details.listing_events for pre-trigger history.
Tax reassessment forecast IL · Partial reset (capped growth)
- Current annual tax
- $3,596 · $300/mo
- Projected year-2 tax
- $3,596 · $300/mo
- Expected delta
- $0/yr ($0/mo · 0.0%)
ⓘ Screening estimate from a state-policy table — verify with the county assessor before closing.
Climate risk First Street
- Flood 1/10 Low FEMA zone X (unshaded) · 0% chance over 30 yrs
- Wildfire 1/10 Low
- Heat 5/10 Major 7 d/yr ≥107°F today · 20 d/yr by 30 yrs out
- Wind 2/10 Low 3% chance of damaging wind over 30 yrs
- Air quality 2/10 Low 0 unhealthy d/yr today · 2 by 30 yrs out
Nearby sold comps map
Loading sold comps map…
Walkable amenities ~0.75 mi
Loading nearby amenities…
Taxation est. · year 1
- Rental income
- $26,400
- − Mortgage interest
- −$8,682
- − Property taxes
- −$3,596
- − Insurance
- −$775
- − Repairs & maintenance
- −$2,112
- − Management
- −$2,112
- − Depreciation
- −$4,509
- Taxable income
- $4,613
- Est. tax owed @ 24.0%
- −$1,107
- After-tax cash flow
- $5,623/yr
For passive investors: Depreciation is non-cash, so a rental often shows a tax loss while cash-flowing — sheltering income. Rental losses are passive: they offset passive income freely, and up to $25,000/yr can offset ordinary (W-2) income if you actively participate and your MAGI is under $100k (phasing out to $0 by $150k); unused losses carry forward. On sale, claimed depreciation is recaptured at up to 25%, and gains may owe capital-gains tax (a 1031 exchange can defer both). Figures are a year-1 estimate at your 24.0% rate — not tax advice; consult a CPA.
Schools (NCES district)
- District
- Herrin CUSD 4
- NCES district ID
- 1718810
- Math proficiency
- 22% ▼ -11.00%
- Reading proficiency
- 27% ▼ -17.00%
- Median HH income
- $38,824
- Composite
- 20.56/100
- National rank
- #8558
- State rank
- #364 of 620 in IL
Livability — Herrin
- Score
- 64/100
- State rank
- #667
- US rank
- #13670
Category grades
Schools grade is shown separately in the Schools card above.
Census & demographics
- Census place
- Herrin, IL
- City population
- 12,728
- Population (ZIP)
- 12,728
Population outlook (Williamson County) Hauer SSP2
- Today (2025)
- 69,553 people
- By 2030
- 70,090 · +0.8%
- By 2040
- 70,345 · +1.1%
- By 2050
- 69,394 · -0.2%
- By 2075
- 63,590 · -8.6%
- By 2100
- 51,154 · -26.5%
Race, ethnicity, and origin ACS 2023
- Neighborhood character
- Predominantly White (85%)
- Race & ethnicity
- White 85% Two or more races 8% Black 5% Hispanic / Latino 4% Native American 1%
- Common ancestry
- Romanian 4% Lithuanian 3% Slovak 2%
- Foreign-born
- 3% · Canada
- Languages at home
- 95% English-only · Spanish 3%
Political lean MEDSL · Williamson
- 2024 margin
- Solid R (+38.8) · D 30.0% · R 68.8% · Other 1.3%
- 2008→2024 swing
- -24.0pp toward R · 2008: -14.8pp · 2024: -38.8pp
- All cycles
- 2024: R+38.8 2020: R+37.3 2016: R+41.2 2012: R+25.0 2008: R+14.8
Not yet ingested
- Civics
- —
Market trends
- HPI YoY
- ▼ -67.82%
- Current HPI
- 131.1617
- Rent YoY
- —
- Metro
- —
- State GDP YoY
- ▲ 1.59%
- F500 in state
- 60
Industry mix (Fortune 500 HQ in IL)
| Industry | F500 HQs | Revenue |
|---|---|---|
| Insurance | 4 | $201B |
|
||
| Consumer Goods | 4 | $87B |
|
||
| Industrial Machinery | 3 | $64B |
|
||
| Healthcare | 2 | $55B |
|
||
| Retail / Pharmacy | 1 | $148B |
|
||
| Agriculture / Food | 1 | $86B |
|
||
Price history
+32.6% since first listed13 events — show timeline
- 2026-06-17 Listed $155,000 RMLSA as Distributed by MLS Grid
- 2021-08-06 Listing Removed — RMLSA as Distributed by MLS Grid
- 2021-08-06 Listing Removed — RMLSA as Distributed by MLS Grid
- 2021-08-06 Listing Removed — RMLSA as Distributed by MLS Grid
- 2009-12-24 Listing Removed — MRED as Distributed by MLS Grid
- 2008-06-26 Sold (MLS) $121,000 RMLSA as Distributed by MLS Grid
- 2008-06-26 Sold (MLS) $121,000 MRED as Distributed by MLS Grid
- 2008-06-25 Sold (Public Records) $121,000 Public Records
- 2007-11-05 Listed $129,900 RMLSA as Distributed by MLS Grid
- 2007-11-05 Listed $129,900 MRED as Distributed by MLS Grid
- 2005-12-12 Sold (Public Records) $116,500 Public Records
- 2005-12-09 Sold (MLS) $116,500 RMLSA as Distributed by MLS Grid
- 2005-11-08 Listed $116,900 RMLSA as Distributed by MLS Grid
Property tax history
+6.2%/yrLatest (2025): $3,596 · +106.9% YoY. Source: county tax records.
Cash-flow waterfall
monthlySold comps — $/sqft
last 12 mo · ≤1 miLoading sold comps…