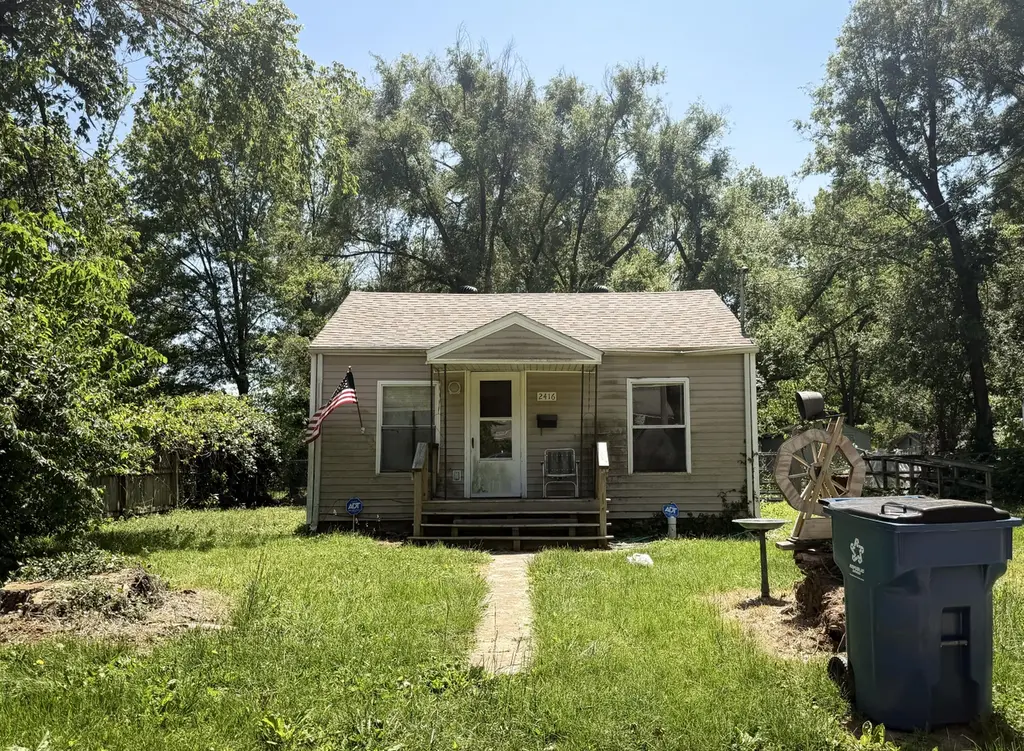
2416 W Monroe St · Springfield, MO
Flood risk 1/10 · Minimal
- FEMA flood zone
- X (unshaded)
- Chance of flooding over 30 yrs
- 0.0%
- Est. flood insurance / yr
- $507 – $1,088
Fire risk 1/10 · Minimal
- Est. fire insurance / yr
- $1,054 – $1,958
Heat risk 5/10 · Moderate
- Hot days now (above 104°F)
- 7 days/yr
- Hot days in 30 yrs
- 18 days/yr
Wind risk 2/10 · Minimal
- Chance of severe wind over 30 yrs
- 0.0%
Air-quality risk 2/10 · Minimal
- Unhealthy air days now
- 1 days/yr
- Unhealthy air days in 30 yrs
- 2 days/yr
Risk factors via First Street. Map © Google.
Why this score? — see what drove the C+ grade
The composite is a weighted blend of 9 inputs, each scored 0–100. Each bar is that input's sub-score; the figure is the points it added to the 100-point composite (weight × sub-score).
- Cash flow +27.4/30.0
- DSCR +9.6/10.0
- 1% rule +6.4/10.0
- ARV discount +5.7/15.0
- Livability +3.8/5.0
- Rent growth +3.7/5.0
- Schools +3.2/10.0
- Condition / age +2.5/5.0
- Appreciation +0.0/10.0
$79,900
🖨 Deal sheet 📄 Offer letter ✓ Due diligence
Listing remarks
As-is sale -- priced for investors. Currently tenant occupied at $700/month. Located in an established Springfield neighborhood near Zagonyi Park and within close proximity to Walmart Neighborhood Market on W Mt. Vernon St.
Key facts
- Near zagonyi park
- 9,148 sq ft lot
- Built 1946
Tags
Property features AI
Finance
- Other: Annual tax amount listed (financials withheld per instructions)
- Financial info: No investor or income/expense details provided
- HOA & community: No HOA details provided
Exterior
- Parking: No parking details provided
- Security: No security details provided
- Utilities: Public water; Public sewer
- Home design: Single-family residence; Residential property; One story
- Construction: No construction material, roof, foundation, or year built provided
- Exterior features: Lot of approximately 0.21 acre
Interior
- Kitchen: No kitchen appliance details provided
- Bedrooms: Listing indicates bedrooms (no specific count provided)
- Flooring: No flooring details provided
- Bathrooms: 1 full bathroom
- Heating & cooling: Central air conditioning; Natural gas heating with forced air
- Interior features: One-level layout
- Laundry & utility: No laundry details provided
Neighborhood map
What this means for you Summary
Snapshot
- This is a 2-bed/1.0-bath single-family listed at $80k.
Deal economics
- At list price, monthly cash flow is $233 ($3k/yr) — positive.
- The deal already cash-flows at list — no discount required.
- Meets the 1% rule at list price ($909 rent vs $80k).
- Recommended offer: $78k (3.0% below list) — sets the bar for market timing.
- Cap rate 9.8% vs local median 4.6% in Springfield — top-decile yield for the area; either an underpriced asset or a hidden risk that comps aren't pricing in. Stress-test before assuming the spread holds.
Location & tenants
- Location reads 75/100 on livability (#57 in MO, #4,121 nationally) — a middle-class / working-renter tenant base. Strengths: commute A+, cost of living A+, housing A+; Watch: crime F, employment F.
- Springfield R-XII (urban): math 32% / reading 46% proficiency, ranked #174 of 324 in MO (top 54%) — families likely to look elsewhere, expect single-tenant / working-renter base with shorter leases.
- Zoned schools: Westport Elem. (math 8% / reading 17%, grade F, #1,007 of 1,115 statewide, top 91%, 384 students, 88% FRL); Central High (math 42% / reading 62%, grade D+, #92 of 521 statewide, top 20%, 1,464 students, 51% FRL) — zoned schools average 69% FRL vs 46% district-wide (23 pts higher); higher-poverty schools than district average — tighter screening recommended.
- Market conditions: Rents rising fast (+4.8%/yr); 512 active listings in the ZIP; 10 comparable units currently listed for rent nearby; rentals lingering (median 44d on market — plan ~5-8 weeks vacancy on turnover, expect pricing pressure); 50% of comp listings sitting > 30 days — soft ceiling on asking rent; 1,302 units permitted in Greene County in 2024 (250 in 5+ unit buildings).
Forward outlook
- Local home prices are declining (-3.0%/yr); year-one equity from $552 of loan paydown is wiped out by about $2k of value loss. Plan a longer hold.
- Greene County population projected at +25% by 2050 — long-run rental-demand tailwind backs the buy-and-hold thesis.
- At projected returns (-3.0% appreciation + 4.8% rent growth), your $22k cash investment doubles in ~8 years — after that, you're playing with house money.
Negotiation context
- It's been on market 35 days — a 3% lower offer ($78k) is reasonable based on typical stale-listing flexibility.
Risks & watch-outs
- Watch-outs: built in 1946 — expect roof / HVAC / electrical / plumbing capex.
- Climate carrying-cost: extreme-heat days projected 7→18/yr by 2055 (HVAC capex compounding) — expect insurance premiums to compound above CPI over the hold.
Questions for the listing agent
- It's been on market 35 days. Have you received any prior offers? Is the seller open to a 3% concession, seller financing, or rate buy-down credit?
- Built in 1946 — when were the roof, HVAC, electrical panel, plumbing, and water heater last replaced?
- Is there a deadline driving the sale (1031 exchange, divorce, estate, relocation)? That informs how much negotiation room exists.
- Crime grade is F in this area — have there been break-ins, vandalism, or insurance claims at this property in the last 3 years? What carrier currently insures it and at what premium?
- What's the average days-on-market for RENTAL listings here right now (not sales)? A rising rental-DOM trend means longer vacancies and softer asking-rent achievability than the comps imply.
- What's the recent tenant-quality profile in this submarket — average credit score on applications, eviction rate, late-payment / NSF rate, and stable-employment percentage? A property-management company in the area should have these aggregated.
- How much new for-sale + rental construction is in the pipeline within 1–3 miles? Heavy new supply typically softens prices + rents 12–24 months out; constrained supply supports both.
Investment metrics
- 1% rule
- 1.14% ✓
- Cap rate
- 9.79%
- Cash-on-cash
- 12.49%
- DSCR
- 1.56
- GRM
- 7.3
CMA / ARV
- ARV (median comp)
- $76,775
- List price
- $79,900
- Delta
- 4.07%
- Verdict
- FAIR
- Comps
- 16 within 1.0 mi
Show comp detail 12 sales within ~0.75 mi
| Address | Dist | Beds/Ba | Sqft | Sold | Price | $/sf | Match |
|---|---|---|---|---|---|---|---|
| 2411 W Madison St | 0.04mi | 2/1.0 | 711 (-1%) | 13mo | $123,000 | $173 | 85 |
| 2606 W State St | 0.23mi | 2/1.0 | 783 (+9%) | 6mo | $40,000 | $51 | 70 |
| 2530 W Lincoln St | 0.31mi | 2/1.0 | 750 (+4%) | 12mo | $125,000 | $167 | 69 |
| 2521 W State St | 0.15mi | 1/1.0 (-1) | 792 (+10%) | 13mo | $40,000 | $51 | 60 |
| 2831 W Elm St | 0.63mi | 2/1.0 | 770 (+7%) | 4mo | $106,000 | $138 | 56 |
| 2617 W Elm St | 0.44mi | 2/1.0 | 784 (+9%) | 16mo | $129,900 | $166 | 51 |
| 207 N Forest Ave | 0.53mi | 2/1.0 | 624 (-13%) | 6mo | $125,000 | $200 | 48 |
| 2546 W Walnut St | 0.45mi | 2/1.0 | 824 (+14%) | 9mo | $108,000 | $131 | 48 |
| 229 N Scenic Ave | 0.65mi | 2/1.0 | 664 (-8%) | 12mo | $87,500 | $132 | 47 |
| 2623 W Elm St | 0.44mi | 2/1.0 | 812 (+13%) | 15mo | $124,900 | $154 | 46 |
| 906 S Kansas Ave | 0.73mi | 2/1.0 | 660 (-8%) | 10mo | $69,900 | $106 | 44 |
| 2935 W State St | 0.65mi | 2/1.0 | 812 (+13%) | 13mo | $120,000 | $148 | 38 |
Match score weights: distance 35% · size 25% · config 20% · recency 20%. Top-matched comps best support the ARV.
Projected returns pro-forma
-3.0% appreciation · 4.82% rent growth · sell at horizon
- IRR
- 4.0%
- Equity multiple
- 1.16×
- Total profit
- $3,551
- Equity at exit
- $11,913
- IRR
- 15.0%
- Equity multiple
- 2.31×
- Total profit
- $29,296
- Equity at exit
- $6,908
Cash invested: $22,372 (down + closing). Projections, not guarantees.
Landlord ↔ Tenant lean methodology
- Overall (STATE)
- 81 Strongly Landlord-Friendly
- State Missouri
- 81 Strongly Landlord-Friendly · R+10
- County
- — inherits STATE
- City
- — inherits STATE
ZIP-level market 65802
- Home prices YoY
- -31.9%
- Rents YoY
- 4.8%
- Active inventory
- 512
- Price-to-rent
- 7.3×
Monthly cashflow live
- Estimated rent
- $909 high interval (Pro) →
- Mortgage (P&I)
- −$419
- Tax from tax record
- −$33 /mo · $394/yr
- Insurance
- −$33
- HOA
- −$0
- Vacancy / Maint / Mgmt
- −$191
- Net cashflow
- $233
Break-even live
UW: 25.0% down · 7.5% · 30yr · 1.5% tax · 5.0% vac · 8.0% maint · 8.0% mgmt
Financing live
Cash to close
- Down payment
- $19,975
- Closing costs
- $2,397
- Reserves months
- —
- Total cash needed
- —
Loan-product check · same deal, 3 products live
Conventional
25% down · 7.5% · 30yr
- Down + closing
- —
- Monthly P&I
- —
- Monthly cashflow
- —
- DSCR
- —
- Eligible?
- —
Personal DTI + credit; lowest rate.
DSCR
20% down · 8.5% · 30yr
- Down + closing
- —
- Monthly P&I
- —
- Monthly cashflow
- —
- DSCR
- —
- Eligible?
- —
No personal income docs; deal must DSCR.
Hard money
10% down · 12.0% · 12mo
- Down + closing
- —
- Monthly P&I
- —
- Monthly cashflow
- —
- DSCR
- —
- Eligible?
- —
Short-term bridge; refi at stabilization.
Rent comps 10 comps
| Address | Beds | Baths | Sqft | Rent | $/sqft | DOM | Units | Dist |
|---|---|---|---|---|---|---|---|---|
| 520 S Scenic Ave Unit 101-A Springfield, MO | 1.0 | 1.0 | 550 | $650 | $1.18 | 43d | 1 | 0.46mi |
| 1911 W Elm St Springfield, MO | 2.0 | 1.0 | 580 | $875 | $1.51 | 43d | 1 | 0.57mi |
| 2711 W Olive St Springfield, MO | 1.0 | 1.0 | 621 | $750 | $1.21 | 23d | 1 | 0.72mi |
| 1740 W Olive St Springfield, MO | 3.0 | 1.0 | 736 | $1,195 | $1.62 | 13d | 1 | 0.80mi |
| 522 N Park Ave Springfield, MO | 1.0 | 1.0 | 608 | $950 | $1.56 | 43d | 1 | 0.91mi |
| 1634 S Marion Ave Springfield, MO | 3.0 | 1.0–2.0 | 845 | $1,404 | $1.66 | 13d | 23 | 1.13mi |
| 2712 W Nichols St Springfield, MO | 2.0 | 1.0 | 619 | $795 | $1.28 | 43d | 1 | 1.29mi |
| 810 W Catalpa St Apt 316 Springfield, MO | 1.0 | 1.0 | 581 | $551 | $0.95 | 23d | 1 | 1.33mi |
| 916 N Kansas Expy Springfield, MO | 1.0 | 1.0 | 573 | $595 | $1.04 | 43d | 1 | 1.41mi |
| 733 W College St Springfield, MO | 1.0 | 1.0 | 700 | $750 | $1.07 | 13d | 1 | 1.48mi |
Listing history 16 events
-
2026-06-18days on market $79,900 Active 35 DOM
-
2026-06-17days on market $79,900 Active 34 DOM
-
2026-06-16days on market $79,900 Active 33 DOM
-
2026-06-15days on market $79,900 Active 32 DOM
-
2026-06-14days on market $79,900 Active 30 DOM
-
2026-06-10days on market $79,900 Active 27 DOM
-
2026-06-09days on market $79,900 Active 26 DOM
-
2026-06-08days on market $79,900 Active 25 DOM
-
2026-06-07days on market $79,900 Active 24 DOM
-
2026-06-03days on market $79,900 Active 20 DOM
-
2026-06-02days on market $79,900 Active 19 DOM
-
2026-06-01days on market $79,900 Active 18 DOM
-
2026-05-31days on market $79,900 Active 17 DOM
-
2026-05-30days on market $79,900 Active 16 DOM
-
2026-05-14$65,000 Active 223-char remark
-
2004-03-01soldstatus
ⓘ Source: listings_history table (triggers on properties + properties_extension) + one-shot
backfill from property_details.listing_events for pre-trigger history.
Tax reassessment forecast MO · Resets to sale price
- Current annual tax
- $394 · $33/mo
- Projected year-2 tax
- $775 · $65/mo
- Expected delta
- +$381/yr (+$32/mo · 96.9%)
ⓘ Screening estimate from a state-policy table — verify with the county assessor before closing.
Climate risk First Street
- Flood 1/10 Low FEMA zone X (unshaded) · 0% chance over 30 yrs
- Wildfire 1/10 Low
- Heat 5/10 Major 7 d/yr ≥104°F today · 18 d/yr by 30 yrs out
- Wind 2/10 Low 0% chance of damaging wind over 30 yrs
- Air quality 2/10 Low 1 unhealthy d/yr today · 2 by 30 yrs out
Nearby sold comps map
Loading sold comps map…
Walkable amenities ~0.75 mi
Loading nearby amenities…
Taxation est. · year 1
- Rental income
- $10,906
- − Mortgage interest
- −$4,476
- − Property taxes
- −$394
- − Insurance
- −$400
- − Repairs & maintenance
- −$872
- − Management
- −$872
- − Depreciation
- −$2,324
- Taxable income
- $1,568
- Est. tax owed @ 24.0%
- −$376
- After-tax cash flow
- $2,418/yr
For passive investors: Depreciation is non-cash, so a rental often shows a tax loss while cash-flowing — sheltering income. Rental losses are passive: they offset passive income freely, and up to $25,000/yr can offset ordinary (W-2) income if you actively participate and your MAGI is under $100k (phasing out to $0 by $150k); unused losses carry forward. On sale, claimed depreciation is recaptured at up to 25%, and gains may owe capital-gains tax (a 1031 exchange can defer both). Figures are a year-1 estimate at your 24.0% rate — not tax advice; consult a CPA.
Schools (NCES district)
- District
- Springfield R-XII
- NCES district ID
- 2928860
- Math proficiency
- 32% ▼ -2.00%
- Reading proficiency
- 46% ▼ -3.00%
- Median HH income
- $37,886
- Composite
- 32.45/100
- National rank
- #5717
- State rank
- #174 of 324 in MO
Livability — Springfield
- Score
- 75/100
- State rank
- #57
- US rank
- #4121
Category grades
Schools grade is shown separately in the Schools card above.
Census & demographics
- Census place
- Springfield, MO
- County
- Greene County · 244,327 people
- City population
- 223,044
- Metro
- Springfield, MO
- Population (ZIP)
- 46,739
- Household income
- $55,019
- Rent vs Own
- Severe rent burden
- 1818.0
Population outlook (Greene County) Hauer SSP2
- Today (2025)
- 319,054 people
- By 2030
- 335,135 · +5.0%
- By 2040
- 366,186 · +14.8%
- By 2050
- 397,431 · +24.6%
- By 2075
- 477,035 · +49.5%
- By 2100
- 520,828 · +63.2%
Race, ethnicity, and origin ACS 2023
- Neighborhood character
- Predominantly White (81%)
- Race & ethnicity
- White 81% Two or more races 8% Hispanic / Latino 5% Black 4% Asian 2%
- Common ancestry
- Slovak 2% Lithuanian 2% Italian 2%
- Foreign-born
- 3% · Canada, Vietnam
- Languages at home
- 95% English-only · Spanish 2% Vietnamese 1% Other Indo-European 1%
Political lean MEDSL · Greene
- 2024 margin
- Strong R (+20.8) · D 38.9% · R 59.7% · Other 1.4%
- 2008→2024 swing
- -5.0pp toward R · 2008: -15.8pp · 2024: -20.8pp
- All cycles
- 2024: R+20.8 2020: R+20.1 2016: R+27.4 2012: R+24.4 2008: R+15.8
Not yet ingested
- Civics
- —
Market trends
- HPI YoY
- ▼ -99.72%
- Current HPI
- 212.9826
- Rent YoY
- ▲ 4.82%
- Metro
- Springfield, MO
- State GDP YoY
- ▲ 1.84%
- F500 in state
- 20
Industry mix (Fortune 500 HQ in MO)
| Industry | F500 HQs | Revenue |
|---|---|---|
| Healthcare | 1 | $163B |
|
||
| Insurance | 1 | $21B |
|
||
| Industrial Technology | 1 | $17B |
|
||
| Retail | 1 | $16B |
|
||
| Industrial Distribution | 1 | $10B |
|
||
| Utilities | 1 | $9B |
|
||
Price history
+22.9% since first listed3 events — show timeline
- 2026-05-22 Price Changed $79,900 SOMO
- 2026-05-14 Listed $65,000 SOMO
- 2004-03-01 Sold (Public Records) — Public Records
Property tax history
+2.6%/yrLatest (2025): $394 · +29.2% YoY. Source: county tax records.
Cash-flow waterfall
monthlySold comps — $/sqft
last 12 mo · ≤1 miLoading sold comps…