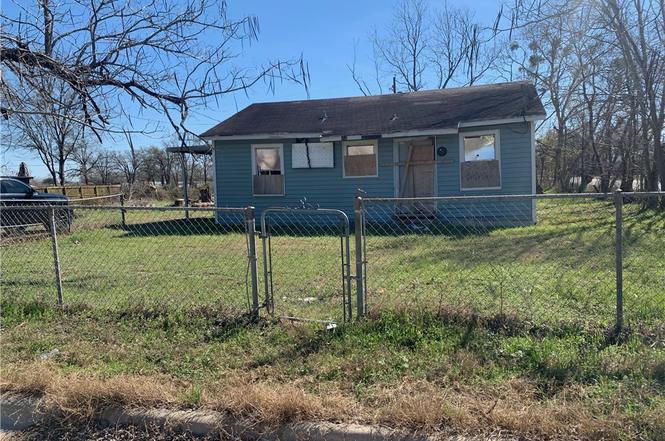
813 Foster St · Navasota, TX
Flood risk 1/10 · Minimal
- FEMA flood zone
- X (unshaded)
- Chance of flooding over 30 yrs
- 0.0%
- Est. flood insurance / yr
- $507 – $1,088
Fire risk 5/10 · Moderate
- Est. fire insurance / yr
- $1,222 – $2,270
Heat risk 8/10 · Major
- Hot days now (above 111°F)
- 7 days/yr
- Hot days in 30 yrs
- 21 days/yr
Wind risk 8/10 · Major
- Chance of severe wind over 30 yrs
- 98.0%
Air-quality risk 2/10 · Minimal
- Unhealthy air days now
- 0 days/yr
- Unhealthy air days in 30 yrs
- 1 days/yr
Risk factors via First Street. Map © Google.
Why this score? — see what drove the B- grade
The composite is a weighted blend of 9 inputs, each scored 0–100. Each bar is that input's sub-score; the figure is the points it added to the 100-point composite (weight × sub-score).
- Cash flow +30.0/30.0
- 1% rule +10.0/10.0
- DSCR +10.0/10.0
- ARV discount +7.7/15.0
- Livability +3.2/5.0
- Schools +2.7/10.0
- Rent growth +2.5/5.0
- Condition / age +2.5/5.0
- Appreciation +0.0/10.0
$65,000
🖨 Deal sheet 📄 Offer letter ✓ Due diligence
Listing remarks MLS
Take a look at this 2-bedroom, 1-bath fixer-upper situated on a corner lot less than a mile from downtown Navasota. This property offers an opportunity for investors or buyers ready to add their personal touch. With its convenient location near local shops and dining, the potential is there to renovate, refresh, and make it your own. Buyer to verify the square footage.
Key facts
- Near dining
- Near local shops
- Convenient location
Tags
Neighborhood map
What this means for you Summary
Snapshot
- This is a 2-bed/1.0-bath single-family listed at $65k.
Deal economics
- At list price, monthly cash flow is $642 ($8k/yr) — positive.
- The deal already cash-flows at list — no discount required.
- Meets the 1% rule at list price ($1k rent vs $65k).
- Cap rate 18.1% vs local median 3.8% in Navasota — top-decile yield for the area; either an underpriced asset or a hidden risk that comps aren't pricing in. Stress-test before assuming the spread holds.
Location & tenants
- Location reads 63/100 on livability (#852 in TX) — a middle-class / working-renter tenant base. Strengths: cost of living A+, housing A+; Watch: crime F, amenities F, commute F.
- Navasota ISD (town): math 31% / reading 31% proficiency, ranked #600 of 826 in TX (top 73%) — families likely to look elsewhere, expect single-tenant / working-renter base with shorter leases; 68% free/reduced lunch — lower-income household profile, screen leases tightly.
- Zoned schools: Navasota J H (math 26% / reading 30%, grade F, #1,143 of 1,662 statewide, top 69%, 664 students, 82% FRL); Navasota H S (math 34% / reading 32%, grade F, #1,023 of 1,632 statewide, top 63%, 884 students, 73% FRL).
- Market conditions: 256 active listings in the ZIP; 3 comparable units currently listed for rent nearby; rentals leasing fast (median 10d on market — plan ~1-2 weeks tenant-placement turnaround); 110 units permitted in Grimes County in 2024 (0 in 5+ unit buildings).
Forward outlook
- Local home prices are declining (-3.0%/yr); year-one equity from $449 of loan paydown is wiped out by about $2k of value loss. Plan a longer hold.
- Grimes County population projected at +10% by 2050 — modest demand growth; plan on rents tracking national, not racing it.
- At projected returns (-3.0% appreciation + 3.0% rent growth), your $18k cash investment doubles in ~3 years — after that, you're playing with house money.
Negotiation context
- Only 11 days on market — expect competitive offers; lowballing is unlikely to land.
- 2 sale attempts with the ask held roughly flat each time — persistent listings suggest the price (not the market) is what's stuck; bring a comps-based counter.
Risks & watch-outs
- Watch-outs: built in 1955 — expect roof / HVAC / electrical / plumbing capex.
- Climate carrying-cost: severe wind risk, 98% chance of damaging wind over 30y; moderate wildfire risk; extreme-heat days projected 7→21/yr by 2055 (HVAC capex compounding) — expect insurance premiums to compound above CPI over the hold.
Questions for the listing agent
- Built in 1955 — when were the roof, HVAC, electrical panel, plumbing, and water heater last replaced?
- Is there a deadline driving the sale (1031 exchange, divorce, estate, relocation)? That informs how much negotiation room exists.
- Schools are F-rated, which usually means shorter tenancies and higher turnover. Who's the typical renter profile here, and what's been the actual vacancy rate?
- Crime grade is F in this area — have there been break-ins, vandalism, or insurance claims at this property in the last 3 years? What carrier currently insures it and at what premium?
- What's the average days-on-market for RENTAL listings here right now (not sales)? A rising rental-DOM trend means longer vacancies and softer asking-rent achievability than the comps imply.
- What's the recent tenant-quality profile in this submarket — average credit score on applications, eviction rate, late-payment / NSF rate, and stable-employment percentage? A property-management company in the area should have these aggregated.
- How much new for-sale + rental construction is in the pipeline within 1–3 miles? Heavy new supply typically softens prices + rents 12–24 months out; constrained supply supports both.
Investment metrics
- 1% rule
- 2.08% ✓
- Cap rate
- 18.14%
- Cash-on-cash
- 42.32%
- DSCR
- 2.88
- GRM
- 4.0
CMA / ARV
- ARV (on-the-fly)
- $65,280
- Comps found
- 1
Show comp detail 1 sale within ~0.75 mi
| Address | Dist | Beds/Ba | Sqft | Sold | Price | $/sf | Match |
|---|---|---|---|---|---|---|---|
| 813 Foster St | 0.00mi | 2/1.0 | 960 (0%) | 1mo | $65,000 | $68 | 99 |
Match score weights: distance 35% · size 25% · config 20% · recency 20%. Top-matched comps best support the ARV.
Projected returns pro-forma
-3.0% appreciation · 3.0% rent growth · sell at horizon
- IRR
- 39.0%
- Equity multiple
- 2.67×
- Total profit
- $30,350
- Equity at exit
- $9,692
- IRR
- 45.4%
- Equity multiple
- 5.35×
- Total profit
- $79,091
- Equity at exit
- $5,620
Cash invested: $18,200 (down + closing). Projections, not guarantees.
Landlord ↔ Tenant lean methodology
- Overall (STATE)
- 87 Strongly Landlord-Friendly
- State Texas
- 87 Strongly Landlord-Friendly · R+5
- County
- — inherits STATE
- City
- — inherits STATE
ZIP-level market 77868
- Home prices YoY
- -20.1%
- Active inventory
- 256
- Price-to-rent
- 4.0×
Monthly cashflow live
- Estimated rent
- $1,353 medium interval (Pro) →
- Mortgage (P&I)
- −$341
- Tax from tax record
- −$59 /mo · $706/yr
- Insurance
- −$27
- HOA
- −$0
- Vacancy / Maint / Mgmt
- −$284
- Net cashflow
- $642
Break-even live
UW: 25.0% down · 7.5% · 30yr · 1.5% tax · 5.0% vac · 8.0% maint · 8.0% mgmt
Financing live
Cash to close
- Down payment
- $16,250
- Closing costs
- $1,950
- Reserves months
- —
- Total cash needed
- —
Loan-product check · same deal, 3 products live
Conventional
25% down · 7.5% · 30yr
- Down + closing
- —
- Monthly P&I
- —
- Monthly cashflow
- —
- DSCR
- —
- Eligible?
- —
Personal DTI + credit; lowest rate.
DSCR
20% down · 8.5% · 30yr
- Down + closing
- —
- Monthly P&I
- —
- Monthly cashflow
- —
- DSCR
- —
- Eligible?
- —
No personal income docs; deal must DSCR.
Hard money
10% down · 12.0% · 12mo
- Down + closing
- —
- Monthly P&I
- —
- Monthly cashflow
- —
- DSCR
- —
- Eligible?
- —
Short-term bridge; refi at stabilization.
Rent comps 3 comps
| Address | Beds | Baths | Sqft | Rent | $/sqft | DOM | Units | Dist |
|---|---|---|---|---|---|---|---|---|
| 202 N Second St Navasota, TX | 2.0 | 1.0 | 800 | $1,025 | $1.28 | 10d | 1 | 0.16mi |
| 803 E McAlpine St Navasota, TX | 1.0 | 1.0 | 800 | $1,000 | $1.25 | 12d | 1 | 0.97mi |
| 118 Miller St Unit 1328087P Navasota, TX | 2.0 | 1.0 | 904 | $4,431 | $4.90 | 5d | 1 | 1.47mi |
Listing history 5 events
-
2026-03-17status Pending
-
2026-03-09status Pending 371-char remark
Show marketing remark (371 chars)
Take a look at this 2-bedroom, 1-bath fixer-upper situated on a corner lot less than a mile from downtown Navasota. This property offers an opportunity for investors or buyers ready to add their personal touch. With its convenient location near local shops and dining, the potential is there to renovate, refresh, and make it your own. Buyer to verify the square footage.
-
2026-03-09status Pending
Show marketing remark (371 chars)
Take a look at this 2-bedroom, 1-bath fixer-upper situated on a corner lot less than a mile from downtown Navasota. This property offers an opportunity for investors or buyers ready to add their personal touch. With its convenient location near local shops and dining, the potential is there to renovate, refresh, and make it your own. Buyer to verify the square footage.
-
2026-03-06$65,000 Active
-
2026-02-24$65,000 Active 371-char remark
Show marketing remark (371 chars)
Take a look at this 2-bedroom, 1-bath fixer-upper situated on a corner lot less than a mile from downtown Navasota. This property offers an opportunity for investors or buyers ready to add their personal touch. With its convenient location near local shops and dining, the potential is there to renovate, refresh, and make it your own. Buyer to verify the square footage.
ⓘ Source: listings_history table (triggers on properties + properties_extension) + one-shot
backfill from property_details.listing_events for pre-trigger history.
Tax reassessment forecast TX · Resets to sale price
- Current annual tax
- $706 · $59/mo
- Projected year-2 tax
- $1,190 · $99/mo
- Expected delta
- +$483/yr (+$40/mo · 68.5%)
ⓘ Screening estimate from a state-policy table — verify with the county assessor before closing.
Climate risk First Street
- Flood 1/10 Low FEMA zone X (unshaded) · 0% chance over 30 yrs
- Wildfire 5/10 Major
- Heat 8/10 Severe 7 d/yr ≥111°F today · 21 d/yr by 30 yrs out
- Wind 8/10 Severe 98% chance of damaging wind over 30 yrs
- Air quality 2/10 Low 0 unhealthy d/yr today · 1 by 30 yrs out
Nearby sold comps map
Loading sold comps map…
Walkable amenities ~0.75 mi
Loading nearby amenities…
Taxation est. · year 1
- Rental income
- $16,232
- − Mortgage interest
- −$3,641
- − Property taxes
- −$706
- − Insurance
- −$325
- − Repairs & maintenance
- −$1,299
- − Management
- −$1,299
- − Depreciation
- −$1,891
- Taxable income
- $7,072
- Est. tax owed @ 24.0%
- −$1,697
- After-tax cash flow
- $6,004/yr
For passive investors: Depreciation is non-cash, so a rental often shows a tax loss while cash-flowing — sheltering income. Rental losses are passive: they offset passive income freely, and up to $25,000/yr can offset ordinary (W-2) income if you actively participate and your MAGI is under $100k (phasing out to $0 by $150k); unused losses carry forward. On sale, claimed depreciation is recaptured at up to 25%, and gains may owe capital-gains tax (a 1031 exchange can defer both). Figures are a year-1 estimate at your 24.0% rate — not tax advice; consult a CPA.
Schools (NCES district)
- District
- Navasota ISD
- NCES district ID
- 4832190
- Math proficiency
- 31% ▲ 1.00%
- Reading proficiency
- 31% ▲ 1.00%
- Median HH income
- $44,326
- Composite
- 26.5/100
- National rank
- #7205
- State rank
- #600 of 826 in TX
Livability — Navasota
- Score
- 63/100
- State rank
- #852
- US rank
- #15344
Category grades
Schools grade is shown separately in the Schools card above.
Census & demographics
- Census place
- Navasota, TX
- Population (ZIP)
- 18,863
Population outlook (Grimes County) Hauer SSP2
- Today (2025)
- 28,910 people
- By 2030
- 29,539 · +2.2%
- By 2040
- 30,648 · +6.0%
- By 2050
- 31,698 · +9.6%
- By 2075
- 34,351 · +18.8%
- By 2100
- 33,565 · +16.1%
Race, ethnicity, and origin ACS 2023
- Neighborhood character
- Diverse neighborhood (Simpson 0.67)
- Race & ethnicity
- White 44% Hispanic / Latino 33% Two or more races 18% Black 17%
- Hispanic origin (detail)
- Mexican 30%
- Common ancestry
- Romanian 3% Lithuanian 2% Serbian 1%
- Foreign-born
- 9% · Canada
- Languages at home
- 71% English-only · Spanish 27% Russian/Polish/Slavic 1%
Political lean MEDSL · Grimes
- 2024 margin
- Solid R (+60.3) · D 19.5% · R 79.7%
- 2008→2024 swing
- -25.9pp toward R · 2008: -34.3pp · 2024: -60.3pp
- All cycles
- 2024: R+60.3 2020: R+53.2 2016: R+51.1 2012: R+44.2 2008: R+34.3
Not yet ingested
- Civics
- —
Market trends
- HPI YoY
- ▼ -52.02%
- Current HPI
- 206.7894
- Rent YoY
- —
- Metro
- —
- State GDP YoY
- ▲ 3.95%
- F500 in state
- 110
Industry mix (Fortune 500 HQ in TX)
| Industry | F500 HQs | Revenue |
|---|---|---|
| Energy | 16 | $1,198B |
|
||
| Technology | 5 | $198B |
|
||
| Engineering / Construction | 4 | $72B |
|
||
| Energy Services | 3 | $60B |
|
||
| Utilities | 3 | $41B |
|
||
| Healthcare | 2 | $330B |
|
||
Price history
+0.0% since first listed5 events — show timeline
- 2026-03-17 Pending — HARMLS
- 2026-03-09 Pending — BCSRMLS
- 2026-03-09 Pending — HARMLS
- 2026-03-06 Listed $65,000 HARMLS
- 2026-02-24 Listed $65,000 BCSRMLS
Property tax history
+2.7%/yrLatest (2025): $706 · +0.1% YoY. Source: county tax records.
Cash-flow waterfall
monthlySold comps — $/sqft
last 12 mo · ≤1 miLoading sold comps…