 Triplex
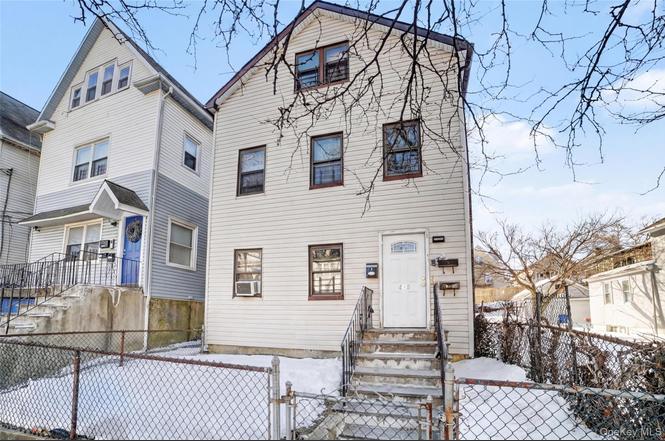
420 S 9th Ave · Mount Vernon, NY
Flood risk 1/10 · Minimal
- FEMA flood zone
- X (unshaded)
- Chance of flooding over 30 yrs
- 0.0%
- Est. flood insurance / yr
- $507 – $1,088
Fire risk 1/10 · Minimal
- Est. fire insurance / yr
- $691 – $1,283
Heat risk 6/10 · Moderate
- Hot days now (above 98°F)
- 7 days/yr
- Hot days in 30 yrs
- 15 days/yr
Wind risk 6/10 · Moderate
- Chance of severe wind over 30 yrs
- 27.0%
Air-quality risk 5/10 · Moderate
- Unhealthy air days now
- 6 days/yr
- Unhealthy air days in 30 yrs
- 8 days/yr
Risk factors via First Street. Map © Google.
Why this score? — see what drove the B- grade
The composite is a weighted blend of 9 inputs, each scored 0–100. Each bar is that input's sub-score; the figure is the points it added to the 100-point composite (weight × sub-score).
- Cash flow +23.4/30.0
- ARV discount +15.0/15.0
- DSCR +7.5/10.0
- 1% rule +6.9/10.0
- Schools +3.7/10.0
- Livability +3.6/5.0
- Rent growth +3.3/5.0
- Condition / age +2.5/5.0
- Appreciation +0.0/10.0
$699,000
🖨 Deal sheet 📄 Offer letter ✓ Due diligence
Multi-family units
County records classify this as Multi-Family (2-4 Unit). Listing-text estimate: 3 units. confirmed
Listing remarks
3-unit income property currently occupied with reliable tenants and strong cash flow! Units are in great condition with bright windows and well-kept grounds. Located in prime area with easy transit access. You can choose to either occupy one unit and lease the other two — or lease all three for maximum return. Proven appreciation and steady demand make this a smart portfolio addition. Act now to secure this stable, high-performing investment!
Key facts
- Strong cash flow
- Great condition
- Bright windows
Tags
Neighborhood map
What this means for you Summary
Snapshot
- This is a 3 × 2-bed/1.0-bath units multifamily listed at $699k.
Deal economics
- At list price, monthly cash flow is $1k ($15k/yr) — positive. Per door: $429/mo.
- The deal already cash-flows at list — no discount required.
- Meets the 1% rule at list price ($8k rent vs $699k).
- Recommended offer: $678k (3.0% below list) — sets the bar for market timing.
- Cap rate 8.5% vs local median 5.3% in Mount Vernon — top-decile yield for the area; either an underpriced asset or a hidden risk that comps aren't pricing in. Stress-test before assuming the spread holds.
Location & tenants
- Location reads 71/100 on livability (#397 in NY) — a middle-class / working-renter tenant base. Strengths: commute A+, health & safety A, employment B; Watch: crime D-, cost of living F.
- Mount Vernon School District (suburban): math 35% / reading 50% proficiency, ranked #485 of 590 in NY (top 82%) — families likely to look elsewhere, expect single-tenant / working-renter base with shorter leases; 62% free/reduced lunch — lower-income household profile, screen leases tightly.
- Zoned schools: Rebecca Turner Elementary School (math 54% / reading 74%, grade B, #591 of 2,108 statewide, top 31%, 218 students, 70% FRL); Benjamin Turner Middle School (math 8% / reading 32%, grade F, #678 of 729 statewide, top 94%, 196 students, 71% FRL); Denzel Washington School-Arts (math 57% / reading 84%, grade B+, #701 of 1,100 statewide, top 64%, 383 students, 58% FRL) — zoned schools at 66% FRL track the district average.
- Market conditions: Rents rising (+3.4%/yr); 130 active listings in the ZIP; 954 units permitted in Westchester County in 2024 (649 in 5+ unit buildings).
- At $8,327/mo this rent would consume 165% of the median local household income ($61k/yr) (locally 2963% of renters already pay >50% of income on rent) — very limited rent-growth headroom before tenants either downsize or default.
Forward outlook
- Local home prices are declining (-3.0%/yr); year-one equity from $5k of loan paydown is wiped out by about $21k of value loss. Plan a longer hold.
- Westchester County population projected at +10% by 2050 — modest demand growth; plan on rents tracking national, not racing it.
Negotiation context
- It's been on market 34 days — a 3% lower offer ($678k) is reasonable based on typical stale-listing flexibility.
- 5 sale attempts since 8y ago with the ask held roughly flat each time — persistent listings suggest the price (not the market) is what's stuck; bring a comps-based counter.
- Current owner paid $318k; list at $699k implies a 120% gain — meaningful room to come down on a strong offer.
Risks & watch-outs
- Watch-outs: built in 1930 — expect roof / HVAC / electrical / plumbing capex.
- Climate carrying-cost: major wind risk, 27% chance of damaging wind over 30y; extreme-heat days projected 7→15/yr by 2055 (HVAC capex compounding) — expect insurance premiums to compound above CPI over the hold.
Questions for the listing agent
- It's been on market 34 days. Have you received any prior offers? Is the seller open to a 3% concession, seller financing, or rate buy-down credit?
- Can we see the unit-by-unit rent roll, current vacancy, and any below-market leases? What's the average tenancy length?
- What capital expenditures (roof, boiler, parking lot, exteriors) have been made in the last 5 years, and what's planned in the next 2?
- Built in 1930 — when were the roof, HVAC, electrical panel, plumbing, and water heater last replaced?
- Is there a deadline driving the sale (1031 exchange, divorce, estate, relocation)? That informs how much negotiation room exists.
- Crime grade is D in this area — have there been break-ins, vandalism, or insurance claims at this property in the last 3 years? What carrier currently insures it and at what premium?
- What's the average days-on-market for RENTAL listings here right now (not sales)? A rising rental-DOM trend means longer vacancies and softer asking-rent achievability than the comps imply.
- What's the recent tenant-quality profile in this submarket — average credit score on applications, eviction rate, late-payment / NSF rate, and stable-employment percentage? A property-management company in the area should have these aggregated.
- How much new apartment / multifamily construction is in the pipeline within 1–3 miles? Heavy new supply (>2% of stock underway) typically softens rents 12–24 months out; light construction supports rent growth.
Investment metrics
- 1% rule
- 1.19% ✓
- Cap rate
- 8.50%
- Cash-on-cash
- 7.90%
- DSCR
- 1.35
- GRM
- 7.0
CMA / ARV
- ARV (on-the-fly)
- $840,840
- Comps found
- 12
Show comp detail 12 sales within ~0.75 mi
| Address | Dist | Beds/Ba | Sqft | Sold | Price | $/sf | Match |
|---|---|---|---|---|---|---|---|
| 4415 Mundy Ln | 0.15mi | 5/3.0 (-1) | 2,650 (-7%) | 8mo | $873,000 | $329 | 69 |
| 4315 Murdock Ave | 0.31mi | 5/3.0 (-1) | 2,760 (-4%) | 8mo | $680,000 | $246 | 68 |
| 349 S 4th Ave | 0.30mi | 6/2.0 | 2,700 (-6%) | 7mo | $1,000,000 | $370 | 67 |
| 132 East 4th St | 0.58mi | 6/2.0 | 2,800 (-2%) | 0mo | $700,000 | $250 | 65 |
| 515 S 9th Ave | 0.17mi | 5/2.0 (-1) | 2,627 (-8%) | 9mo | $640,000 | $244 | 62 |
| 32 Duryea Ave | 0.43mi | 5/3.0 (-1) | 2,624 (-8%) | 6mo | $875,000 | $333 | 56 |
| 4212 Monticello Ave | 0.28mi | 5/2.0 (-1) | 3,163 (+11%) | 6mo | $959,000 | $303 | 56 |
| 4216 Edson Ave | 0.49mi | 6/3.0 | 3,186 (+11%) | 3mo | $930,000 | $292 | 55 |
| 418 S 1st Ave | 0.41mi | 7/4.0 (+1) | 3,128 (+9%) | 6mo | $919,000 | $294 | 51 |
| 415 S 2nd Ave | 0.38mi | 7/2.0 (+1) | 2,614 (-9%) | 13mo | $870,000 | $333 | 48 |
| 123 S 8th Ave | 0.51mi | 6/3.0 | 2,500 (-13%) | 12mo | $700,000 | $280 | 45 |
| 4063 Ely Ave | 0.74mi | 6/2.0 | 3,119 (+9%) | 9mo | $895,000 | $287 | 39 |
Match score weights: distance 35% · size 25% · config 20% · recency 20%. Top-matched comps best support the ARV.
Projected returns pro-forma
-3.0% appreciation · 3.37% rent growth · sell at horizon
- IRR
- -3.8%
- Equity multiple
- 0.86×
- Total profit
- $-27,692
- Equity at exit
- $104,223
- IRR
- 6.4%
- Equity multiple
- 1.49×
- Total profit
- $96,068
- Equity at exit
- $60,437
Cash invested: $195,720 (down + closing). Projections, not guarantees.
Landlord ↔ Tenant lean methodology
- Overall (STATE)
- 15 Strongly Tenant-Friendly
- State New York
- 15 Strongly Tenant-Friendly · D+10
- County
- — inherits STATE
- City
- — inherits STATE
ZIP-level market 10550
- Rents YoY
- 3.4%
- Active inventory
- 130
- Price-to-rent
- 21.0×
Monthly cashflow live
- Estimated rent
- $8,327 high interval (Pro) →
- Mortgage (P&I)
- −$3,666
- Tax from tax record
- −$1,333 /mo · $15,997/yr
- Insurance
- −$291
- HOA
- −$0
- Vacancy / Maint / Mgmt
- −$1,749
- Net cashflow
- $1,288
Break-even live
3-unit breakdown (identical units grouped — click to expand)
| Units | Beds | Baths | Est. rent |
|---|---|---|---|
| 3× units | 2 | 1 | $8,328 |
| #1 | 2 | 1 | $2,776 |
| #2 | 2 | 1 | $2,776 |
| #3 | 2 | 1 | $2,776 |
| Total (3 units) | $8,327 | ||
UW: 25.0% down · 7.5% · 30yr · 1.5% tax · 5.0% vac · 8.0% maint · 8.0% mgmt
Financing live
Cash to close
- Down payment
- $174,750
- Closing costs
- $20,970
- Reserves months
- —
- Total cash needed
- —
Loan-product check · same deal, 3 products live
Conventional
25% down · 7.5% · 30yr
- Down + closing
- —
- Monthly P&I
- —
- Monthly cashflow
- —
- DSCR
- —
- Eligible?
- —
Personal DTI + credit; lowest rate.
DSCR
20% down · 8.5% · 30yr
- Down + closing
- —
- Monthly P&I
- —
- Monthly cashflow
- —
- DSCR
- —
- Eligible?
- —
No personal income docs; deal must DSCR.
Hard money
10% down · 12.0% · 12mo
- Down + closing
- —
- Monthly P&I
- —
- Monthly cashflow
- —
- DSCR
- —
- Eligible?
- —
Short-term bridge; refi at stabilization.
Listing history 12 events
-
2026-04-24status Pending
-
2026-02-19$699,000 Active
-
2025-10-08historical $2,100
-
2025-08-08$2,100
-
2023-07-26price $687,000
-
2023-07-12$698,000 Active
-
2019-10-03historical
-
2019-05-06$599,999 Active
-
2018-10-11soldstatus $318,000
-
2018-09-14soldstatus $318,000 Sold
-
2018-08-07historical Pending
-
2018-06-25$329,000 Active
ⓘ Source: listings_history table (triggers on properties + properties_extension) + one-shot
backfill from property_details.listing_events for pre-trigger history.
Tax reassessment forecast NY · Partial reset (capped growth)
- Current annual tax
- $15,997 · $1,333/mo
- Projected year-2 tax
- $15,997 · $1,333/mo
- Expected delta
- $0/yr ($0/mo · 0.0%)
ⓘ Screening estimate from a state-policy table — verify with the county assessor before closing.
Climate risk First Street
- Flood 1/10 Low FEMA zone X (unshaded) · 0% chance over 30 yrs
- Wildfire 1/10 Low
- Heat 6/10 Major 7 d/yr ≥98°F today · 15 d/yr by 30 yrs out
- Wind 6/10 Major 27% chance of damaging wind over 30 yrs
- Air quality 5/10 Major 6 unhealthy d/yr today · 8 by 30 yrs out
Nearby sold comps map
Loading sold comps map…
Walkable amenities ~0.75 mi
Loading nearby amenities…
Taxation est. · year 1
- Rental income
- $99,924
- − Mortgage interest
- −$39,155
- − Property taxes
- −$15,997
- − Insurance
- −$3,495
- − Repairs & maintenance
- −$7,994
- − Management
- −$7,994
- − Depreciation
- −$20,335
- Taxable income
- $4,955
- Est. tax owed @ 24.0%
- −$1,189
- After-tax cash flow
- $14,271/yr
For passive investors: Depreciation is non-cash, so a rental often shows a tax loss while cash-flowing — sheltering income. Rental losses are passive: they offset passive income freely, and up to $25,000/yr can offset ordinary (W-2) income if you actively participate and your MAGI is under $100k (phasing out to $0 by $150k); unused losses carry forward. On sale, claimed depreciation is recaptured at up to 25%, and gains may owe capital-gains tax (a 1031 exchange can defer both). Figures are a year-1 estimate at your 24.0% rate — not tax advice; consult a CPA.
Schools (NCES district)
- District
- Mount Vernon School District
- NCES district ID
- 3620100
- Math proficiency
- 35% ▼ -3.00%
- Reading proficiency
- 50% ▲ 6.00%
- Median HH income
- $50,890
- Composite
- 36.59/100
- National rank
- #4631
- State rank
- #485 of 590 in NY
Livability — Mount Vernon
- Score
- 71/100
- State rank
- #397
- US rank
- #6876
Category grades
Schools grade is shown separately in the Schools card above.
Census & demographics
- Census place
- Mount Vernon, NY
- County
- Westchester County · 709,332 people
- City population
- 61,313
- Metro
- New York-Newark-Jersey City, NY-NJ-PA
- Population (ZIP)
- 38,972
- Household income
- $60,701
- Rent vs Own
- Severe rent burden
- 2963.0
Population outlook (Westchester County) Hauer SSP2
- Today (2025)
- 1,028,035 people
- By 2030
- 1,051,636 · +2.3%
- By 2040
- 1,098,520 · +6.9%
- By 2050
- 1,136,044 · +10.5%
- By 2075
- 1,196,925 · +16.4%
- By 2100
- 1,175,147 · +14.3%
Race, ethnicity, and origin ACS 2023
- Neighborhood character
- Predominantly Black (66%)
- Race & ethnicity
- Black 66% Hispanic / Latino 20% Two or more races 12% White 7% Asian 1%
- Hispanic origin (detail)
- Mexican 3% Puerto Rican 5% Dominican 4%
- Common ancestry
- Estonian 2% Hispanic 1% Russian 1%
- Foreign-born
- 34% · Canada, China, Jamaica
- Languages at home
- 73% English-only · Spanish 16% Other Indo-European 4% French/Haitian/Cajun 2%
Political lean MEDSL · Westchester
- 2024 margin
- Strong D (+26.3) · D 63.1% · R 36.9%
- 2008→2024 swing
- -1.3pp toward R · 2008: 27.6pp · 2024: 26.3pp
- All cycles
- 2024: D+26.3 2020: D+36.3 2016: D+32.8 2012: D+22.2 2008: D+27.6
Not yet ingested
- Civics
- —
Market trends
- HPI YoY
- ▼ -140.69%
- Current HPI
- 191.5235
- Rent YoY
- ▲ 3.37%
- Metro
- New York-Newark-Jersey City, NY-NJ-PA
- State GDP YoY
- ▲ 2.60%
- F500 in state
- 92
Industry mix (Fortune 500 HQ in NY)
| Industry | F500 HQs | Revenue |
|---|---|---|
| Financial Services | 10 | $950B |
|
||
| Consumer Goods | 9 | $162B |
|
||
| Insurance | 4 | $225B |
|
||
| Telecommunications | 2 | $144B |
|
||
| Pharmaceuticals | 2 | $112B |
|
||
| Media / Entertainment | 2 | $69B |
|
||
Price history
+112.5% since first listed12 events — show timeline
- 2026-04-24 Pending — OneKey® MLS as Distributed by MLS Grid
- 2026-02-19 Listed $699,000 OneKey® MLS as Distributed by MLS Grid
- 2025-10-08 Rental Removed $2,100 SHOWMOJO
- 2025-08-08 Listed for Rent $2,100 SHOWMOJO
- 2023-07-26 Price Changed $687,000 OneKey® MLS as Distributed by MLS Grid
- 2023-07-12 Listed $698,000 OneKey® MLS as Distributed by MLS Grid
- 2019-10-03 Listing Removed — OneKey® MLS as Distributed by MLS Grid
- 2019-05-06 Listed $599,999 OneKey® MLS as Distributed by MLS Grid
- 2018-10-11 Sold (Public Records) $318,000 Public Records
- 2018-09-14 Sold (MLS) $318,000 OneKey® MLS as Distributed by MLS Grid
- 2018-08-07 Contingent — OneKey® MLS as Distributed by MLS Grid
- 2018-06-25 Listed $329,000 OneKey® MLS as Distributed by MLS Grid
Property tax history
+2.2%/yrLatest (2025): $15,997 · +2.1% YoY. Source: county tax records.
Cash-flow waterfall
monthlySold comps — $/sqft
last 12 mo · ≤1 miLoading sold comps…