48600 Sugarbush Rd · New Baltimore, MI
Flood risk 1/10 · Minimal
- FEMA flood zone
- X (unshaded)
- Chance of flooding over 30 yrs
- 0.0%
- Est. flood insurance / yr
- $473 – $860
Fire risk 1/10 · Minimal
- Est. fire insurance / yr
- $784 – $1,456
Heat risk 3/10 · Minor
- Hot days now (above 96°F)
- 7 days/yr
- Hot days in 30 yrs
- 15 days/yr
Wind risk 1/10 · Minimal
- Chance of severe wind over 30 yrs
- —
Air-quality risk 4/10 · Minor
- Unhealthy air days now
- 4 days/yr
- Unhealthy air days in 30 yrs
- 5 days/yr
Risk factors via First Street. Map © Google.
Why this score? — see what drove the C- grade
The composite is a weighted blend of 9 inputs, each scored 0–100. Each bar is that input's sub-score; the figure is the points it added to the 100-point composite (weight × sub-score).
- Cash flow +18.6/30.0
- ARV discount +7.5/15.0
- 1% rule +6.7/10.0
- DSCR +5.8/10.0
- Schools +4.4/10.0
- Livability +4.2/5.0
- Rent growth +2.5/5.0
- Condition / age +1.0/5.0
- Appreciation +0.0/10.0
$125,000
🖨 Deal sheet 📄 Offer letter ✓ Due diligence
Listing remarks MLS
Last unit in the complex. End unit ranch. Full basement with washer and dryer. Investors welcome; rentable unit. Immediate occupancy. Will look at all reasonable offers including possible rent with option.
Key facts
- Washer and dryer
- End unit ranch
- Full basement
Tags
Property features AI
Finance
- Other: Residential condominium; Subdivision: SHORE VIEW PLACE
- HOA & community: Homeowners association dues of $168 per month; HOA covers grounds maintenance and water; Pets allowed (contact for details)
Exterior
- Parking: Assigned parking in a parking lot; No garage; basement access
- Utilities: Public water; Public sewer
- Home design: Condominium; One level; Brick construction
- Construction: Brick construction; Unfinished basement (foundation present)
- Exterior features: Private maintained road; Private road frontage; Ground-level entry
Interior
- Kitchen: Dishwasher; Free-standing gas oven and range; Free-standing refrigerator
- Bedrooms: Total of 4 rooms (includes living areas and bedrooms)
- Bathrooms: 1 full bathroom
- Heating & cooling: Forced air heating (natural gas); No central cooling
- Interior features: Dishwasher; Free-standing gas oven and range; Free-standing refrigerator; Unfinished basement
- Laundry & utility: Has heating (forced air, natural gas)
Neighborhood map
What this means for you Summary
Snapshot
- This is a 2-bed/1.0-bath condo listed at $125k. Condition is rated poor.
Deal economics
- At list price, monthly cash flow is $121 ($1k/yr) — positive.
- The deal already cash-flows at list — no discount required.
- Meets the 1% rule at list price ($1k rent vs $125k).
- Cap rate 7.5% vs local median 2.5% in New Baltimore — top-decile yield for the area; either an underpriced asset or a hidden risk that comps aren't pricing in. Stress-test before assuming the spread holds.
Location & tenants
- Location reads 85/100 on livability (#30 in MI, #597 nationally) — a professional / high-income tenant draw. Strengths: crime A+, employment A+, cost of living A+; Watch: health & safety D+, amenities F.
- Anchor Bay School District (suburban): math 44% / reading 54% proficiency, ranked #91 of 540 in MI (top 17%) — families likely to look elsewhere, expect single-tenant / working-renter base with shorter leases; only 20% free/reduced lunch — higher-income household profile.
- Market conditions: 236 active listings in the ZIP; 5 comparable units currently listed for rent nearby; rentals leasing fast (median 4d on market — plan ~1-2 weeks tenant-placement turnaround); solid renter incomes; 1,321 units permitted in Macomb County in 2024 (86 in 5+ unit buildings).
Forward outlook
- Local home prices are declining (-3.0%/yr); year-one equity from $864 of loan paydown is wiped out by about $4k of value loss. Plan a longer hold.
- Macomb County population projected at +9% by 2050 — modest demand growth; plan on rents tracking national, not racing it.
Negotiation context
- Only 12 days on market — expect competitive offers; lowballing is unlikely to land.
- 12 sale attempts since 8y ago; this cycle's ask is 5% above the opening price — seller raised mid-cycle; expect resistance to lowballs.
- Current owner paid $65k; list at $125k implies a 92% gain — meaningful room to come down on a strong offer.
Questions for the listing agent
- Have any recent inspections been done? Can we get a copy of the seller's disclosures and any deferred-maintenance estimates?
- What does the HOA fee cover, when was the last increase, and are there any pending special assessments or reserve-fund shortfalls?
- Any open or pending special assessments — roof, HVAC, plumbing, elevator, façade? What's the per-unit balance and payoff schedule, and is the seller paying it off at close or rolling it to the buyer?
- Is there a deadline driving the sale (1031 exchange, divorce, estate, relocation)? That informs how much negotiation room exists.
- Schools are B-rated — typically a magnet for longer-tenancy family renters. What's the average tenant stay here, and is there a school-zone premium baked into asking?
- What's the average days-on-market for RENTAL listings here right now (not sales)? A rising rental-DOM trend means longer vacancies and softer asking-rent achievability than the comps imply.
- What's the recent tenant-quality profile in this submarket — average credit score on applications, eviction rate, late-payment / NSF rate, and stable-employment percentage? A property-management company in the area should have these aggregated.
- How much new apartment / multifamily construction is in the pipeline within 1–3 miles? Heavy new supply (>2% of stock underway) typically softens rents 12–24 months out; light construction supports rent growth.
Investment metrics
- 1% rule
- 1.17% ✓
- Cap rate
- 7.46%
- Cash-on-cash
- 4.15%
- DSCR
- 1.18
- GRM
- 7.1
CMA / ARV
No comps found within radius.
Projected returns pro-forma
-3.0% appreciation · 3.0% rent growth · sell at horizon
- IRR
- -9.7%
- Equity multiple
- 0.65×
- Total profit
- $-12,418
- Equity at exit
- $18,638
- IRR
- -0.2%
- Equity multiple
- 0.99×
- Total profit
- $-374
- Equity at exit
- $10,808
Cash invested: $35,000 (down + closing). Projections, not guarantees.
Landlord ↔ Tenant lean methodology
- Overall (STATE)
- 62 Landlord-Friendly
- State Michigan
- 62 Landlord-Friendly · EVEN
- County
- — inherits STATE
- City
- — inherits STATE
ZIP-level market 48047
- Active inventory
- 236
- Price-to-rent
- 7.1×
Monthly cashflow live
- Estimated rent
- $1,459 high interval (Pro) →
- Mortgage (P&I)
- −$656
- Tax est. 1.5%
- −$156 /mo · $1,875/yr
- Insurance
- −$52
- HOA
- −$168
- Vacancy / Maint / Mgmt
- −$306
- Net cashflow
- $121
Break-even live
UW: 25.0% down · 7.5% · 30yr · 1.5% tax · 5.0% vac · 8.0% maint · 8.0% mgmt
Financing live
Cash to close
- Down payment
- $31,250
- Closing costs
- $3,750
- Reserves months
- —
- Total cash needed
- —
Loan-product check · same deal, 3 products live
Conventional
25% down · 7.5% · 30yr
- Down + closing
- —
- Monthly P&I
- —
- Monthly cashflow
- —
- DSCR
- —
- Eligible?
- —
Personal DTI + credit; lowest rate.
DSCR
20% down · 8.5% · 30yr
- Down + closing
- —
- Monthly P&I
- —
- Monthly cashflow
- —
- DSCR
- —
- Eligible?
- —
No personal income docs; deal must DSCR.
Hard money
10% down · 12.0% · 12mo
- Down + closing
- —
- Monthly P&I
- —
- Monthly cashflow
- —
- DSCR
- —
- Eligible?
- —
Short-term bridge; refi at stabilization.
Rent comps 5 comps
| Address | Beds | Baths | Sqft | Rent | $/sqft | DOM | Units | Dist |
|---|---|---|---|---|---|---|---|---|
| 48677 Sugarbush Rd Unit 2 New Baltimore, MI | 2.0 | 1.0 | 820 | $1,350 | $1.65 | 5d | 1 | 0.26mi |
| 29890 Donna Ln New Baltimore, MI | 2.0 | 1.5 | 1120 | $1,500 | $1.34 | 1d | 1 | 1.24mi |
| 50031 S Benny Ct New Baltimore, MI | 2.0 | 1.0 | 1056 | $1,450 | $1.37 | 43d | 1 | 1.25mi |
| 31871 Gabby CT New Baltimore, MI | 2.0 | 2.0 | 1131 | $1,995 | $1.76 | 1d | 5 | 1.27mi |
| 51166 Johns Dr New Baltimore, MI | 2.0 | 1.0 | 900 | $1,200 | $1.33 | 4d | 1 | 1.28mi |
HOA detail condo
- Monthly dues
- $168 · $2,016/yr
- Assessments
- None detected in remarks — confirm with the listing agent.
Listing history 9 events
-
2026-06-13statusdays on market $125,000 Pending 12 DOM
-
2026-06-09days on market $125,000 Active 11 DOM
-
2026-06-08days on market $125,000 Active 10 DOM
-
2026-06-07days on market $125,000 Active 9 DOM
-
2026-06-04days on market $125,000 Active 6 DOM
-
2026-06-03days on market $125,000 Active 5 DOM
-
2026-06-02days on market $125,000 Active 4 DOM
-
2026-06-01days on market $125,000 Active 3 DOM
-
2026-05-31pricedays on market $125,000 Active 2 DOM
ⓘ Source: listings_history table (triggers on properties + properties_extension) + one-shot
backfill from property_details.listing_events for pre-trigger history.
Climate risk First Street
- Flood 1/10 Low FEMA zone X (unshaded) · 0% chance over 30 yrs
- Wildfire 1/10 Low
- Heat 3/10 Moderate 7 d/yr ≥96°F today · 15 d/yr by 30 yrs out
- Wind 1/10 Low
- Air quality 4/10 Moderate 4 unhealthy d/yr today · 5 by 30 yrs out
Nearby sold comps map
Loading sold comps map…
Walkable amenities ~0.75 mi
Loading nearby amenities…
Taxation est. · year 1
- Rental income
- $17,513
- − Mortgage interest
- −$7,002
- − Property taxes
- −$1,875
- − Insurance
- −$625
- − Repairs & maintenance
- −$1,401
- − Management
- −$1,401
- − HOA
- −$2,016
- − Depreciation
- −$3,636
- Taxable loss
- −$443
- Est. tax savings @ 24.0%
- +$106
- After-tax cash flow
- $1,559/yr
For passive investors: Depreciation is non-cash, so a rental often shows a tax loss while cash-flowing — sheltering income. Rental losses are passive: they offset passive income freely, and up to $25,000/yr can offset ordinary (W-2) income if you actively participate and your MAGI is under $100k (phasing out to $0 by $150k); unused losses carry forward. On sale, claimed depreciation is recaptured at up to 25%, and gains may owe capital-gains tax (a 1031 exchange can defer both). Figures are a year-1 estimate at your 24.0% rate — not tax advice; consult a CPA.
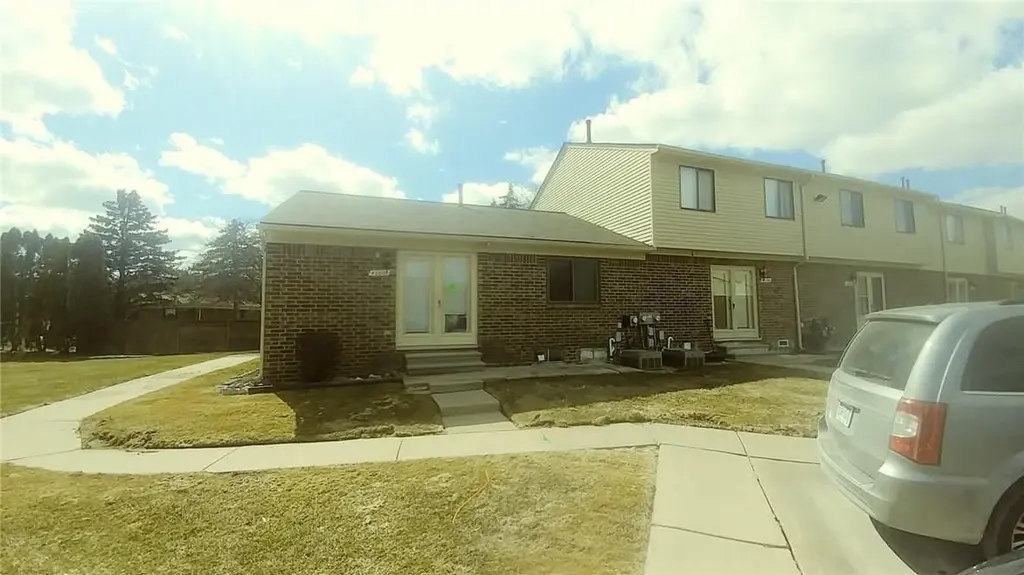
Condition & rehab AI · 1 photo
This end-unit condo requires extensive repairs and maintenance, including major work on the exterior siding and roof, as well as painting. Landscaping and curb appeal improvements would also significantly enhance its value.
Repairs flagged
- Major exterior siding — Significant wear and tear
- Major roof — No visible damage, but age is unknown
- Major landscaping — Overgrown lawn
Value-add opportunities
- Both landscaping and curb appeal — Improves curb appeal and resale value
- Both exterior siding and roof — Significant repairs needed to maintain value
- Both painting interior and exterior — Enhances appearance and value
Renovation cost estimate screening
| Repair item | Severity | Est. cost |
|---|---|---|
| exterior siding · Significant wear and tear | Major | $15,000–50,000 |
| roof · No visible damage, but age is unknown | Major | $15,000–50,000 |
| landscaping · Overgrown lawn | Major | $15,000–50,000 |
| Total estimated repair cost · 3 items | $45,000–150,000 |
Value-add ROI direction
- Both landscaping and curb appeal — Improves curb appeal and resale value ↑
- Both exterior siding and roof — Significant repairs needed to maintain value ↑
- Both painting interior and exterior — Enhances appearance and value ↑
ⓘ Cost ranges are severity-bucket heuristics (US national rule-of-thumb). Get contractor quotes + a written scope before underwriting a rehab budget.
Schools (NCES district)
- District
- Anchor Bay School District
- NCES district ID
- 2602790
- Math proficiency
- 44% ▼ -12.00%
- Reading proficiency
- 54% ▼ -7.00%
- Median HH income
- $70,173
- Composite
- 43.85/100
- National rank
- #2925
- State rank
- #91 of 540 in MI
Livability — New Baltimore
- Score
- 85/100
- State rank
- #30
- US rank
- #597
Category grades
Schools grade is shown separately in the Schools card above.
Census & demographics
- County
- Macomb County · 638,552 people
- Metro
- Detroit-Warren-Dearborn, MI
- Population (ZIP)
- 40,302
- Household income
- $94,890
- Rent vs Own
- Severe rent burden
- 529.0
Population outlook (Macomb County) Hauer SSP2
- Today (2025)
- 925,296 people
- By 2030
- 948,226 · +2.5%
- By 2040
- 983,961 · +6.3%
- By 2050
- 1,010,200 · +9.2%
- By 2075
- 1,076,222 · +16.3%
- By 2100
- 1,077,065 · +16.4%
Race, ethnicity, and origin ACS 2023
- Neighborhood character
- Predominantly White (85%)
- Race & ethnicity
- White 85% Two or more races 6% Black 5% Hispanic / Latino 4% Asian 2%
- Common ancestry
- Romanian 16% Lithuanian 6% Slovak 3%
- Foreign-born
- 3% · Canada
- Languages at home
- 96% English-only · Spanish 1% Other Indo-European 1% Russian/Polish/Slavic 1%
Political lean MEDSL · Macomb
- 2024 margin
- R (+13.7) · D 42.2% · R 55.9% · Other 1.9%
- 2008→2024 swing
- -22.3pp toward R · 2008: 8.6pp · 2024: -13.7pp
- All cycles
- 2024: R+13.7 2020: R+8.1 2016: R+11.6 2012: D+4.0 2008: D+8.6
Not yet ingested
- Civics
- —
Market trends
- HPI YoY
- ▼ -265.06%
- Current HPI
- 216.5914
- Rent YoY
- —
- Metro
- Detroit-Warren-Dearborn, MI
- State GDP YoY
- ▲ 1.37%
- F500 in state
- 28
Industry mix (Fortune 500 HQ in MI)
| Industry | F500 HQs | Revenue |
|---|---|---|
| Automotive Parts | 3 | $48B |
|
||
| Automotive | 2 | $372B |
|
||
| Chemicals | 1 | $45B |
|
||
| Automotive Retail | 1 | $29B |
|
||
| Healthcare / Medical Devices | 1 | $23B |
|
||
| Automotive Technology | 1 | $20B |
|
||
Price history
+65.8% since first listed24 events — show timeline
- 2026-05-29 Listed $119,000 REALCOMP
- 2026-05-29 Listed $119,000 MiRealSource-MiMLS
- 2026-05-16 Price Changed $1,295 REALSOURCE
- 2026-03-14 Listed for Rent $1,395 REALSOURCE
- 2026-03-14 Rental Removed $1,395 REALCOMP
- 2026-02-25 Listed for Rent $1,395 REALCOMP
- 2026-02-17 Rental Removed $1,395 REALCOMP
- 2025-12-06 Listed for Rent $1,395 REALCOMP
- 2025-12-06 Rental Removed $1,395 REALSOURCE
- 2025-12-06 Listed for Rent $1,395 REALSOURCE
- 2018-08-27 Sold (MLS) $65,000 MiRealSource-MiMLS
- 2018-08-27 Sold (MLS) $65,000 REALCOMP
- 2018-07-18 Pending — MiRealSource-MiMLS
- 2018-07-18 Pending — REALCOMP
- 2018-07-09 Relisted — MiRealSource-MiMLS
- 2018-07-09 Relisted — REALCOMP
- 2018-07-02 Pending — MiRealSource-MiMLS
- 2018-07-02 Pending — REALCOMP
- 2018-06-28 Relisted — MiRealSource-MiMLS
- 2018-06-28 Relisted — REALCOMP
- 2018-05-29 Pending — MiRealSource-MiMLS
- 2018-05-29 Pending — REALCOMP
- 2018-05-14 Listed $71,760 MiRealSource-MiMLS
- 2018-05-14 Listed $71,760 REALCOMP
Cash-flow waterfall
monthlySold comps — $/sqft
last 12 mo · ≤1 miLoading sold comps…