901 Ocean Ave #314 · Ocean City, NJ
Flood risk 7/10 · Major
- FEMA flood zone
- AE
- Chance of flooding over 30 yrs
- 0.73%
- Est. flood insurance / yr
- $1,737 – $8,500
Fire risk 1/10 · Minimal
- Est. fire insurance / yr
- $526 – $976
Heat risk 8/10 · Major
- Hot days now (above 98°F)
- 7 days/yr
- Hot days in 30 yrs
- 16 days/yr
Wind risk 8/10 · Major
- Chance of severe wind over 30 yrs
- 80.0%
Air-quality risk 2/10 · Minimal
- Unhealthy air days now
- 1 days/yr
- Unhealthy air days in 30 yrs
- 2 days/yr
Risk factors via First Street. Map © Google.
Why this score? — see what drove the B+ grade
The composite is a weighted blend of 9 inputs, each scored 0–100. Each bar is that input's sub-score; the figure is the points it added to the 100-point composite (weight × sub-score).
- Cash flow +30.0/30.0
- ARV discount +12.8/15.0
- 1% rule +10.0/10.0
- DSCR +10.0/10.0
- Livability +4.0/5.0
- Schools +3.7/10.0
- Rent growth +2.5/5.0
- Condition / age +2.5/5.0
- Appreciation +0.0/10.0
$339,900
🖨 Deal sheet 📄 Offer letter ✓ Due diligence
Listing remarks MLS
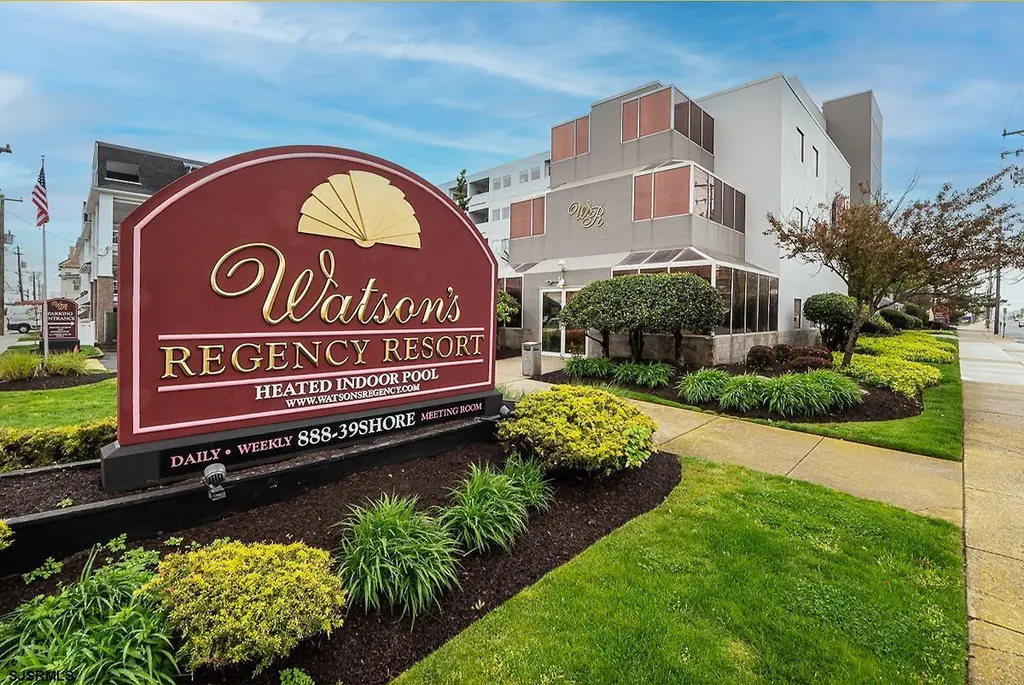
Prime Ocean City location just steps to the boardwalk and beach! This condo offers excellent rental history with strong demand due to its walk -able access to attractions, dining and shopping. A rare opportunity to own in one of Ocean City’s most desirable locations. Watson's Regency boasts the only indoor pool in Ocean City. This 3rd floor condo is complete with a balcony, living room with a queen sofa bed, full kitchen, dining area seating six, large bath and a separate bedroom with a queen bed. Upgrades include luxury vinyl plank flooring throughout living area, quartz kitchen counter-top and granite vanity top. Just steps from the beach and boardwalk. The front desk rents your suite on a nightly basis and offers daily housekeeping to your guests. Don't miss this one, make arrangements to see it now. Condo fees include cable TV, WiFi, basic phone service, water, sewer, flood insurance, hazard insurance & common area maintenance. Watson's boasts one of the island's best rental addresses, too. .. if high investment income is what you are after, look no farther. 2025 gross rental income exceeded 27K! Enjoy private covered parking. All owners must participate in the onsite Watson's Regency Rental program (no outside rentals permitted). Owner usage is limited to 30 nights per seasonal quarter. See breakdown below of seasonal quarters: Summer – June 21st to September 20th, Fall – September 21st – December 20th, Winter – December 21st – March 20th, Spring – March 21st - June 20th. Onsite Rental Management fee is 23% of the gross rental income plus $27.00 per occupied day for the maid service. Please see Agent Remarks. Seller Property Disclosure and monthly income statements in Associated Docs.
Key facts
- Granite vanity top
- Balcony
- Indoor pool
Tags
Neighborhood map
What this means for you Summary
Snapshot
- This is a 1-bed/1.0-bath condo listed at $340k.
Deal economics
- At list price, monthly cash flow is $2k ($26k/yr) — positive.
- The deal already cash-flows at list — no discount required.
- Meets the 1% rule at list price ($7k rent vs $340k).
- Recommended offer: $320k (6.0% below list) — sets the bar for market timing.
- Cap rate 15.4% vs local median 3.3% in Ocean City — top-decile yield for the area; either an underpriced asset or a hidden risk that comps aren't pricing in. Stress-test before assuming the spread holds.
Location & tenants
- Location reads 80/100 on livability (#72 in NJ, #1,762 nationally) — a professional / high-income tenant draw. Strengths: amenities A+, employment A+, health & safety A+; Watch: housing D+, cost of living F.
- Ocean City School District (urban): math 31% / reading 53% proficiency, ranked #212 of 472 in NJ (top 45%) — families likely to look elsewhere, expect single-tenant / working-renter base with shorter leases.
- Market conditions: 419 active listings in the ZIP; 2 comparable units currently listed for rent nearby; 877 units permitted in Cape May County in 2024 (35 in 5+ unit buildings).
Forward outlook
- Local home prices are declining (-3.0%/yr); year-one equity from $2k of loan paydown is wiped out by about $10k of value loss. Plan a longer hold.
- Cape May County population projected at -24% by 2050 — secular population decline; favor cash flow + early exit over multi-decade hold.
- At projected returns (-3.0% appreciation + 3.0% rent growth), your $95k cash investment doubles in ~5 years — after that, you're playing with house money.
Negotiation context
- It's been on market 72 days — a 6% lower offer ($320k) is reasonable based on typical stale-listing flexibility.
- 3 sale attempts since 24y ago with the ask held roughly flat each time — persistent listings suggest the price (not the market) is what's stuck; bring a comps-based counter.
- Current owner paid $220k; list at $340k implies a 55% gain — meaningful room to come down on a strong offer.
Risks & watch-outs
- Watch-outs: flood insurance adds $427/mo.
- Climate carrying-cost: in FEMA flood zone AE (mandatory federal flood insurance); severe wind risk, 80% chance of damaging wind over 30y; extreme-heat days projected 7→16/yr by 2055 (HVAC capex compounding) — expect insurance premiums to compound above CPI over the hold.
Questions for the listing agent
- It's been on market 72 days. Have you received any prior offers? Is the seller open to a 6% concession, seller financing, or rate buy-down credit?
- What's the actual annual flood-insurance premium (NFIP or private), and is the property in a SFHA with mandatory coverage?
- What does the HOA fee cover, when was the last increase, and are there any pending special assessments or reserve-fund shortfalls?
- Any open or pending special assessments — roof, HVAC, plumbing, elevator, façade? What's the per-unit balance and payoff schedule, and is the seller paying it off at close or rolling it to the buyer?
- Why hasn't it sold? Are there any deal-killer items the seller is aware of (foundation, flood, title, zoning, code violations)?
- Is there a deadline driving the sale (1031 exchange, divorce, estate, relocation)? That informs how much negotiation room exists.
- Schools are A-rated — typically a magnet for longer-tenancy family renters. What's the average tenant stay here, and is there a school-zone premium baked into asking?
- What's the average days-on-market for RENTAL listings here right now (not sales)? A rising rental-DOM trend means longer vacancies and softer asking-rent achievability than the comps imply.
- What's the recent tenant-quality profile in this submarket — average credit score on applications, eviction rate, late-payment / NSF rate, and stable-employment percentage? A property-management company in the area should have these aggregated.
- How much new apartment / multifamily construction is in the pipeline within 1–3 miles? Heavy new supply (>2% of stock underway) typically softens rents 12–24 months out; light construction supports rent growth.
Investment metrics
- 1% rule
- 1.96% ✓
- Cap rate
- 15.36%
- Cash-on-cash
- 32.37%
- DSCR
- 2.44
- GRM
- 4.3
CMA / ARV
- ARV (median comp)
- $385,070
- List price
- $339,900
- Delta
- -11.73%
- Verdict
- UNDERPRICED
- Comps
- 20 within 1.0 mi
Projected returns pro-forma
-3.0% appreciation · 3.0% rent growth · sell at horizon
- IRR
- 21.0%
- Equity multiple
- 1.86×
- Total profit
- $81,818
- Equity at exit
- $50,680
- IRR
- 29.2%
- Equity multiple
- 3.62×
- Total profit
- $249,115
- Equity at exit
- $29,388
Cash invested: $95,172 (down + closing). Projections, not guarantees.
Landlord ↔ Tenant lean methodology
- Overall (STATE)
- 21 Tenant-Leaning
- State New Jersey
- 21 Tenant-Leaning · D+6
- County
- — inherits STATE
- City
- — inherits STATE
ZIP-level market 08226
- Active inventory
- 419
- Price-to-rent
- 4.3×
Monthly cashflow live
- Estimated rent
- $6,658 medium interval (Pro) →
- Mortgage (P&I)
- −$1,782
- Tax from tax record
- −$269 /mo · $3,224/yr
- Insurance
- −$142
- Flood insurance flood zone
- −$427 /mo · $5,118/yr
- HOA
- −$500
- Vacancy / Maint / Mgmt
- −$1,398
- Net cashflow
- $2,140
Break-even live
UW: 25.0% down · 7.5% · 30yr · 1.5% tax · 5.0% vac · 8.0% maint · 8.0% mgmt
Financing live
Cash to close
- Down payment
- $84,975
- Closing costs
- $10,197
- Reserves months
- —
- Total cash needed
- —
Loan-product check · same deal, 3 products live
Conventional
25% down · 7.5% · 30yr
- Down + closing
- —
- Monthly P&I
- —
- Monthly cashflow
- —
- DSCR
- —
- Eligible?
- —
Personal DTI + credit; lowest rate.
DSCR
20% down · 8.5% · 30yr
- Down + closing
- —
- Monthly P&I
- —
- Monthly cashflow
- —
- DSCR
- —
- Eligible?
- —
No personal income docs; deal must DSCR.
Hard money
10% down · 12.0% · 12mo
- Down + closing
- —
- Monthly P&I
- —
- Monthly cashflow
- —
- DSCR
- —
- Eligible?
- —
Short-term bridge; refi at stabilization.
Rent comps 2 comps
| Address | Beds | Baths | Sqft | Rent | $/sqft | DOM | Units | Dist |
|---|---|---|---|---|---|---|---|---|
| 714 West Ave Unit 1308989P Ocean City, NJ | 2.0 | 1.0 | 742 | $6,384 | $8.60 | 43d | 1 | 0.38mi |
| 200 Bay Ave Unit 200 Ocean City, NJ | 1.0 | 1.0 | 425 | $7,800 | $18.35 | 20d | 1 | 0.98mi |
HOA detail condo
- Monthly dues
- $500 · $6,000/yr
- Likely covers
- watersewerinternetcableinsurancepool
- Assessments
- None detected in remarks — confirm with the listing agent.
Listing history 22 events
-
2026-06-18days on market $339,900 Active 72 DOM
-
2026-06-17days on market $339,900 Active 71 DOM
-
2026-06-16days on market $339,900 Active 70 DOM
-
2026-06-15days on market $339,900 Active 69 DOM
-
2026-06-13days on market $339,900 Active 67 DOM
-
2026-06-12days on market $339,900 Active 66 DOM
-
2026-06-09days on market $339,900 Active 63 DOM
-
2026-06-08days on market $339,900 Active 62 DOM
-
2026-06-07days on market $339,900 Active 61 DOM
-
2026-06-07days on market $339,900 Active 60 DOM
-
2026-06-04days on market $339,900 Active 57 DOM
-
2026-06-02days on market $339,900 Active 56 DOM
-
2026-06-01days on market $339,900 Active 55 DOM
-
2026-05-31days on market $339,900 Active 54 DOM
-
2026-04-07$339,900 Active 1766-char remark
Show marketing remark (1766 chars)
Prime Ocean City location just steps to the boardwalk and beach! This condo offers excellent rental history with strong demand due to its walk -able access to attractions, dining and shopping. A rare opportunity to own in one of Ocean City’s most desirable locations. Watson's Regency boasts the only indoor pool in Ocean City. This 3rd floor condo is complete with a balcony, living room with a queen sofa bed, full kitchen, dining area seating six, large bath and a separate bedroom with a queen bed. Upgrades include luxury vinyl plank flooring throughout living area, quartz kitchen counter-top and granite vanity top. Just steps from the beach and boardwalk. The front desk rents your suite on a nightly basis and offers daily housekeeping to your guests. Don't miss this one, make arrangements to see it now. Condo fees include cable TV, WiFi, basic phone service, water, sewer, flood insurance, hazard insurance & common area maintenance. Watson's boasts one of the island's best rental addresses, too. .. if high investment income is what you are after, look no farther. 2025 gross rental income exceeded 27K! Enjoy private covered parking. All owners must participate in the onsite Watson's Regency Rental program (no outside rentals permitted). Owner usage is limited to 30 nights per seasonal quarter. See breakdown below of seasonal quarters: Summer – June 21st to September 20th, Fall – September 21st – December 20th, Winter – December 21st – March 20th, Spring – March 21st - June 20th. Onsite Rental Management fee is 23% of the gross rental income plus $27.00 per occupied day for the maid service. Please see Agent Remarks. Seller Property Disclosure and monthly income statements in Associated Docs.
-
2013-10-02historical 492-char remark
Show marketing remark (492 chars)
Watson's Regency offers the only indoor pool and hot tub in Ocean City. This third floor unit overlooks the indoor pool. You are able to enjoy your private balcony year round. A full suite, it features a full kitchen, a dining area that seats six, a living room with a queen and twin sofa bed and bedroom with a queen bed. An investment that makes sense with an onsite rental program operating as a hotel with daily maid and linen service. You owe it to yourself to put this one on your list.
-
2013-03-15$309,900 492-char remark
Show marketing remark (492 chars)
Watson's Regency offers the only indoor pool and hot tub in Ocean City. This third floor unit overlooks the indoor pool. You are able to enjoy your private balcony year round. A full suite, it features a full kitchen, a dining area that seats six, a living room with a queen and twin sofa bed and bedroom with a queen bed. An investment that makes sense with an onsite rental program operating as a hotel with daily maid and linen service. You owe it to yourself to put this one on your list.
-
2003-03-17soldstatus $220,000
-
2003-03-14soldstatus $220,000
-
2002-12-23historical
-
2002-08-18$224,900
-
1990-11-07soldstatus $160,000
ⓘ Source: listings_history table (triggers on properties + properties_extension) + one-shot
backfill from property_details.listing_events for pre-trigger history.
Tax reassessment forecast NJ · Partial reset (capped growth)
- Current annual tax
- $3,224 · $269/mo
- Projected year-2 tax
- $5,844 · $487/mo
- Expected delta
- +$2,620/yr (+$218/mo · 81.3%)
ⓘ Screening estimate from a state-policy table — verify with the county assessor before closing.
Climate risk First Street
- Flood 7/10 Severe FEMA zone AE · 73% chance over 30 yrs
- Wildfire 1/10 Low
- Heat 8/10 Severe 7 d/yr ≥98°F today · 16 d/yr by 30 yrs out
- Wind 8/10 Severe 80% chance of damaging wind over 30 yrs
- Air quality 2/10 Low 1 unhealthy d/yr today · 2 by 30 yrs out
Nearby sold comps map
Loading sold comps map…
Walkable amenities ~0.75 mi
Loading nearby amenities…
Taxation est. · year 1
- Rental income
- $79,894
- − Mortgage interest
- −$19,040
- − Property taxes
- −$3,224
- − Insurance
- −$6,818
- − Repairs & maintenance
- −$6,391
- − Management
- −$6,391
- − HOA
- −$6,000
- − Depreciation
- −$9,888
- Taxable income
- $22,141
- Est. tax owed @ 24.0%
- −$5,314
- After-tax cash flow
- $20,371/yr
For passive investors: Depreciation is non-cash, so a rental often shows a tax loss while cash-flowing — sheltering income. Rental losses are passive: they offset passive income freely, and up to $25,000/yr can offset ordinary (W-2) income if you actively participate and your MAGI is under $100k (phasing out to $0 by $150k); unused losses carry forward. On sale, claimed depreciation is recaptured at up to 25%, and gains may owe capital-gains tax (a 1031 exchange can defer both). Figures are a year-1 estimate at your 24.0% rate — not tax advice; consult a CPA.
Schools (NCES district)
- District
- Ocean City School District
- NCES district ID
- 3411970
- Math proficiency
- 31% ▼ -12.00%
- Reading proficiency
- 53% ▼ -9.00%
- Median HH income
- $60,444
- Composite
- 37.07/100
- National rank
- #4506
- State rank
- #212 of 472 in NJ
Livability — Ocean City
- Score
- 80/100
- State rank
- #72
- US rank
- #1762
Category grades
Schools grade is shown separately in the Schools card above.
Census & demographics
- Census place
- Ocean City, NJ
- City population
- 11,260
- Population (ZIP)
- 11,260
Population outlook (Cape May County) Hauer SSP2
- Today (2025)
- 88,234 people
- By 2030
- 84,144 · -4.6%
- By 2040
- 75,146 · -14.8%
- By 2050
- 67,389 · -23.6%
- By 2075
- 55,732 · -36.8%
- By 2100
- 44,972 · -49.0%
Race, ethnicity, and origin ACS 2023
- Neighborhood character
- Predominantly White (86%)
- Race & ethnicity
- White 86% Hispanic / Latino 9% Black 2% Two or more races 2%
- Hispanic origin (detail)
- Mexican 7% Puerto Rican 1%
- Common ancestry
- Romanian 6% Slovak 2% Scotch-Irish 1%
- Foreign-born
- 7% · Canada
- Languages at home
- 89% English-only · Spanish 8% Russian/Polish/Slavic 2% Other Indo-European 2%
Political lean MEDSL · Cape May
- 2024 margin
- R (+19.2) · D 39.7% · R 58.9% · Other 1.4%
- 2008→2024 swing
- -10.6pp toward R · 2008: -8.7pp · 2024: -19.2pp
- All cycles
- 2024: R+19.2 2020: R+15.9 2016: R+19.9 2012: R+8.9 2008: R+8.7
Not yet ingested
- Civics
- —
Market trends
- HPI YoY
- ▼ -381.90%
- Current HPI
- 389.3687
- Rent YoY
- —
- Metro
- —
- State GDP YoY
- ▲ 2.05%
- F500 in state
- 34
Industry mix (Fortune 500 HQ in NJ)
| Industry | F500 HQs | Revenue |
|---|---|---|
| Consumer Goods | 3 | $31B |
|
||
| Pharmaceuticals | 2 | $153B |
|
||
| Technology | 2 | $21B |
|
||
| Insurance | 2 | $20B |
|
||
| Healthcare | 2 | $19B |
|
||
| Financial Services | 1 | $70B |
|
||
Price history
+112.4% since first listed8 events — show timeline
- 2026-04-07 Listed $339,900 SJSRMLS
- 2013-10-02 Listing Removed — SJSRMLS
- 2013-03-15 Listed $309,900 SJSRMLS
- 2003-03-17 Sold (Public Records) $220,000 Public Records
- 2003-03-14 Sold (MLS) $220,000 SJSRMLS
- 2002-12-23 Listing Removed — SJSRMLS
- 2002-08-18 Listed $224,900 SJSRMLS
- 1990-11-07 Sold (Public Records) $160,000 Public Records
Property tax history
+2.5%/yrLatest (2025): $3,224 · +3.4% YoY. Source: county tax records.
Cash-flow waterfall
monthlySold comps — $/sqft
last 12 mo · ≤1 miLoading sold comps…