 Duplex
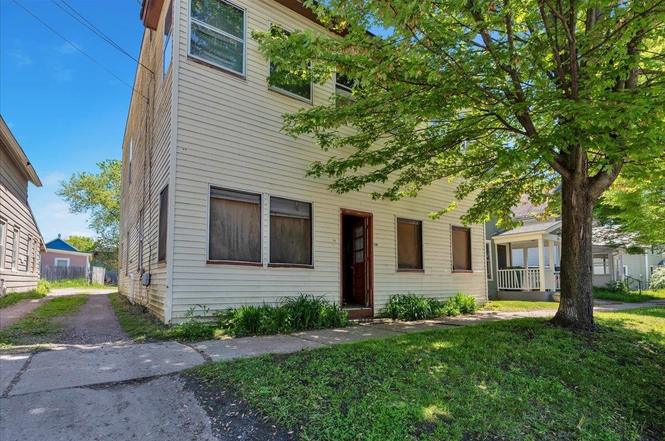
174-176 N Champlain St · Burlington, VT
Flood risk 1/10 · Minimal
- FEMA flood zone
- X (unshaded)
- Chance of flooding over 30 yrs
- 0.0%
- Est. flood insurance / yr
- $473 – $860
Fire risk 1/10 · Minimal
- Est. fire insurance / yr
- $480 – $892
Heat risk 3/10 · Minor
- Hot days now (above 93°F)
- 7 days/yr
- Hot days in 30 yrs
- 15 days/yr
Wind risk 2/10 · Minimal
- Chance of severe wind over 30 yrs
- 1.0%
Air-quality risk 2/10 · Minimal
- Unhealthy air days now
- 1 days/yr
- Unhealthy air days in 30 yrs
- 1 days/yr
Risk factors via First Street. Map © Google.
Why this score? — see what drove the B+ grade
The composite is a weighted blend of 9 inputs, each scored 0–100. Each bar is that input's sub-score; the figure is the points it added to the 100-point composite (weight × sub-score).
- Cash flow +30.0/30.0
- ARV discount +15.0/15.0
- 1% rule +10.0/10.0
- DSCR +10.0/10.0
- Schools +5.0/10.0
- Livability +3.7/5.0
- Rent growth +2.6/5.0
- Condition / age +2.5/5.0
- Appreciation +0.0/10.0
$300,000
🖨 Deal sheet (PDF) 📄 Offer letter ✓ Due diligence
Multi-family units
County records classify this as Multi-Family (2-4 Unit). Listing-text estimate: 2 units. confirmed
Listing remarks
Investor opportunity awaits in Burlington’s Old North End! This duplex features two 2-bedroom, 1-bath units with separate utilities. With some TLC, it has great potential for owner-occupancy or rental income. A shared driveway leads to a quaint backyard, perfect for entertaining or relaxing. Conveniently located minutes from UVM Medical Center, downtown Burlington, and close to public transportation. Don’t miss this chance to invest in your own piece of Burlington. Low rents due to long term tenants, property being sold as-is.
Key facts
- Rental income
- Shared driveway
- Quaint backyard
Tags
Property features AI
Finance
- Other: Total finished area approximately 2,028; Total area approximately 3,045; Two units, each approximately 1,014 (each unit has 5 rooms); Directions: From Pearl St, right on North Champlain Street, property on right
- Financial info: Operating expenses include insurance, sewer, trash, and water; Month-to-month leases for units
Exterior
- Parking: Crushed stone driveway
- Utilities: Public sewer; Public water; Electric service with circuit breakers; Natural gas service (VT Gas); Cable internet available
- Home design: Multi-family building (two-unit property); Each unit is a flat; Existing construction; Tan exterior color
- Construction: Built in 1899; Wood frame construction with vinyl siding; Flat, metal, and other roof types; Unknown survey status
- Exterior features: City lot with sidewalks and street lights; Crushed stone driveway; Paved road frontage
Interior
- Kitchen: Water heater (natural gas)
- Bedrooms: Two 2-bedroom units
- Flooring: Carpet; Laminate
- Bathrooms: Two full bathrooms total (one in each unit)
- Heating & cooling: Natural gas heating; No central air (no cooling)
- Interior features: Unfinished basement with interior stairs and bulkhead access; Basement has dirt floor
- Laundry & utility: Natural gas heating; Gas heater with monitor type
Neighborhood map
What this means for you Summary
Snapshot
- This is a 2 × 2-bed/1.0-bath units multifamily listed at $300k.
Deal economics
- At list price, monthly cash flow is $2k ($27k/yr) — positive. Per door: $1k/mo.
- The deal already cash-flows at list — no discount required.
- Meets the 1% rule at list price ($6k rent vs $300k).
- Recommended offer: $282k (6.0% below list) — sets the bar for market timing.
- Cap rate 15.4% vs local median 3.1% in Burlington — top-decile yield for the area; either an underpriced asset or a hidden risk that comps aren't pricing in. Stress-test before assuming the spread holds.
Location & tenants
- Location reads 74/100 on livability (#19 in VT, #4,619 nationally) — a middle-class / working-renter tenant base. Strengths: commute A+, health & safety A+, schools B; Watch: cost of living D, crime F, amenities F.
- Market conditions: Rents flat; 138 active listings in the ZIP; 2 comparable units currently listed for rent nearby; 898 units permitted in Chittenden County in 2024 (554 in 5+ unit buildings).
- At $5,503/mo this rent would consume 101% of the median local household income ($66k/yr) (locally 2757% of renters already pay >50% of income on rent) — very limited rent-growth headroom before tenants either downsize or default.
Forward outlook
- Local home prices are declining (-3.0%/yr); year-one equity from $2k of loan paydown is wiped out by about $9k of value loss. Plan a longer hold.
- Chittenden County population projected at +8% by 2050 — modest demand growth; plan on rents tracking national, not racing it.
- At projected returns (-3.0% appreciation + 0.5% rent growth), your $84k cash investment doubles in ~4 years — after that, you're playing with house money.
Negotiation context
- It's been on market 72 days — a 6% lower offer ($282k) is reasonable based on typical stale-listing flexibility.
Risks & watch-outs
- Watch-outs: built in 1899 — expect roof / HVAC / electrical / plumbing capex.
Questions for the listing agent
- It's been on market 72 days. Have you received any prior offers? Is the seller open to a 6% concession, seller financing, or rate buy-down credit?
- Can we see the unit-by-unit rent roll, current vacancy, and any below-market leases? What's the average tenancy length?
- What capital expenditures (roof, boiler, parking lot, exteriors) have been made in the last 5 years, and what's planned in the next 2?
- Built in 1899 — when were the roof, HVAC, electrical panel, plumbing, and water heater last replaced?
- Why hasn't it sold? Are there any deal-killer items the seller is aware of (foundation, flood, title, zoning, code violations)?
- Is there a deadline driving the sale (1031 exchange, divorce, estate, relocation)? That informs how much negotiation room exists.
- Schools are B-rated — typically a magnet for longer-tenancy family renters. What's the average tenant stay here, and is there a school-zone premium baked into asking?
- Crime grade is F in this area — have there been break-ins, vandalism, or insurance claims at this property in the last 3 years? What carrier currently insures it and at what premium?
- What's the average days-on-market for RENTAL listings here right now (not sales)? A rising rental-DOM trend means longer vacancies and softer asking-rent achievability than the comps imply.
- What's the recent tenant-quality profile in this submarket — average credit score on applications, eviction rate, late-payment / NSF rate, and stable-employment percentage? A property-management company in the area should have these aggregated.
- How much new apartment / multifamily construction is in the pipeline within 1–3 miles? Heavy new supply (>2% of stock underway) typically softens rents 12–24 months out; light construction supports rent growth.
Investment metrics
- 1% rule
- 1.83% ✓
- Cap rate
- 15.39%
- Cash-on-cash
- 32.49%
- DSCR
- 2.45
- GRM
- 4.5
CMA / ARV
- ARV (on-the-fly)
- $569,868
- Comps found
- 12
Show comp detail 12 sales within ~0.75 mi
| Address | Dist | Beds/Ba | Sqft | Sold | Price | $/sf | Match |
|---|---|---|---|---|---|---|---|
| 174-176 N Champlain St | 0.00mi | 4/2.0 | 2,028 (0%) | 0mo | $306,915 | $151 | 100 |
| 244 North St | 0.26mi | 4/1.0 | 2,060 (+2%) | 12mo | $490,000 | $238 | 71 |
| 215 Elmwood Ave | 0.17mi | 5/2.0 (+1) | 2,186 (+8%) | 5mo | $615,000 | $281 | 70 |
| 89 Pitkin St | 0.19mi | 5/2.0 (+1) | 2,100 (+4%) | 13mo | $695,000 | $331 | 69 |
| 11 Grant St | 0.32mi | 5/2.0 (+1) | 1,980 (-2%) | 13mo | $610,000 | $308 | 66 |
| 38 Sherman St | 0.25mi | 5/5.0 (+1) | 2,102 (+4%) | 5mo | $710,000 | $338 | 61 |
| 75 Archibald St | 0.36mi | 5/1.0 (+1) | 1,884 (-7%) | 9mo | $461,000 | $245 | 54 |
| 174-176 Intervale Ave | 0.45mi | 5/2.0 (+1) | 1,904 (-6%) | 11mo | $520,000 | $273 | 54 |
| 240 N Willard St | 0.59mi | 4/2.0 | 1,856 (-8%) | 6mo | $425,000 | $229 | 53 |
| 65-67 N Willard St | 0.59mi | 5/2.0 (+1) | 1,964 (-3%) | 11mo | $730,000 | $372 | 53 |
| 246 N Winooski Ave | 0.42mi | 4/3.0 | 1,900 (-6%) | 18mo | $410,000 | $216 | 51 |
| 442 North St | 0.68mi | 5/4.0 (+1) | 2,047 (+1%) | 17mo | $735,000 | $359 | 40 |
Match score weights: distance 35% · size 25% · config 20% · recency 20%. Top-matched comps best support the ARV.
Projected returns pro-forma
-3.0% appreciation · 0.52% rent growth · sell at horizon
- IRR
- 24.7%
- Equity multiple
- 1.99×
- Total profit
- $82,911
- Equity at exit
- $44,731
- IRR
- 30.9%
- Equity multiple
- 3.46×
- Total profit
- $206,719
- Equity at exit
- $25,939
Cash invested: $84,000 (down + closing). Projections, not guarantees.
Landlord ↔ Tenant lean methodology
- Overall (STATE)
- 41 Moderately Tenant-Leaning
- State Vermont
- 41 Moderately Tenant-Leaning · D+15
- County
- — inherits STATE
- City
- — inherits STATE
ZIP-level market 05401
- Rents YoY
- 0.5%
- Active inventory
- 138
- Price-to-rent
- 9.1×
Monthly cashflow live
- Estimated rent
- $5,503 high interval (Pro) →
- Mortgage (P&I)
- −$1,573
- Tax est. 1.5%
- −$375 /mo · $4,500/yr
- Insurance
- −$125
- HOA
- −$0
- Vacancy / Maint / Mgmt
- −$1,156
- Net cashflow
- $2,274
Break-even live
Sensitivity live
| Price | -10% $2,481 | -5% $2,378 | +0% $2,274 | +5% $2,170 | +10% $2,067 |
|---|---|---|---|---|---|
| Rent | -10% $1,839 | -5% $2,057 | +0% $2,274 | +5% $2,492 | +10% $2,709 |
| Rate | -1.0pp $2,425 | -0.5pp $2,350 | base $2,274 | +0.5pp $2,196 | +1.0pp $2,117 |
2-unit breakdown (identical units grouped — click to expand)
| Units | Beds | Baths | Est. rent |
|---|---|---|---|
| 2× units | 2 | 1 | $5,504 |
| #1 | 2 | 1 | $2,752 |
| #2 | 2 | 1 | $2,752 |
| Total (2 units) | $5,503 | ||
UW: 25.0% down · 7.5% · 30yr · 1.5% tax · 5.0% vac · 8.0% maint · 8.0% mgmt
Financing live
Cash to close
- Down payment
- $75,000
- Closing costs
- $9,000
- Reserves months
- —
- Total cash needed
- —
Loan-product check · same deal, 3 products live
Conventional
25% down · 7.5% · 30yr
- Down + closing
- —
- Monthly P&I
- —
- Monthly cashflow
- —
- DSCR
- —
- Eligible?
- —
Personal DTI + credit; lowest rate.
DSCR
20% down · 8.5% · 30yr
- Down + closing
- —
- Monthly P&I
- —
- Monthly cashflow
- —
- DSCR
- —
- Eligible?
- —
No personal income docs; deal must DSCR.
Hard money
10% down · 12.0% · 12mo
- Down + closing
- —
- Monthly P&I
- —
- Monthly cashflow
- —
- DSCR
- —
- Eligible?
- —
Short-term bridge; refi at stabilization.
Rent comps 2 comps
| Address | Beds | Baths | Sqft | Rent | $/sqft | DOM | Units | Dist |
|---|---|---|---|---|---|---|---|---|
| 37 Hyde St Unit 7 Burlington, VT | 4.0 | 2.0 | 1600 | $4,000 | $2.50 | 44d | 1 | 0.44mi |
| 66 Hungerford Ter Burlington, VT | 4.0 | 1.0 | 1500 | $3,450 | $2.30 | 22d | 1 | 0.67mi |
Listing history 7 events
-
2026-05-29status Pending
-
2026-05-21historical
-
2026-03-26historical Active with Contract
-
2026-03-10$300,000 Active
-
2025-10-30price $349,900
-
2025-09-08price $375,000
-
2025-07-02price $395,000
ⓘ Source: listings_history table (triggers on properties + properties_extension) + one-shot
backfill from property_details.listing_events for pre-trigger history.
Climate risk First Street
- Flood 1/10 Low FEMA zone X (unshaded) · 0% chance over 30 yrs
- Wildfire 1/10 Low
- Heat 3/10 Moderate 7 d/yr ≥93°F today · 15 d/yr by 30 yrs out
- Wind 2/10 Low 100% chance of damaging wind over 30 yrs
- Air quality 2/10 Low 1 unhealthy d/yr today · 1 by 30 yrs out
Nearby sold comps map
Loading sold comps map…
Walkable amenities ~0.75 mi
Loading nearby amenities…
Taxation est. · year 1
- Rental income
- $66,036
- − Mortgage interest
- −$16,805
- − Property taxes
- −$4,500
- − Insurance
- −$1,500
- − Repairs & maintenance
- −$5,283
- − Management
- −$5,283
- − Depreciation
- −$8,727
- Taxable income
- $23,938
- Est. tax owed @ 24.0%
- −$5,745
- After-tax cash flow
- $21,544/yr
For passive investors: Depreciation is non-cash, so a rental often shows a tax loss while cash-flowing — sheltering income. Rental losses are passive: they offset passive income freely, and up to $25,000/yr can offset ordinary (W-2) income if you actively participate and your MAGI is under $100k (phasing out to $0 by $150k); unused losses carry forward. On sale, claimed depreciation is recaptured at up to 25%, and gains may owe capital-gains tax (a 1031 exchange can defer both). Figures are a year-1 estimate at your 24.0% rate — not tax advice; consult a CPA.
Schools (NCES district)
No district data.
Livability — Burlington
- Score
- 74/100
- State rank
- #19
- US rank
- #4619
Category grades
Schools grade is shown separately in the Schools card above.
Census & demographics
- Census place
- Burlington, VT
- County
- Chittenden County · 110,603 people
- City population
- 31,662
- Metro
- Burlington-South Burlington, VT
- Population (ZIP)
- 31,662
- Household income
- $65,657
- Rent vs Own
- Severe rent burden
- 2757.0
Population outlook (Chittenden County) Hauer SSP2
- Today (2025)
- 170,769 people
- By 2030
- 174,716 · +2.3%
- By 2040
- 180,337 · +5.6%
- By 2050
- 183,768 · +7.6%
- By 2075
- 194,646 · +14.0%
- By 2100
- 194,933 · +14.2%
Race, ethnicity, and origin ACS 2023
- Neighborhood character
- Predominantly White (84%)
- Race & ethnicity
- White 84% Two or more races 6% Asian 4% Black 4% Hispanic / Latino 4%
- Common ancestry
- Romanian 5% Lithuanian 5% Slovak 4%
- Foreign-born
- 7% · China, Canada, Vietnam
- Languages at home
- 90% English-only · Other Indo-European 2% French/Haitian/Cajun 2% Spanish 2%
Political lean MEDSL · Chittenden
- 2024 margin
- Solid D (+53.6) · D 75.4% · R 21.7% · Other 2.9%
- 2008→2024 swing
- +8.9pp toward D · 2008: 44.8pp · 2024: 53.6pp
- All cycles
- 2024: D+53.6 2020: D+54.5 2016: D+46.8 2012: D+41.9 2008: D+44.8
Not yet ingested
- Civics
- —
Market trends
- HPI YoY
- ▼ -316.87%
- Current HPI
- 352.2081
- Rent YoY
- ▲ 0.52%
- Metro
- Burlington-South Burlington, VT
- State GDP YoY
- —
- F500 in state
- 0
Price history
-24.1% since first listed7 events — show timeline
- 2026-05-29 Pending — PrimeMLS
- 2026-05-21 Delisted — PrimeMLS
- 2026-03-26 Contingent — PrimeMLS
- 2026-03-10 Listed $300,000 PrimeMLS
- 2025-10-30 Price Changed $349,900 PrimeMLS
- 2025-09-08 Price Changed $375,000 PrimeMLS
- 2025-07-02 Price Changed $395,000 PrimeMLS
Cash-flow waterfall
monthlySold comps — $/sqft
last 12 mo · ≤1 miLoading sold comps…