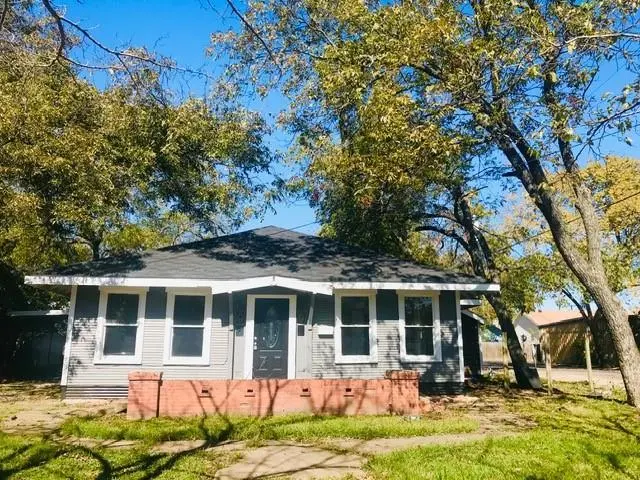
106 W Decatur St · Ennis, TX
Flood risk 1/10 · Minimal
- FEMA flood zone
- X (unshaded)
- Chance of flooding over 30 yrs
- 0.0%
- Est. flood insurance / yr
- $507 – $1,088
Fire risk 4/10 · Minor
- Est. fire insurance / yr
- $1,222 – $2,270
Heat risk 7/10 · Major
- Hot days now (above 109°F)
- 6 days/yr
- Hot days in 30 yrs
- 21 days/yr
Wind risk 6/10 · Moderate
- Chance of severe wind over 30 yrs
- 27.0%
Air-quality risk 2/10 · Minimal
- Unhealthy air days now
- 0 days/yr
- Unhealthy air days in 30 yrs
- 1 days/yr
Risk factors via First Street. Map © Google.
Why this score? — see what drove the C+ grade
The composite is a weighted blend of 9 inputs, each scored 0–100. Each bar is that input's sub-score; the figure is the points it added to the 100-point composite (weight × sub-score).
- Cash flow +20.0/30.0
- ARV discount +15.0/15.0
- 1% rule +7.1/10.0
- DSCR +6.3/10.0
- Livability +3.6/5.0
- Schools +3.4/10.0
- Rent growth +3.2/5.0
- Condition / age +2.5/5.0
- Appreciation +0.0/10.0
$189,500
🖨 Deal sheet 📄 Offer letter ✓ Due diligence
Listing remarks MLS
Great opportunity on Historical Home right in Downtown Ennis! Plenty of space, offering 4 bedrooms and 2 baths, interior has been painted and added new carpet thru out, master bath has been updated as well, Central AC and heat work great, roof was put on around 2020, home is leased making it a great investment property or make it your dream own home with just some TLC! Tenants can stay or move out with no problem, home is priced way under Value so make your best offer now before it’s gone!
Key facts
- 8,581 sq ft lot
- Built 1925
- Listed 57 days
Neighborhood map
What this means for you Summary
Snapshot
- This is a 4-bed/1.0-bath single-family listed at $190k.
Deal economics
- At list price, monthly cash flow is $232 ($3k/yr) — positive.
- The deal already cash-flows at list — no discount required.
- Meets the 1% rule at list price ($2k rent vs $190k).
- Recommended offer: $184k (3.0% below list) — sets the bar for market timing.
- Cap rate 7.8% vs local median 4.5% in Ennis — top-decile yield for the area; either an underpriced asset or a hidden risk that comps aren't pricing in. Stress-test before assuming the spread holds.
Location & tenants
- Location reads 71/100 on livability (#304 in TX) — a middle-class / working-renter tenant base. Strengths: cost of living A+, housing A+, crime B+; Watch: schools D-, amenities F, commute F.
- Ennis ISD (rural): math 41% / reading 39% proficiency, ranked #411 of 826 in TX (top 50%) — families likely to look elsewhere, expect single-tenant / working-renter base with shorter leases; 60% free/reduced lunch — lower-income household profile, screen leases tightly.
- Market conditions: Rents rising (+3.0%/yr); 363 active listings in the ZIP; 11 comparable units currently listed for rent nearby; rentals at typical pace (median 22d on market — plan ~3-4 weeks tenant-placement turnaround); solid renter incomes; 3,016 units permitted in Ellis County in 2024 (20 in 5+ unit buildings).
- This rent runs 36% of the median local income ($77k/yr) — at the standard rent-burdened threshold; future hikes will face affordability resistance.
Forward outlook
- Local home prices are declining (-3.0%/yr); year-one equity from $1k of loan paydown is wiped out by about $6k of value loss. Plan a longer hold.
- Ellis County population projected at +36% by 2050 — long-run rental-demand tailwind backs the buy-and-hold thesis.
Negotiation context
- It's been on market 57 days — a 3% lower offer ($184k) is reasonable based on typical stale-listing flexibility.
- 2 sale attempts since 13y ago with the ask held roughly flat each time — persistent listings suggest the price (not the market) is what's stuck; bring a comps-based counter.
Risks & watch-outs
- Watch-outs: property tax is 3.2% of price; built in 1925 — expect roof / HVAC / electrical / plumbing capex.
- Climate carrying-cost: major wind risk, 27% chance of damaging wind over 30y; extreme-heat days projected 6→21/yr by 2055 (HVAC capex compounding) — expect insurance premiums to compound above CPI over the hold.
Questions for the listing agent
- It's been on market 57 days. Have you received any prior offers? Is the seller open to a 3% concession, seller financing, or rate buy-down credit?
- Built in 1925 — when were the roof, HVAC, electrical panel, plumbing, and water heater last replaced?
- Property tax is high relative to price — has the assessment been appealed recently, and will the sale trigger a re-assessment?
- Is there a deadline driving the sale (1031 exchange, divorce, estate, relocation)? That informs how much negotiation room exists.
- Schools are D-rated, which usually means shorter tenancies and higher turnover. Who's the typical renter profile here, and what's been the actual vacancy rate?
- What's the average days-on-market for RENTAL listings here right now (not sales)? A rising rental-DOM trend means longer vacancies and softer asking-rent achievability than the comps imply.
- What's the recent tenant-quality profile in this submarket — average credit score on applications, eviction rate, late-payment / NSF rate, and stable-employment percentage? A property-management company in the area should have these aggregated.
- How much new for-sale + rental construction is in the pipeline within 1–3 miles? Heavy new supply typically softens prices + rents 12–24 months out; constrained supply supports both.
Investment metrics
- 1% rule
- 1.21% ✓
- Cap rate
- 7.76%
- Cash-on-cash
- 5.24%
- DSCR
- 1.23
- GRM
- 6.9
CMA / ARV
- ARV (median comp)
- $254,405
- List price
- $189,500
- Delta
- -25.51%
- Verdict
- UNDERPRICED
- Comps
- 20 within 1.0 mi
Show comp detail 12 sales within ~0.75 mi
| Address | Dist | Beds/Ba | Sqft | Sold | Price | $/sf | Match |
|---|---|---|---|---|---|---|---|
| 801 N Mckinney St | 0.21mi | 3/1.0 (-1) | 1,752 (-6%) | 2mo | $180,000 | $103 | 73 |
| 1307 N Breckenridge St | 0.57mi | 3/2.0 (-1) | 1,838 (-2%) | 2mo | $315,000 | $171 | 60 |
| 304 W Gilmer St | 0.33mi | 3/2.0 (-1) | 1,806 (-3%) | 15mo | $248,000 | $137 | 58 |
| 603 N Mckinney St | 0.13mi | 3/2.0 (-1) | 1,593 (-15%) | 5mo | $178,200 | $112 | 56 |
| 610 N Shawnee St | 0.32mi | 3/1.0 (-1) | 1,754 (-6%) | 17mo | $160,000 | $91 | 56 |
| 1311 Daffan Ave | 0.65mi | 3/2.0 (-1) | 1,952 (+4%) | 7mo | $299,999 | $154 | 48 |
| 201 W Lampasas St | 0.61mi | 4/2.0 | 1,776 (-5%) | 17mo | $122,500 | $69 | 45 |
| 806 W Milam St | 0.65mi | 3/2.0 (-1) | 1,866 (-0%) | 20mo | $185,000 | $99 | 44 |
| 307 S Carlton St | 0.72mi | 3/2.0 (-1) | 1,973 (+6%) | 8mo | $319,900 | $162 | 41 |
| 705 E Denton St | 0.51mi | 3/2.0 (-1) | 1,627 (-13%) | 7mo | $298,000 | $183 | 40 |
| 1305 N Breckenridge St | 0.56mi | 3/2.0 (-1) | 1,627 (-13%) | 19mo | $295,000 | $181 | 27 |
| 1303 N Preston St | 0.57mi | 3/2.0 (-1) | 1,612 (-14%) | 18mo | $225,000 | $140 | 27 |
Match score weights: distance 35% · size 25% · config 20% · recency 20%. Top-matched comps best support the ARV.
Projected returns pro-forma
-3.0% appreciation · 2.95% rent growth · sell at horizon
- IRR
- -8.1%
- Equity multiple
- 0.70×
- Total profit
- $-15,873
- Equity at exit
- $28,255
- IRR
- 1.5%
- Equity multiple
- 1.10×
- Total profit
- $5,519
- Equity at exit
- $16,384
Cash invested: $53,060 (down + closing). Projections, not guarantees.
Landlord ↔ Tenant lean methodology
- Overall (STATE)
- 87 Strongly Landlord-Friendly
- State Texas
- 87 Strongly Landlord-Friendly · R+5
- County
- — inherits STATE
- City
- — inherits STATE
ZIP-level market 75119
- Rents YoY
- 3.0%
- Active inventory
- 363
- Price-to-rent
- 6.9×
Monthly cashflow live
- Estimated rent
- $2,298 high interval (Pro) →
- Mortgage (P&I)
- −$994
- Tax from tax record
- −$511 /mo · $6,136/yr
- Insurance
- −$79
- HOA
- −$0
- Vacancy / Maint / Mgmt
- −$483
- Net cashflow
- $232
Break-even live
UW: 25.0% down · 7.5% · 30yr · 1.5% tax · 5.0% vac · 8.0% maint · 8.0% mgmt
Financing live
Cash to close
- Down payment
- $47,375
- Closing costs
- $5,685
- Reserves months
- —
- Total cash needed
- —
Loan-product check · same deal, 3 products live
Conventional
25% down · 7.5% · 30yr
- Down + closing
- —
- Monthly P&I
- —
- Monthly cashflow
- —
- DSCR
- —
- Eligible?
- —
Personal DTI + credit; lowest rate.
DSCR
20% down · 8.5% · 30yr
- Down + closing
- —
- Monthly P&I
- —
- Monthly cashflow
- —
- DSCR
- —
- Eligible?
- —
No personal income docs; deal must DSCR.
Hard money
10% down · 12.0% · 12mo
- Down + closing
- —
- Monthly P&I
- —
- Monthly cashflow
- —
- DSCR
- —
- Eligible?
- —
Short-term bridge; refi at stabilization.
Rent comps 11 comps
| Address | Beds | Baths | Sqft | Rent | $/sqft | DOM | Units | Dist |
|---|---|---|---|---|---|---|---|---|
| 607 N Dallas St Ennis, TX | 3.0 | 2.5 | 2370 | $2,995 | $1.26 | 43d | 1 | 0.10mi |
| 206 E Belknap St Ennis, TX | 3.0 | 1.0 | 1442 | $1,700 | $1.18 | 43d | 1 | 0.20mi |
| 508 W Baylor St Apt B Ennis, TX | 3.0 | 2.0 | 1260 | $1,495 | $1.19 | 22d | 1 | 0.30mi |
| 1309 N Clay St Ennis, TX | 3.0 | 2.0 | 1609 | $1,650 | $1.03 | 1d | 1 | 0.67mi |
| 1005 Sunset Dr Ennis, TX | 3.0 | 2.0 | 1923 | $1,950 | $1.01 | 3d | 1 | 0.97mi |
| 1005 Sunset Dr Ennis, TX | 3.0 | 2.0 | 1923 | $1,950 | $1.01 | 1d | 1 | 0.97mi |
| 2001 Floyd St Ennis, TX | 4.0 | 2.0 | 1350 | $1,641 | $1.22 | 1d | 1 | 0.99mi |
| 1500 W Baldridge St Ennis, TX | 3.0 | 2.0 | 1602 | $1,800 | $1.12 | 43d | 1 | 1.08mi |
| 517 Cherry Ln Ennis, TX | 4.0 | 2.0 | 1440 | $1,975 | $1.37 | 12d | 1 | 1.14mi |
| 1204 Williamsburg Dr Ennis, TX | 4.0 | 2.0 | 2258 | $2,295 | $1.02 | 43d | 1 | 1.26mi |
| 2402 Woodlawn Dr Ennis, TX | 3.0 | 2.0 | 1752 | $2,000 | $1.14 | 22d | 1 | 1.47mi |
Listing history 20 events
-
2026-06-18days on market $189,500 Active 57 DOM
-
2026-06-17days on market $189,500 Active 56 DOM
-
2026-06-16days on market $189,500 Active 55 DOM
-
2026-06-15days on market $189,500 Active 54 DOM
-
2026-06-13days on market $189,500 Active 52 DOM
-
2026-06-09days on market $189,500 Active 48 DOM
-
2026-06-08days on market $189,500 Active 47 DOM
-
2026-06-07days on market $189,500 Active 46 DOM
-
2026-06-04days on market $189,500 Active 43 DOM
-
2026-06-03days on market $189,500 Active 42 DOM
-
2026-06-02days on market $189,500 Active 41 DOM
-
2026-06-01days on market $189,500 Active 40 DOM
-
2026-05-31days on market $189,500 Active 39 DOM
-
2026-04-22$189,500 Active 500-char remark
Show marketing remark (500 chars)
Great opportunity on Historical Home right in Downtown Ennis! Plenty of space, offering 4 bedrooms and 2 baths, interior has been painted and added new carpet thru out, master bath has been updated as well, Central AC and heat work great, roof was put on around 2020, home is leased making it a great investment property or make it your dream own home with just some TLC! Tenants can stay or move out with no problem, home is priced way under Value so make your best offer now before it’s gone!
-
2019-11-15soldstatus
-
2014-04-08soldstatus
-
2013-08-06soldstatus Closed 398-char remark
Show marketing remark (398 chars)
AUCTION!!!! FORECLOSURE-- GET YOUR REALTOR TO SHOW YOU THIS PROPERTY AND THEN BID. YOUR REALTOR WILL BE ABLE TO GIVE FULL INFORMATION AND INSTRUCTIONS FOR THIS TIME LIMIT BID. PROPERTY SOLD AS IS WITHOUT REPAIR, WARRANTY OR SELLER DISCLOSURE - DUE DILIGENCE TO BE DONE PRIOR TO BIDDING. BUYER OR BUYER S AGENT TO VERIFY ALL INFORMATION: SCHOOLS, TAXES, RESTRICTIONS AND ROOM SIZES, ETC. SOLD AS IS.
-
2013-06-25status Pending 398-char remark
Show marketing remark (398 chars)
AUCTION!!!! FORECLOSURE-- GET YOUR REALTOR TO SHOW YOU THIS PROPERTY AND THEN BID. YOUR REALTOR WILL BE ABLE TO GIVE FULL INFORMATION AND INSTRUCTIONS FOR THIS TIME LIMIT BID. PROPERTY SOLD AS IS WITHOUT REPAIR, WARRANTY OR SELLER DISCLOSURE - DUE DILIGENCE TO BE DONE PRIOR TO BIDDING. BUYER OR BUYER S AGENT TO VERIFY ALL INFORMATION: SCHOOLS, TAXES, RESTRICTIONS AND ROOM SIZES, ETC. SOLD AS IS.
-
2013-06-17$22,000 Active 398-char remark
Show marketing remark (398 chars)
AUCTION!!!! FORECLOSURE-- GET YOUR REALTOR TO SHOW YOU THIS PROPERTY AND THEN BID. YOUR REALTOR WILL BE ABLE TO GIVE FULL INFORMATION AND INSTRUCTIONS FOR THIS TIME LIMIT BID. PROPERTY SOLD AS IS WITHOUT REPAIR, WARRANTY OR SELLER DISCLOSURE - DUE DILIGENCE TO BE DONE PRIOR TO BIDDING. BUYER OR BUYER S AGENT TO VERIFY ALL INFORMATION: SCHOOLS, TAXES, RESTRICTIONS AND ROOM SIZES, ETC. SOLD AS IS.
-
2001-03-01soldstatus
ⓘ Source: listings_history table (triggers on properties + properties_extension) + one-shot
backfill from property_details.listing_events for pre-trigger history.
Tax reassessment forecast TX · Resets to sale price
- Current annual tax
- $6,136 · $511/mo
- Projected year-2 tax
- $6,136 · $511/mo
- Expected delta
- $0/yr ($0/mo · 0.0%)
ⓘ Screening estimate from a state-policy table — verify with the county assessor before closing.
Climate risk First Street
- Flood 1/10 Low FEMA zone X (unshaded) · 0% chance over 30 yrs
- Wildfire 4/10 Moderate
- Heat 7/10 Severe 6 d/yr ≥109°F today · 21 d/yr by 30 yrs out
- Wind 6/10 Major 27% chance of damaging wind over 30 yrs
- Air quality 2/10 Low 0 unhealthy d/yr today · 1 by 30 yrs out
Nearby sold comps map
Loading sold comps map…
Walkable amenities ~0.75 mi
Loading nearby amenities…
Taxation est. · year 1
- Rental income
- $27,579
- − Mortgage interest
- −$10,615
- − Property taxes
- −$6,136
- − Insurance
- −$948
- − Repairs & maintenance
- −$2,206
- − Management
- −$2,206
- − Depreciation
- −$5,513
- Taxable loss
- −$45
- Est. tax savings @ 24.0%
- +$11
- After-tax cash flow
- $2,789/yr
For passive investors: Depreciation is non-cash, so a rental often shows a tax loss while cash-flowing — sheltering income. Rental losses are passive: they offset passive income freely, and up to $25,000/yr can offset ordinary (W-2) income if you actively participate and your MAGI is under $100k (phasing out to $0 by $150k); unused losses carry forward. On sale, claimed depreciation is recaptured at up to 25%, and gains may owe capital-gains tax (a 1031 exchange can defer both). Figures are a year-1 estimate at your 24.0% rate — not tax advice; consult a CPA.
Schools (NCES district)
- District
- Ennis ISD
- NCES district ID
- 4818540
- Math proficiency
- 41% ▼ -6.00%
- Reading proficiency
- 39% ▼ -3.00%
- Median HH income
- $46,105
- Composite
- 34.14/100
- National rank
- #5283
- State rank
- #411 of 826 in TX
Livability — Ennis
- Score
- 71/100
- State rank
- #304
- US rank
- #6893
Category grades
Schools grade is shown separately in the Schools card above.
Census & demographics
- Census place
- Ennis, TX
- County
- Ellis County · 199,237 people
- City population
- 31,866
- Metro
- Dallas-Fort Worth-Arlington, TX
- Population (ZIP)
- 31,866
- Household income
- $77,053
- Rent vs Own
- Severe rent burden
- 784.0
Population outlook (Ellis County) Hauer SSP2
- Today (2025)
- 194,556 people
- By 2030
- 209,679 · +7.8%
- By 2040
- 238,837 · +22.8%
- By 2050
- 265,451 · +36.4%
- By 2075
- 326,571 · +67.9%
- By 2100
- 362,156 · +86.1%
Race, ethnicity, and origin ACS 2023
- Neighborhood character
- Diverse neighborhood (Simpson 0.60)
- Race & ethnicity
- White 47% Hispanic / Latino 41% Two or more races 13% Black 9%
- Hispanic origin (detail)
- Mexican 37%
- Common ancestry
- Slovak 1% Serbian 1% Italian 1%
- Foreign-born
- 15% · Canada
- Languages at home
- 69% English-only · Spanish 29% Other Indo-European 1%
Political lean MEDSL · Ellis
- 2024 margin
- Solid R (+31.1) · D 34.0% · R 65.1%
- 2008→2024 swing
- +11.2pp toward D · 2008: -42.2pp · 2024: -31.1pp
- All cycles
- 2024: R+31.1 2020: R+34.1 2016: R+45.4 2012: R+47.5 2008: R+42.2
Not yet ingested
- Civics
- —
Market trends
- HPI YoY
- ▼ -207.30%
- Current HPI
- 253.0134
- Rent YoY
- ▲ 2.95%
- Metro
- Dallas-Fort Worth-Arlington, TX
- State GDP YoY
- ▲ 3.95%
- F500 in state
- 110
Industry mix (Fortune 500 HQ in TX)
| Industry | F500 HQs | Revenue |
|---|---|---|
| Energy | 16 | $1,198B |
|
||
| Technology | 5 | $198B |
|
||
| Engineering / Construction | 4 | $72B |
|
||
| Energy Services | 3 | $60B |
|
||
| Utilities | 3 | $41B |
|
||
| Healthcare | 2 | $330B |
|
||
Price history
+761.4% since first listed7 events — show timeline
- 2026-04-22 Listed $189,500 NTREIS
- 2019-11-15 Sold (Public Records) — Public Records
- 2014-04-08 Sold (Public Records) — Public Records
- 2013-08-06 Sold (MLS) — NTREIS
- 2013-06-25 Pending — NTREIS
- 2013-06-17 Listed $22,000 NTREIS
- 2001-03-01 Sold (Public Records) — Public Records
Property tax history
+5.6%/yrLatest (2025): $6,136 · -2.7% YoY. Source: county tax records.
Cash-flow waterfall
monthlySold comps — $/sqft
last 12 mo · ≤1 miLoading sold comps…