35080 Gilmore Rd · Monroe, OK
Flood risk 1/10 · Minimal
- FEMA flood zone
- X (unshaded)
- Chance of flooding over 30 yrs
- 0.0%
- Est. flood insurance / yr
- $507 – $1,088
Fire risk 7/10 · Major
- Est. fire insurance / yr
- $2,463 – $4,575
Heat risk 6/10 · Moderate
- Hot days now (above 114°F)
- 7 days/yr
- Hot days in 30 yrs
- 21 days/yr
Wind risk 3/10 · Minor
- Chance of severe wind over 30 yrs
- 5.0%
Air-quality risk 2/10 · Minimal
- Unhealthy air days now
- 1 days/yr
- Unhealthy air days in 30 yrs
- 1 days/yr
Risk factors via First Street. Map © Google.
Why this score? — see what drove the D+ grade
The composite is a weighted blend of 9 inputs, each scored 0–100. Each bar is that input's sub-score; the figure is the points it added to the 100-point composite (weight × sub-score).
- Cash flow +16.5/30.0
- ARV discount +7.5/15.0
- Appreciation +7.1/10.0
- DSCR +5.1/10.0
- 1% rule +3.3/10.0
- Livability +2.9/5.0
- Rent growth +2.5/5.0
- Condition / age +2.5/5.0
- Schools +2.0/10.0
$160,000
🖨 Deal sheet 📄 Offer letter ✓ Due diligence
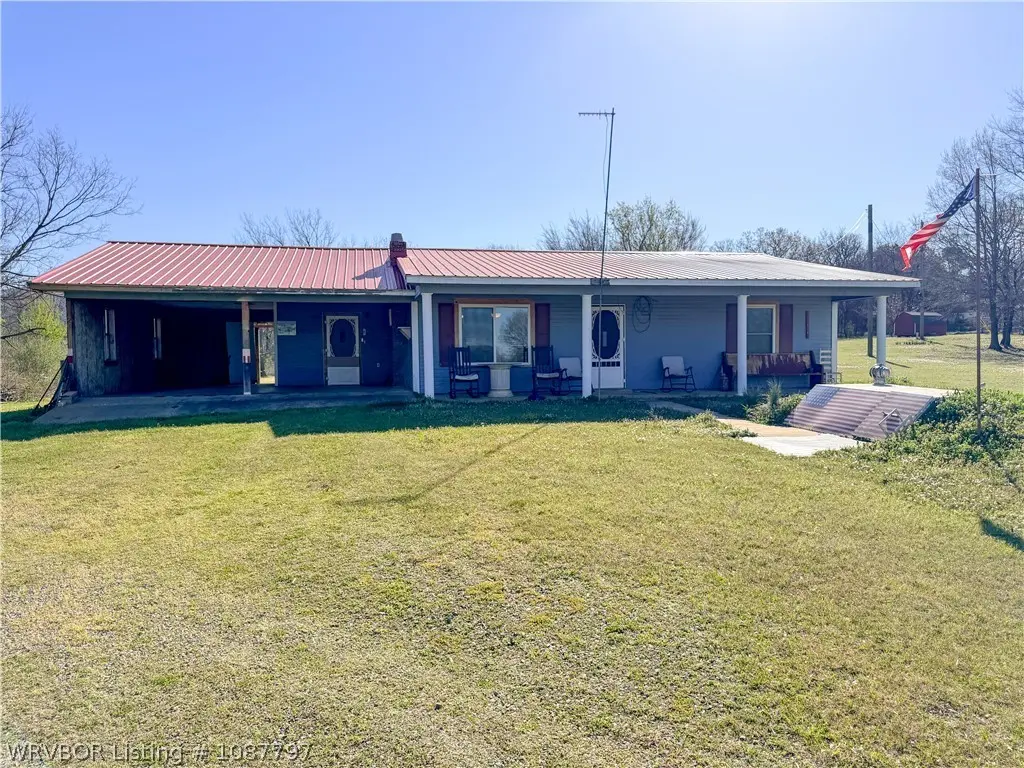
Listing remarks
Welcome to peaceful country living on 2.5 +/- beautiful acres! This charming 2-bedroom, 2-bath home offers the perfect blend of comfort, functionality, and space to enjoy the outdoors. Inside, you’ll find a well-designed layout with central heat and air for year-round comfort, along with spacious living areas that create a warm and inviting feel. The durable metal roof adds long-term value and low maintenance, giving you peace of mind for years to come. Step outside and take in everything this property has to offer—mature shade trees provide a relaxing setting, while the 2-car carport offers convenient covered parking. There’s plenty of room for kids, pets, or simply enjoy
Key facts
- 2 car carport
- Metal roof
- 2.5 acres
Tags
Neighborhood map
What this means for you Summary
Snapshot
- This is a 2-bed/1.0-bath single-family listed at $160k.
Deal economics
- At list price, monthly cash flow is $94 ($1k/yr) — positive.
- The deal already cash-flows at list — no discount required.
- To meet the 1% rule (rent ≥ 1% of price), the offer needs to be $133k (17.0% below list).
- Recommended offer: $133k (17.0% below list) — sets the bar for 1% rule.
Location & tenants
- Location reads 57/100 on livability (#493 in OK) — a working-class tenant base; expect higher turnover. Strengths: cost of living A+, housing A+; Watch: schools F, crime F, amenities F.
- Monroe (rural): math 20% / reading 20% proficiency, ranked #404 of 513 in OK (top 79%) — low school quality limits family demand, transient renter base, plan for 1-2y turnover; 67% free/reduced lunch — lower-income household profile, screen leases tightly.
- Market conditions: 137 active listings in the ZIP; 73 units permitted in Le Flore County in 2024 (0 in 5+ unit buildings).
Forward outlook
- In year one you build about $8k of equity ($1k loan paydown + $7k appreciation (4.2% local appreciation)).
- Le Flore County population projected at -13% by 2050 — secular population decline; favor cash flow + early exit over multi-decade hold.
- At projected returns (4.2% appreciation + 3.0% rent growth), your $45k cash investment doubles in ~5 years — after that, you're playing with house money.
- By year 5, paydown + projected appreciation supports a ~$34k cash-out refi (75% LTV) — recoverable capital for the next deal without selling this one.
Negotiation context
- It's been on market 25 days — a 2% lower offer ($158k) is reasonable based on typical stale-listing flexibility.
- Current owner paid $50k; list at $160k implies a 220% gain — meaningful room to come down on a strong offer.
Risks & watch-outs
- Climate carrying-cost: major wildfire risk; extreme-heat days projected 7→21/yr by 2055 (HVAC capex compounding) — expect insurance premiums to compound above CPI over the hold.
Questions for the listing agent
- Is there a deadline driving the sale (1031 exchange, divorce, estate, relocation)? That informs how much negotiation room exists.
- Schools are F-rated, which usually means shorter tenancies and higher turnover. Who's the typical renter profile here, and what's been the actual vacancy rate?
- Crime grade is F in this area — have there been break-ins, vandalism, or insurance claims at this property in the last 3 years? What carrier currently insures it and at what premium?
- The area grade is low — what's the realistic commute time and amenity access for the typical tenant pool here? Any planned neighborhood developments (good or bad) we should know about?
- What's the average days-on-market for RENTAL listings here right now (not sales)? A rising rental-DOM trend means longer vacancies and softer asking-rent achievability than the comps imply.
- What's the recent tenant-quality profile in this submarket — average credit score on applications, eviction rate, late-payment / NSF rate, and stable-employment percentage? A property-management company in the area should have these aggregated.
- How much new for-sale + rental construction is in the pipeline within 1–3 miles? Heavy new supply typically softens prices + rents 12–24 months out; constrained supply supports both.
Investment metrics
- 1% rule
- 0.83% ✗
- Cap rate
- 7.00%
- Cash-on-cash
- 2.51%
- DSCR
- 1.11
- GRM
- 10.0
CMA / ARV
No comps found within radius.
Projected returns pro-forma
4.22% appreciation · 3.0% rent growth · sell at horizon
- IRR
- 13.0%
- Equity multiple
- 1.80×
- Total profit
- $35,757
- Equity at exit
- $83,210
- IRR
- 14.3%
- Equity multiple
- 3.38×
- Total profit
- $106,456
- Equity at exit
- $137,790
Cash invested: $44,800 (down + closing). Projections, not guarantees.
Landlord ↔ Tenant lean methodology
- Overall (STATE)
- 83 Strongly Landlord-Friendly
- State Oklahoma
- 83 Strongly Landlord-Friendly · R+20
- County
- — inherits STATE
- City
- — inherits STATE
ZIP-level market 74953
- Home prices YoY
- 1.7%
- Active inventory
- 137
- Price-to-rent
- 10.0×
Monthly cashflow live
- Estimated rent
- $1,327 medium interval (Pro) →
- Mortgage (P&I)
- −$839
- Tax from tax record
- −$49 /mo · $591/yr
- Insurance
- −$67
- HOA
- −$0
- Vacancy / Maint / Mgmt
- −$279
- Net cashflow
- $94
Break-even live
UW: 25.0% down · 7.5% · 30yr · 1.5% tax · 5.0% vac · 8.0% maint · 8.0% mgmt
Financing live
Cash to close
- Down payment
- $40,000
- Closing costs
- $4,800
- Reserves months
- —
- Total cash needed
- —
Loan-product check · same deal, 3 products live
Conventional
25% down · 7.5% · 30yr
- Down + closing
- —
- Monthly P&I
- —
- Monthly cashflow
- —
- DSCR
- —
- Eligible?
- —
Personal DTI + credit; lowest rate.
DSCR
20% down · 8.5% · 30yr
- Down + closing
- —
- Monthly P&I
- —
- Monthly cashflow
- —
- DSCR
- —
- Eligible?
- —
No personal income docs; deal must DSCR.
Hard money
10% down · 12.0% · 12mo
- Down + closing
- —
- Monthly P&I
- —
- Monthly cashflow
- —
- DSCR
- —
- Eligible?
- —
Short-term bridge; refi at stabilization.
Listing history 3 events
-
2026-04-13status Pending
-
2026-03-19$160,000 Active
-
2016-05-05soldstatus $50,000
ⓘ Source: listings_history table (triggers on properties + properties_extension) + one-shot
backfill from property_details.listing_events for pre-trigger history.
Tax reassessment forecast OK · Resets to sale price
- Current annual tax
- $591 · $49/mo
- Projected year-2 tax
- $1,440 · $120/mo
- Expected delta
- +$849/yr (+$71/mo · 143.7%)
ⓘ Screening estimate from a state-policy table — verify with the county assessor before closing.
Climate risk First Street
- Flood 1/10 Low FEMA zone X (unshaded) · 0% chance over 30 yrs
- Wildfire 7/10 Severe
- Heat 6/10 Major 7 d/yr ≥114°F today · 21 d/yr by 30 yrs out
- Wind 3/10 Moderate 5% chance of damaging wind over 30 yrs
- Air quality 2/10 Low 1 unhealthy d/yr today · 1 by 30 yrs out
Nearby sold comps map
Loading sold comps map…
Walkable amenities ~0.75 mi
Loading nearby amenities…
Taxation est. · year 1
- Rental income
- $15,928
- − Mortgage interest
- −$8,962
- − Property taxes
- −$591
- − Insurance
- −$800
- − Repairs & maintenance
- −$1,274
- − Management
- −$1,274
- − Depreciation
- −$4,655
- Taxable loss
- −$1,628
- Est. tax savings @ 24.0%
- +$391
- After-tax cash flow
- $1,514/yr
For passive investors: Depreciation is non-cash, so a rental often shows a tax loss while cash-flowing — sheltering income. Rental losses are passive: they offset passive income freely, and up to $25,000/yr can offset ordinary (W-2) income if you actively participate and your MAGI is under $100k (phasing out to $0 by $150k); unused losses carry forward. On sale, claimed depreciation is recaptured at up to 25%, and gains may owe capital-gains tax (a 1031 exchange can defer both). Figures are a year-1 estimate at your 24.0% rate — not tax advice; consult a CPA.
Schools (NCES district)
- District
- Monroe
- NCES district ID
- 4020190
- Math proficiency
- 20% ▼ -5.00%
- Reading proficiency
- 20% ▼ -10.00%
- Median HH income
- $42,789
- Composite
- 20.47/100
- National rank
- #13787
- State rank
- #404 of 513 in OK
Livability — Monroe
- Score
- 57/100
- State rank
- #493
- US rank
- #22311
Category grades
Schools grade is shown separately in the Schools card above.
Census & demographics
- City population
- 106
- Population (ZIP)
- 12,284
Population outlook (Le Flore County) Hauer SSP2
- Today (2025)
- 48,504 people
- By 2030
- 47,474 · -2.1%
- By 2040
- 44,914 · -7.4%
- By 2050
- 42,239 · -12.9%
- By 2075
- 35,071 · -27.7%
- By 2100
- 25,949 · -46.5%
Race, ethnicity, and origin ACS 2023
- Neighborhood character
- Predominantly White (70%)
- Race & ethnicity
- White 70% Hispanic / Latino 12% Native American 10% Two or more races 10% Black 1%
- Hispanic origin (detail)
- Mexican 11%
- Common ancestry
- Slovak 2% Iranian 2% Serbian 1%
- Foreign-born
- 7% · Canada
- Languages at home
- 90% English-only · Spanish 10%
Political lean MEDSL · Le Flore
- 2024 margin
- Solid R (+64.8) · D 17.0% · R 81.8% · Other 1.3%
- 2008→2024 swing
- -26.1pp toward R · 2008: -38.6pp · 2024: -64.8pp
- All cycles
- 2024: R+64.8 2020: R+63.4 2016: R+58.7 2012: R+41.1 2008: R+38.6
Not yet ingested
- Civics
- —
Market trends
- HPI YoY
- ▲ 4.22%
- Current HPI
- 252.3937
- Rent YoY
- —
- Metro
- —
- State GDP YoY
- ▲ 1.55%
- F500 in state
- 6
Industry mix (Fortune 500 HQ in OK)
| Industry | F500 HQs | Revenue |
|---|---|---|
| Energy | 3 | $48B |
|
||
Price history
+220.0% since first listed3 events — show timeline
- 2026-04-13 Pending — WRVBOR
- 2026-03-19 Listed $160,000 WRVBOR
- 2016-05-05 Sold (Public Records) $50,000 Public Records
Property tax history
+5.0%/yrLatest (2025): $591 · -8.7% YoY. Source: county tax records.
Cash-flow waterfall
monthlySold comps — $/sqft
last 12 mo · ≤1 miLoading sold comps…