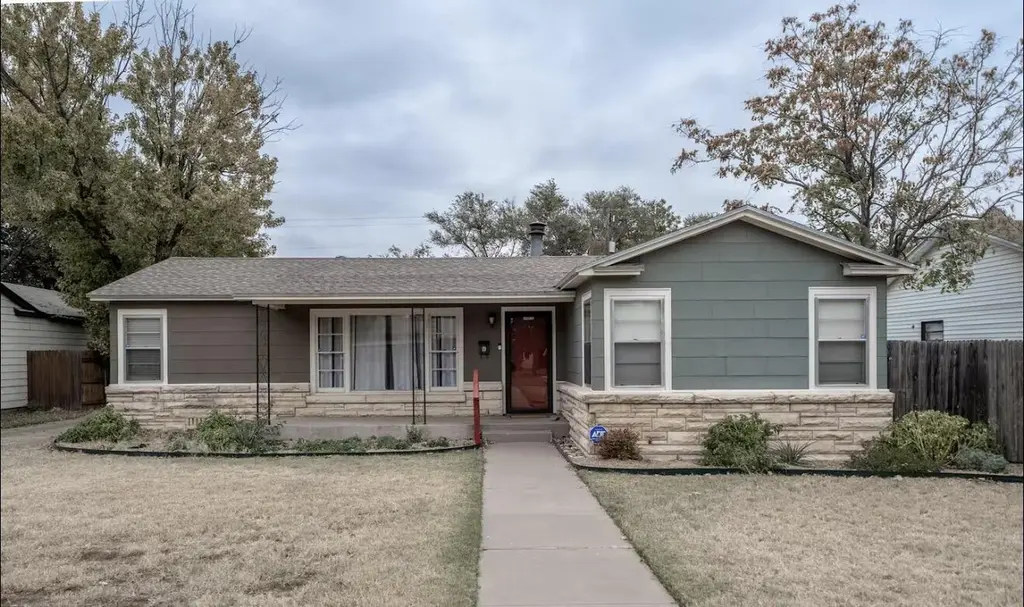
2816 37th St · Lubbock, TX
Flood risk 1/10 · Minimal
- FEMA flood zone
- X (unshaded)
- Chance of flooding over 30 yrs
- 0.0%
- Est. flood insurance / yr
- $507 – $1,088
Fire risk 1/10 · Minimal
- Est. fire insurance / yr
- $1,222 – $2,270
Heat risk 5/10 · Moderate
- Hot days now (above 99°F)
- 7 days/yr
- Hot days in 30 yrs
- 21 days/yr
Wind risk 2/10 · Minimal
- Chance of severe wind over 30 yrs
- —
Air-quality risk 2/10 · Minimal
- Unhealthy air days now
- 1 days/yr
- Unhealthy air days in 30 yrs
- 1 days/yr
Risk factors via First Street. Map © Google.
Why this score? — see what drove the D+ grade
The composite is a weighted blend of 9 inputs, each scored 0–100. Each bar is that input's sub-score; the figure is the points it added to the 100-point composite (weight × sub-score).
- Cash flow +16.0/30.0
- ARV discount +7.5/15.0
- DSCR +5.0/10.0
- 1% rule +4.1/10.0
- Livability +4.0/5.0
- Schools +3.1/10.0
- Rent growth +3.0/5.0
- Condition / age +2.5/5.0
- Appreciation +0.0/10.0
$148,000
🖨 Deal sheet (PDF) 📄 Offer letter ✓ Due diligence
Listing remarks
Turn-key opportunity in Lubbock, TX. Offered fully furnished with all decor, linens, kitchenware, and contents included. Just take over and start earning from day one. This charming 2-bedroom, 1-bathroom single-family home is already set up as a performing short-term rental on Airbnb, meaning the hard work of staging and furnishing has been done for you. Everything you need to operate , or simply move right in comes with the property. The home features a large outdoor space perfect for guests looking to relax and enjoy the West Texas evenings. The HVAC system was replaced in 2023, giving the next owner confidence in one of the most important mechanical systems in the home. Whether you're an
Key facts
- Turn-key opportunity
- Hvac system replaced
- Large outdoor space
Tags
Neighborhood map
What this means for you Summary
Snapshot
- This is a 3-bed/2.0-bath single-family listed at $148k.
Deal economics
- At list price, monthly cash flow is $74 ($894/yr) — positive.
- The deal already cash-flows at list — no discount required.
- To meet the 1% rule (rent ≥ 1% of price), the offer needs to be $135k (8.7% below list).
- Recommended offer: $135k (8.7% below list) — sets the bar for 1% rule.
Location & tenants
- Location reads 80/100 on livability (#37 in TX, #1,749 nationally) — a professional / high-income tenant draw. Strengths: commute A+, cost of living A+, housing A+; Watch: employment C-, schools D+, crime F.
- Lubbock ISD (urban): math 36% / reading 39% proficiency, ranked #481 of 826 in TX (top 58%) — families likely to look elsewhere, expect single-tenant / working-renter base with shorter leases; 60% free/reduced lunch — lower-income household profile, screen leases tightly.
- Market conditions: Rents rising (+1.9%/yr); 183 active listings in the ZIP; 40 comparable units currently listed for rent nearby; rentals at typical pace (median 22d on market — plan ~3-4 weeks tenant-placement turnaround); 45% of comp listings sitting > 30 days — soft ceiling on asking rent; 2,219 units permitted in Lubbock County in 2024 (252 in 5+ unit buildings).
Forward outlook
- Local home prices are declining (-3.0%/yr); year-one equity from $1k of loan paydown is wiped out by about $4k of value loss. Plan a longer hold.
- Lubbock County population projected at +39% by 2050 — long-run rental-demand tailwind backs the buy-and-hold thesis.
Negotiation context
- It's been on market 32 days — a 3% lower offer ($144k) is reasonable based on typical stale-listing flexibility.
Risks & watch-outs
- Watch-outs: built in 1950 — expect roof / HVAC / electrical / plumbing capex.
- Climate carrying-cost: extreme-heat days projected 7→21/yr by 2055 (HVAC capex compounding) — expect insurance premiums to compound above CPI over the hold.
Questions for the listing agent
- It's been on market 32 days. Have you received any prior offers? Is the seller open to a 9% concession, seller financing, or rate buy-down credit?
- Built in 1950 — when were the roof, HVAC, electrical panel, plumbing, and water heater last replaced?
- Is there a deadline driving the sale (1031 exchange, divorce, estate, relocation)? That informs how much negotiation room exists.
- Schools are D-rated, which usually means shorter tenancies and higher turnover. Who's the typical renter profile here, and what's been the actual vacancy rate?
- Crime grade is F in this area — have there been break-ins, vandalism, or insurance claims at this property in the last 3 years? What carrier currently insures it and at what premium?
- The area grade is low — what's the realistic commute time and amenity access for the typical tenant pool here? Any planned neighborhood developments (good or bad) we should know about?
- What's the average days-on-market for RENTAL listings here right now (not sales)? A rising rental-DOM trend means longer vacancies and softer asking-rent achievability than the comps imply.
- What's the recent tenant-quality profile in this submarket — average credit score on applications, eviction rate, late-payment / NSF rate, and stable-employment percentage? A property-management company in the area should have these aggregated.
- How much new for-sale + rental construction is in the pipeline within 1–3 miles? Heavy new supply typically softens prices + rents 12–24 months out; constrained supply supports both.
Investment metrics
- 1% rule
- 0.91% ✗
- Cap rate
- 6.90%
- Cash-on-cash
- 2.16%
- DSCR
- 1.10
- GRM
- 9.1
CMA / ARV
No comps found within radius.
Projected returns pro-forma
-3.0% appreciation · 1.94% rent growth · sell at horizon
- IRR
- -14.0%
- Equity multiple
- 0.50×
- Total profit
- $-20,663
- Equity at exit
- $22,067
- IRR
- -7.0%
- Equity multiple
- 0.58×
- Total profit
- $-17,604
- Equity at exit
- $12,796
Cash invested: $41,440 (down + closing). Projections, not guarantees.
Landlord ↔ Tenant lean methodology
- Overall (STATE)
- 87 Strongly Landlord-Friendly
- State Texas
- 87 Strongly Landlord-Friendly · R+5
- County
- — inherits STATE
- City
- — inherits STATE
ZIP-level market 79413
- Rents YoY
- 1.9%
- Active inventory
- 183
- Price-to-rent
- 9.1×
Monthly cashflow live
- Estimated rent
- $1,351 high interval (Pro) →
- Mortgage (P&I)
- −$776
- Tax from tax record
- −$155 /mo · $1,859/yr
- Insurance
- −$62
- HOA
- −$0
- Vacancy / Maint / Mgmt
- −$284
- Net cashflow
- $74
Break-even live
Sensitivity live
| Price | -10% $158 | -5% $116 | +0% $74 | +5% $33 | +10% $-9 |
|---|---|---|---|---|---|
| Rent | -10% $-32 | -5% $21 | +0% $74 | +5% $128 | +10% $181 |
| Rate | -1.0pp $149 | -0.5pp $112 | base $74 | +0.5pp $36 | +1.0pp $-3 |
UW: 25.0% down · 7.5% · 30yr · 1.5% tax · 5.0% vac · 8.0% maint · 8.0% mgmt
Financing live
Cash to close
- Down payment
- $37,000
- Closing costs
- $4,440
- Reserves months
- —
- Total cash needed
- —
Loan-product check · same deal, 3 products live
Conventional
25% down · 7.5% · 30yr
- Down + closing
- —
- Monthly P&I
- —
- Monthly cashflow
- —
- DSCR
- —
- Eligible?
- —
Personal DTI + credit; lowest rate.
DSCR
20% down · 8.5% · 30yr
- Down + closing
- —
- Monthly P&I
- —
- Monthly cashflow
- —
- DSCR
- —
- Eligible?
- —
No personal income docs; deal must DSCR.
Hard money
10% down · 12.0% · 12mo
- Down + closing
- —
- Monthly P&I
- —
- Monthly cashflow
- —
- DSCR
- —
- Eligible?
- —
Short-term bridge; refi at stabilization.
Rent comps 40 comps
| Address | Beds | Baths | Sqft | Rent | $/sqft | DOM | Units | Dist |
|---|---|---|---|---|---|---|---|---|
| 2801 36th St Lubbock, TX | 3.0 | 2.0 | 1446 | $2,700 | $1.87 | 44d | 1 | 0.06mi |
| 2723 36th St Lubbock, TX | 2.0 | 1.0 | 802 | $950 | $1.18 | 21d | 1 | 0.07mi |
| 2712 37th St Lubbock, TX | 3.0 | 1.0 | 1136 | $1,300 | $1.14 | 44d | 1 | 0.13mi |
| 2701 36th St Lubbock, TX | 2.0 | 1.0 | 802 | $1,195 | $1.49 | 14d | 1 | 0.18mi |
| 2816 40th St Lubbock, TX | 2.0 | 1.0 | 826 | $825 | $1.00 | 21d | 1 | 0.20mi |
| 2823 33rd St Lubbock, TX | 3.0 | 1.0 | 1105 | $950 | $0.86 | 44d | 1 | 0.22mi |
| 2616 37th St Lubbock, TX | 2.0 | 1.0 | 950 | $1,200 | $1.26 | 21d | 1 | 0.22mi |
| 3107 37th St Lubbock, TX | 2.0 | 1.0 | 750 | $1,095 | $1.46 | 21d | 1 | 0.24mi |
| 3114 37th St Lubbock, TX | 3.0 | 1.0 | 988 | $1,095 | $1.11 | 44d | 1 | 0.27mi |
| 3101 33rd St Lubbock, TX | 3.0 | 3.0 | 1250 | $999 | $0.80 | 44d | 1 | 0.29mi |
| 3126 38th St Lubbock, TX | 2.0 | 1.0 | 1248 | $1,195 | $0.96 | 44d | 1 | 0.30mi |
| 3007 32nd St Lubbock, TX | 3.0 | 1.0 | 1353 | $1,325 | $0.98 | 21d | 1 | 0.30mi |
| 3114 40th St Lubbock, TX | 3.0 | 2.0 | 1488 | $1,375 | $0.92 | 44d | 1 | 0.35mi |
| 3116 33rd St Lubbock, TX | 2.0 | 1.0 | 912 | $1,195 | $1.31 | 44d | 1 | 0.37mi |
| 2609 41st St Lubbock, TX | 3.0 | 2.0 | 1469 | $1,550 | $1.06 | 21d | 1 | 0.39mi |
| 3211 35th St Unit E Lubbock, TX | 2.0 | 1.0 | 850 | $850 | $1.00 | 44d | 1 | 0.39mi |
| 3211 35th St Unit A Lubbock, TX | 2.0 | 1.0 | 850 | $850 | $1.00 | 14d | 1 | 0.39mi |
| 2508 37th St Lubbock, TX | 3.0 | 2.5 | 1495 | $1,700 | $1.14 | 44d | 1 | 0.39mi |
| 2521 40th St Lubbock, TX | 2.0 | 1.0 | 902 | $1,195 | $1.32 | 21d | 1 | 0.40mi |
| 3019 42nd St Lubbock, TX | 3.0 | 1.0 | 1053 | $1,250 | $1.19 | 21d | 1 | 0.40mi |
| 2605 41st St Lubbock, TX | 2.0 | 1.0 | 882 | $995 | $1.13 | 14d | 1 | 0.40mi |
| 2506 37th St Lubbock, TX | 3.0 | 1.0 | 1053 | $1,550 | $1.47 | 21d | 1 | 0.40mi |
| 2812 43rd St Unit 6 Lubbock, TX | 2.0 | 1.0 | 1104 | $700 | $0.63 | 44d | 1 | 0.41mi |
| 2812 43rd St Unit 7 Lubbock, TX | 2.0 | 1.0 | 1104 | $750 | $0.68 | 21d | 1 | 0.41mi |
| 2906 43rd St Unit B Lubbock, TX | 2.0 | 1.0 | 870 | $850 | $0.98 | 21d | 1 | 0.42mi |
| 2521 41st St Lubbock, TX | 2.0 | 1.0 | 990 | $925 | $0.93 | 44d | 1 | 0.43mi |
| 2815 43rd St Unit 11 Lubbock, TX | 2.0 | 1.0 | 1085 | $800 | $0.74 | 21d | 1 | 0.45mi |
| 3016 30th St Lubbock, TX | 2.0 | 1.0 | 947 | $975 | $1.03 | 44d | 1 | 0.46mi |
| 2613 30th St Lubbock, TX | 3.0 | 2.0 | 1472 | $1,500 | $1.02 | 44d | 1 | 0.48mi |
| 3221 33rd St Unit A Lubbock, TX | 2.0 | 1.0 | 982 | $925 | $0.94 | 14d | 1 | 0.48mi |
| 2514 42nd St Lubbock, TX | 3.0 | 1.0 | 943 | $950 | $1.01 | 14d | 1 | 0.49mi |
| 2706 44th St Apt C Lubbock, TX | 2.0 | 1.0 | 900 | $680 | $0.76 | 44d | 1 | 0.49mi |
| 2408 35th St Lubbock, TX | 2.0 | 1.0 | 1072 | $995 | $0.93 | 21d | 1 | 0.53mi |
| 3105 44th St Lubbock, TX | 3.0 | 2.0 | 1348 | $1,375 | $1.02 | 21d | 1 | 0.53mi |
| 2611 44th St Lubbock, TX | 3.0 | 1.0 | 1200 | $1,395 | $1.16 | 44d | 1 | 0.54mi |
| 2701 44th St Lubbock, TX | 1.0–3.0 | 1.0–1.5 | 657 | $1,075 | $1.64 | 14d | 25 | 0.54mi |
| 2513 43rd St Lubbock, TX | 2.0 | 1.0 | 912 | $1,150 | $1.26 | 14d | 1 | 0.55mi |
| 2513 43rd St Lubbock, TX | 2.0 | 1.0 | 912 | $1,150 | $1.26 | 44d | 1 | 0.55mi |
| 2607 44th St Lubbock, TX | 2.0 | 2.0 | 988 | $1,325 | $1.34 | 44d | 1 | 0.55mi |
| 2420 33rd St Lubbock, TX | 2.0 | 1.0 | 800 | $799 | $1.00 | 21d | 1 | 0.56mi |
Listing history 9 events
-
2026-04-28status Pending
-
2026-03-27$148,000 Active
-
2021-08-20soldstatus
-
2019-08-08soldstatus
-
2016-07-22soldstatus
-
2015-01-09soldstatus
-
2014-10-29soldstatus
-
2014-10-29soldstatus
-
2014-10-29soldstatus
ⓘ Source: listings_history table (triggers on properties + properties_extension) + one-shot
backfill from property_details.listing_events for pre-trigger history.
Tax reassessment forecast TX · Resets to sale price
- Current annual tax
- $1,859 · $155/mo
- Projected year-2 tax
- $2,708 · $226/mo
- Expected delta
- +$850/yr (+$71/mo · 45.7%)
ⓘ Screening estimate from a state-policy table — verify with the county assessor before closing.
Climate risk First Street
- Flood 1/10 Low FEMA zone X (unshaded) · 0% chance over 30 yrs
- Wildfire 1/10 Low
- Heat 5/10 Major 7 d/yr ≥99°F today · 21 d/yr by 30 yrs out
- Wind 2/10 Low
- Air quality 2/10 Low 1 unhealthy d/yr today · 1 by 30 yrs out
Nearby sold comps map
Loading sold comps map…
Walkable amenities ~0.75 mi
Loading nearby amenities…
Taxation est. · year 1
- Rental income
- $16,210
- − Mortgage interest
- −$8,290
- − Property taxes
- −$1,859
- − Insurance
- −$740
- − Repairs & maintenance
- −$1,297
- − Management
- −$1,297
- − Depreciation
- −$4,305
- Taxable loss
- −$1,578
- Est. tax savings @ 24.0%
- +$379
- After-tax cash flow
- $1,272/yr
For passive investors: Depreciation is non-cash, so a rental often shows a tax loss while cash-flowing — sheltering income. Rental losses are passive: they offset passive income freely, and up to $25,000/yr can offset ordinary (W-2) income if you actively participate and your MAGI is under $100k (phasing out to $0 by $150k); unused losses carry forward. On sale, claimed depreciation is recaptured at up to 25%, and gains may owe capital-gains tax (a 1031 exchange can defer both). Figures are a year-1 estimate at your 24.0% rate — not tax advice; consult a CPA.
Schools (NCES district)
- District
- Lubbock ISD
- NCES district ID
- 4828500
- Math proficiency
- 36% ▼ -8.00%
- Reading proficiency
- 39% ▼ -1.00%
- Median HH income
- $39,820
- Composite
- 31.44/100
- National rank
- #5984
- State rank
- #481 of 826 in TX
Livability — Lubbock
- Score
- 80/100
- State rank
- #37
- US rank
- #1749
Category grades
Schools grade is shown separately in the Schools card above.
Census & demographics
- Census place
- Lubbock, TX
- County
- Lubbock County · 293,542 people
- City population
- 283,030
- Metro
- Lubbock, TX
- Population (ZIP)
- 23,343
- Household income
- $69,400
- Rent vs Own
- Severe rent burden
- 1211.0
Population outlook (Lubbock County) Hauer SSP2
- Today (2025)
- 345,960 people
- By 2030
- 371,449 · +7.4%
- By 2040
- 424,539 · +22.7%
- By 2050
- 481,150 · +39.1%
- By 2075
- 633,467 · +83.1%
- By 2100
- 746,853 · +115.9%
Race, ethnicity, and origin ACS 2023
- Neighborhood character
- Diverse neighborhood (Simpson 0.59)
- Race & ethnicity
- White 54% Hispanic / Latino 34% Two or more races 18% Black 6%
- Hispanic origin (detail)
- Mexican 25%
- Common ancestry
- Slovak 2% Italian 2% Serbian 1%
- Foreign-born
- 3% · Canada, China
- Languages at home
- 88% English-only · Spanish 10% Chinese 1%
Political lean MEDSL · Lubbock
- 2024 margin
- Solid R (+39.5) · D 29.7% · R 69.2% · Other 1.0%
- 2008→2024 swing
- -2.8pp toward R · 2008: -36.7pp · 2024: -39.5pp
- All cycles
- 2024: R+39.5 2020: R+32.2 2016: R+38.4 2012: R+40.9 2008: R+36.7
Not yet ingested
- Civics
- —
Market trends
- HPI YoY
- ▼ -145.52%
- Current HPI
- 239.8854
- Rent YoY
- ▲ 1.94%
- Metro
- Lubbock, TX
- State GDP YoY
- ▲ 3.95%
- F500 in state
- 110
Industry mix (Fortune 500 HQ in TX)
| Industry | F500 HQs | Revenue |
|---|---|---|
| Energy | 16 | $1,198B |
|
||
| Technology | 5 | $198B |
|
||
| Engineering / Construction | 4 | $72B |
|
||
| Energy Services | 3 | $60B |
|
||
| Utilities | 3 | $41B |
|
||
| Healthcare | 2 | $330B |
|
||
Price history
9 events — show timeline
- 2026-04-28 Pending — LARMLS
- 2026-03-27 Listed $148,000 LARMLS
- 2021-08-20 Sold (Public Records) — Public Records
- 2019-08-08 Sold (Public Records) — Public Records
- 2016-07-22 Sold (Public Records) — Public Records
- 2015-01-09 Sold (Public Records) — Public Records
- 2014-10-29 Sold (Public Records) — Public Records
- 2014-10-29 Sold (Public Records) — Public Records
- 2014-10-29 Sold (Public Records) — Public Records
Property tax history
+3.2%/yrLatest (2025): $1,859 · -2.6% YoY. Source: county tax records.
Cash-flow waterfall
monthlySold comps — $/sqft
last 12 mo · ≤1 miLoading sold comps…