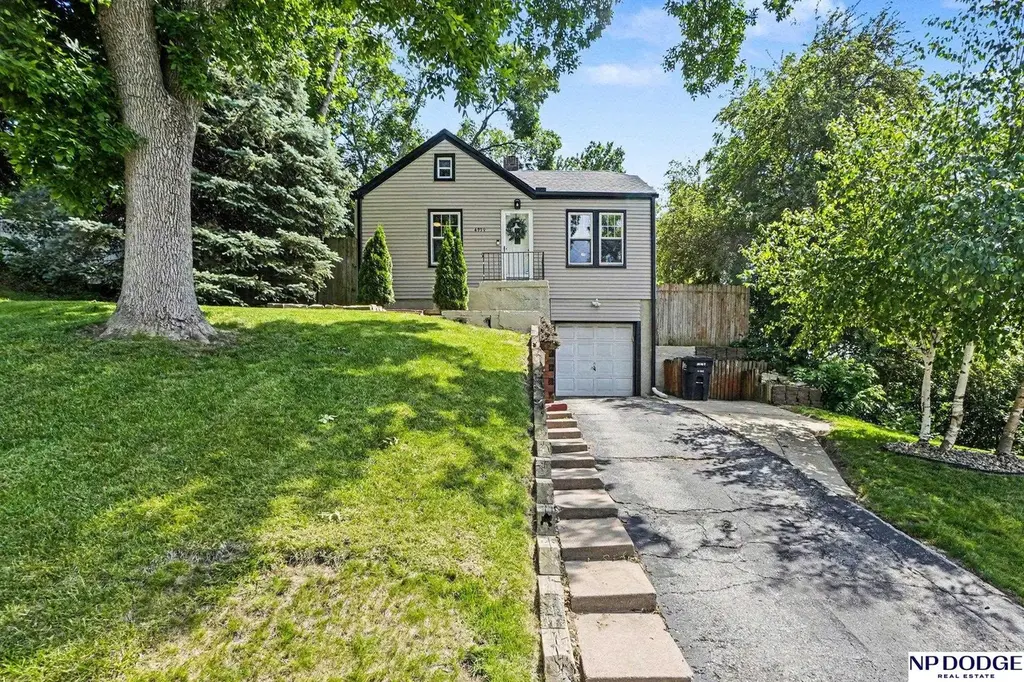
4939 Pine St · Omaha, NE
Flood risk 1/10 · Minimal
- FEMA flood zone
- X (unshaded)
- Chance of flooding over 30 yrs
- 0.0%
- Est. flood insurance / yr
- $473 – $860
Fire risk 1/10 · Minimal
- Est. fire insurance / yr
- $1,161 – $2,155
Heat risk 3/10 · Minor
- Hot days now (above 104°F)
- 7 days/yr
- Hot days in 30 yrs
- 15 days/yr
Wind risk 2/10 · Minimal
- Chance of severe wind over 30 yrs
- —
Air-quality risk 2/10 · Minimal
- Unhealthy air days now
- 2 days/yr
- Unhealthy air days in 30 yrs
- 2 days/yr
Risk factors via First Street. Map © Google.
Why this score? — see what drove the D grade
The composite is a weighted blend of 9 inputs, each scored 0–100. Each bar is that input's sub-score; the figure is the points it added to the 100-point composite (weight × sub-score).
- Cash flow +14.5/30.0
- ARV discount +7.5/15.0
- DSCR +4.4/10.0
- 1% rule +4.2/10.0
- Livability +4.2/5.0
- Rent growth +3.6/5.0
- Condition / age +2.5/5.0
- Schools +2.1/10.0
- Appreciation +0.0/10.0
$220,000
🖨 Deal sheet (PDF) 📄 Offer letter ✓ Due diligence
Listing remarks MLS
This charmer in Morton Meadows is perfect for an investment opportunity or prime location for college students near Aksarben, UNO & UNMC! This is a well maintained 1.5-story home with large family room addition on a private, top-of-the-hill setting. The new triple-pane windows, water heater, and furnace makes this home move-in ready! Large non-conforming 4th bedroom below with potential for 2nd bath. Short walk to the park, grocery stores, post office, Beals Elementary, bars & restaurants. Schedule your showing today!
Key facts
- New siding
- Brand new roof
- Finished lower level
Tags
Property features AI
Finance
- Other: Living area reported as 1,640 total with 1,440 above grade and 200 below grade finished
Exterior
- Parking: Attached garage (1 covered space, 1 parking total)
- Utilities: Public water; Public sewer
- Home design: Single-family residence; One and one-half levels; Built in 1941; Not new / not a model; Below-grade finished area included
- Construction: Block foundation
- Exterior features: Patio; Partial fencing; Lot approximately 0.16 acre (about 142 x 50)
Interior
- Kitchen: Range; Refrigerator; Freezer; Dishwasher; Microwave
- Bedrooms: Master bedroom on main floor; Second bedroom on main floor; Third bedroom on second floor
- Bathrooms: One full bathroom (main level)
- Heating & cooling: Natural gas forced-air heating; Central air conditioning
- Interior features: Partial basement; No fireplaces
Neighborhood map
What this means for you Summary
Snapshot
- This is a 3-bed/1.0-bath other listed at $220k.
Deal economics
- At list price, monthly cash flow is $49 ($585/yr) — positive.
- The deal already cash-flows at list — no discount required.
- To meet the 1% rule (rent ≥ 1% of price), the offer needs to be $203k (7.7% below list).
- Recommended offer: $203k (7.7% below list) — sets the bar for 1% rule.
- Cap rate 6.6% vs local median 3.6% in Omaha — top-decile yield for the area; either an underpriced asset or a hidden risk that comps aren't pricing in. Stress-test before assuming the spread holds.
Location & tenants
- Location reads 84/100 on livability (#7 in NE, #663 nationally) — a professional / high-income tenant draw. Strengths: amenities A+, commute A+, cost of living A+; Watch: crime F.
- Omaha Public Schools (urban): math 20% / reading 28% proficiency, ranked #110 of 111 in NE (top 99%) — low school quality limits family demand, transient renter base, plan for 1-2y turnover; 62% free/reduced lunch — lower-income household profile, screen leases tightly.
- Zoned schools: Beals Elementary School (math 27% / reading 37%, grade F, #405 of 502 statewide, top 84%, 305 students, 0% FRL); Norris Middle School (math 11% / reading 16%, grade F, #126 of 128 statewide, top 98%, 1,187 students, 0% FRL); Central High School (math 29% / reading 40%, grade F, #208 of 261 statewide, top 86%, 2,738 students, 0% FRL) — zoned schools average 0% FRL vs 62% district-wide (62 pts lower); this property's tenant base skews higher-income than the district average.
- Market conditions: Rents rising fast (+4.3%/yr); 88 active listings in the ZIP; 40 comparable units currently listed for rent nearby; rentals at typical pace (median 26d on market — plan ~3-4 weeks tenant-placement turnaround); 4,539 units permitted in Douglas County in 2024 (2,583 in 5+ unit buildings).
- This rent runs 35% of the median local income ($70k/yr) — at the standard rent-burdened threshold; future hikes will face affordability resistance.
Forward outlook
- Local home prices are declining (-3.0%/yr); year-one equity from $2k of loan paydown is wiped out by about $7k of value loss. Plan a longer hold.
- Douglas County population projected at +28% by 2050 — long-run rental-demand tailwind backs the buy-and-hold thesis.
Negotiation context
- Only 1 days on market — expect competitive offers; lowballing is unlikely to land.
- 9 sale attempts since 25y ago with the ask held roughly flat each time — persistent listings suggest the price (not the market) is what's stuck; bring a comps-based counter.
- Current owner paid $167k; 32% above their basis — modest negotiation headroom, anchor on the comps not their cost.
Risks & watch-outs
- Watch-outs: built in 1941 — expect roof / HVAC / electrical / plumbing capex.
Questions for the listing agent
- Built in 1941 — when were the roof, HVAC, electrical panel, plumbing, and water heater last replaced?
- Is there a deadline driving the sale (1031 exchange, divorce, estate, relocation)? That informs how much negotiation room exists.
- Crime grade is F in this area — have there been break-ins, vandalism, or insurance claims at this property in the last 3 years? What carrier currently insures it and at what premium?
- The area grade is low — what's the realistic commute time and amenity access for the typical tenant pool here? Any planned neighborhood developments (good or bad) we should know about?
- What's the average days-on-market for RENTAL listings here right now (not sales)? A rising rental-DOM trend means longer vacancies and softer asking-rent achievability than the comps imply.
- What's the recent tenant-quality profile in this submarket — average credit score on applications, eviction rate, late-payment / NSF rate, and stable-employment percentage? A property-management company in the area should have these aggregated.
- How much new for-sale + rental construction is in the pipeline within 1–3 miles? Heavy new supply typically softens prices + rents 12–24 months out; constrained supply supports both.
Investment metrics
- 1% rule
- 0.92% ✗
- Cap rate
- 6.56%
- Cash-on-cash
- 0.95%
- DSCR
- 1.04
- GRM
- 9.0
CMA / ARV
No comps found within radius.
Projected returns pro-forma
-3.0% appreciation · 4.26% rent growth · sell at horizon
- IRR
- -13.3%
- Equity multiple
- 0.51×
- Total profit
- $-29,884
- Equity at exit
- $32,803
- IRR
- -2.5%
- Equity multiple
- 0.82×
- Total profit
- $-10,837
- Equity at exit
- $19,022
Cash invested: $61,600 (down + closing). Projections, not guarantees.
Landlord ↔ Tenant lean methodology
- Overall (STATE)
- 83 Strongly Landlord-Friendly
- State Nebraska
- 83 Strongly Landlord-Friendly · R+13
- County
- — inherits STATE
- City
- — inherits STATE
ZIP-level market 68106
- Rents YoY
- 4.3%
- Active inventory
- 88
- Price-to-rent
- 9.0×
Monthly cashflow live
- Estimated rent
- $2,030 high interval (Pro) →
- Mortgage (P&I)
- −$1,154
- Tax from tax record
- −$310 /mo · $3,719/yr
- Insurance
- −$92
- HOA
- −$0
- Vacancy / Maint / Mgmt
- −$426
- Net cashflow
- $49
Break-even live
Sensitivity live
| Price | -10% $173 | -5% $111 | +0% $49 | +5% $-13 | +10% $-76 |
|---|---|---|---|---|---|
| Rent | -10% $-112 | -5% $-31 | +0% $49 | +5% $129 | +10% $209 |
| Rate | -1.0pp $160 | -0.5pp $105 | base $49 | +0.5pp $-8 | +1.0pp $-66 |
UW: 25.0% down · 7.5% · 30yr · 1.5% tax · 5.0% vac · 8.0% maint · 8.0% mgmt
Financing live
Cash to close
- Down payment
- $55,000
- Closing costs
- $6,600
- Reserves months
- —
- Total cash needed
- —
Loan-product check · same deal, 3 products live
Conventional
25% down · 7.5% · 30yr
- Down + closing
- —
- Monthly P&I
- —
- Monthly cashflow
- —
- DSCR
- —
- Eligible?
- —
Personal DTI + credit; lowest rate.
DSCR
20% down · 8.5% · 30yr
- Down + closing
- —
- Monthly P&I
- —
- Monthly cashflow
- —
- DSCR
- —
- Eligible?
- —
No personal income docs; deal must DSCR.
Hard money
10% down · 12.0% · 12mo
- Down + closing
- —
- Monthly P&I
- —
- Monthly cashflow
- —
- DSCR
- —
- Eligible?
- —
Short-term bridge; refi at stabilization.
Rent comps 40 comps
| Address | Beds | Baths | Sqft | Rent | $/sqft | DOM | Units | Dist |
|---|---|---|---|---|---|---|---|---|
| 4844 Hickory St Omaha, NE | 3.0 | 1.5 | 1575 | $2,100 | $1.33 | 25d | 1 | 0.14mi |
| 4841 Pierce St Omaha, NE | 3.0 | 1.0 | 1350 | $2,000 | $1.48 | 5d | 1 | 0.29mi |
| 5136 Poppleton Ave Omaha, NE | 2.0 | 1.5 | 1440 | $1,600 | $1.11 | 13d | 1 | 0.30mi |
| 5132 Poppleton Ave Unit 5136 Omaha, NE | 2.0 | 1.5 | 1440 | $1,600 | $1.11 | 13d | 1 | 0.32mi |
| 5156 Pierce St Omaha, NE | 3.0 | 1.5 | 1400 | $1,695 | $1.21 | 45d | 1 | 0.36mi |
| 2132 S 48th Ave Omaha, NE | 3.0 | 2.0 | 1849 | $1,900 | $1.03 | 5d | 1 | 0.40mi |
| 2130 S 47th St Omaha, NE | 4.0 | 2.0 | 1270 | $2,100 | $1.65 | 45d | 1 | 0.46mi |
| 5518 Woolworth Ave Omaha, NE | 4.0 | 3.0 | 1765 | $2,700 | $1.53 | 13d | 1 | 0.47mi |
| 814 S 50th Ave Omaha, NE | 4.0 | 2.0 | 2239 | $3,000 | $1.34 | 45d | 1 | 0.55mi |
| 2001 S 60th St Omaha, NE | 3.0 | 2.0 | 1965 | $2,095 | $1.07 | 16d | 1 | 0.78mi |
| 4207 Barker Ave Omaha, NE | 3.0 | 1.0 | 1200 | $1,595 | $1.33 | 45d | 1 | 0.83mi |
| 4228 Mayberry St Omaha, NE | 4.0 | 1.0 | 1664 | $1,700 | $1.02 | 16d | 1 | 0.84mi |
| 4535 Oak St Omaha, NE | 3.0 | 1.0 | 1200 | $1,385 | $1.15 | 45d | 1 | 0.86mi |
| 2115 S 61st St Omaha, NE | 3.0 | 2.0 | 1696 | $2,400 | $1.42 | 25d | 1 | 0.88mi |
| 519 S 56th St Omaha, NE | 3.0 | 2.0 | 1474 | $2,600 | $1.76 | 25d | 1 | 0.91mi |
| 4015 Marcy St Omaha, NE | 3.0 | 1.0 | 1238 | $1,695 | $1.37 | 16d | 1 | 0.96mi |
| 2130 S 61st Ave Omaha, NE | 3.0 | 2.0 | 2023 | $2,350 | $1.16 | 5d | 1 | 0.98mi |
| 4623 Douglas St Omaha, NE | 3.0 | 2.0 | 1510 | $1,750 | $1.16 | 23d | 1 | 1.05mi |
| 3940 Arbor St Omaha, NE | 3.0 | 1.0 | 1316 | $1,800 | $1.37 | 45d | 1 | 1.06mi |
| 4647 Dodge St Omaha, NE | 2.0 | 1.0–2.0 | 775 | $2,850 | $3.68 | 25d | 32 | 1.10mi |
| 2225 S 64th Plz Omaha, NE | 2.0 | 1.0–2.0 | 905 | $2,795 | $3.09 | 4d | 30 | 1.14mi |
| 201 N 46th St Omaha, NE | 2.0 | 1.0–2.0 | 825 | $1,895 | $2.30 | 5d | 40 | 1.19mi |
| 4216 Vinton St Unit 4220 VINTON Omaha, NE | 2.0 | 1.0 | 1300 | $1,675 | $1.29 | 16d | 1 | 1.21mi |
| 5101 Grover St Unit 5633 Omaha, NE | 3.0 | 1.5 | 1200 | $1,695 | $1.41 | 45d | 1 | 1.21mi |
| 5101 Grover St Unit 5635 Omaha, NE | 3.0 | 2.0 | 1200 | $1,800 | $1.50 | 13d | 1 | 1.21mi |
| 3814 Leavenworth St Omaha, NE | 2.0 | 1.0–2.0 | 818 | $1,920 | $2.35 | 25d | 19 | 1.22mi |
| 4903 Chicago St Omaha, NE | 1.0–2.0 | 1.0–2.0 | 1100 | $1,250 | $1.14 | 23d | 1 | 1.25mi |
| 4817 Chicago St Unit 11 Omaha, NE | 2.0 | 1.0 | 1250 | $1,195 | $0.96 | 45d | 1 | 1.25mi |
| 1018 S 36th St Omaha, NE | 2.0 | 2.0 | 1462 | $2,700 | $1.85 | 45d | 1 | 1.27mi |
| 3919 Farnam St Unit 3915 Farnam Omaha, NE | 4.0 | 2.0 | 1700 | $2,350 | $1.38 | 45d | 1 | 1.30mi |
| 411 S 38th Ave Omaha, NE | 3.0 | 3.0 | 1872 | $1,995 | $1.07 | 45d | 1 | 1.36mi |
| 3601 Jones St Omaha, NE | 2.0 | 1.0–2.0 | 861 | $2,214 | $2.57 | 5d | 24 | 1.37mi |
| 617 S 37th St Omaha, NE | 1.0–2.0 | 1.0 | 845 | $1,285 | $1.52 | 12d | 8 | 1.38mi |
| 140 N 41st St Omaha, NE | 3.0 | 2.5 | 1640 | $2,495 | $1.52 | 45d | 1 | 1.39mi |
| 4918 California St Omaha, NE | 3.0 | 1.0 | 1369 | $1,695 | $1.24 | 25d | 1 | 1.40mi |
| 5016 California St #12 Omaha, NE | 2.0 | 2.0 | 1084 | $1,600 | $1.48 | 25d | 1 | 1.41mi |
| 120 N 40th St Omaha, NE | 3.0 | 1.0 | 1264 | $1,745 | $1.38 | 25d | 1 | 1.41mi |
| 535 S 37th St Omaha, NE | 1.0–2.0 | 1.0–2.0 | 1025 | $1,475 | $1.44 | 13d | 3 | 1.42mi |
| 120 N 39th St Omaha, NE | 2.0 | 1.0–2.0 | 808 | $2,375 | $2.94 | 5d | 46 | 1.44mi |
| 3804 Farnam St Omaha, NE | 2.0 | 1.0–2.0 | 973 | $1,622 | $1.67 | 16d | 2 | 1.44mi |
Listing history 2 events
-
2026-06-07remarks 699-char remark
-
2026-06-07$220,000 Pending 1 DOM
ⓘ Source: listings_history table (triggers on properties + properties_extension) + one-shot
backfill from property_details.listing_events for pre-trigger history.
Tax reassessment forecast NE · Resets to sale price
- Current annual tax
- $3,719 · $310/mo
- Projected year-2 tax
- $3,806 · $317/mo
- Expected delta
- +$87/yr (+$7/mo · 2.3%)
ⓘ Screening estimate from a state-policy table — verify with the county assessor before closing.
Climate risk First Street
- Flood 1/10 Low FEMA zone X (unshaded) · 0% chance over 30 yrs
- Wildfire 1/10 Low
- Heat 3/10 Moderate 7 d/yr ≥104°F today · 15 d/yr by 30 yrs out
- Wind 2/10 Low
- Air quality 2/10 Low 2 unhealthy d/yr today · 2 by 30 yrs out
Nearby sold comps map
Loading sold comps map…
Walkable amenities ~0.75 mi
Loading nearby amenities…
Taxation est. · year 1
- Rental income
- $24,365
- − Mortgage interest
- −$12,323
- − Property taxes
- −$3,719
- − Insurance
- −$1,100
- − Repairs & maintenance
- −$1,949
- − Management
- −$1,949
- − Depreciation
- −$6,400
- Taxable loss
- −$3,075
- Est. tax savings @ 24.0%
- +$738
- After-tax cash flow
- $1,323/yr
For passive investors: Depreciation is non-cash, so a rental often shows a tax loss while cash-flowing — sheltering income. Rental losses are passive: they offset passive income freely, and up to $25,000/yr can offset ordinary (W-2) income if you actively participate and your MAGI is under $100k (phasing out to $0 by $150k); unused losses carry forward. On sale, claimed depreciation is recaptured at up to 25%, and gains may owe capital-gains tax (a 1031 exchange can defer both). Figures are a year-1 estimate at your 24.0% rate — not tax advice; consult a CPA.
Schools (NCES district)
- District
- Omaha Public Schools
- NCES district ID
- 3174820
- Math proficiency
- 20% ▼ -10.00%
- Reading proficiency
- 28% ▼ -5.00%
- Median HH income
- $46,039
- Composite
- 20.83/100
- National rank
- #8502
- State rank
- #110 of 111 in NE
Livability — Omaha
- Score
- 84/100
- State rank
- #7
- US rank
- #663
Category grades
Schools grade is shown separately in the Schools card above.
Census & demographics
- Census place
- Omaha, NE
- County
- Douglas County · 538,646 people
- City population
- 552,986
- Metro
- Omaha-Council Bluffs, NE-IA
- Population (ZIP)
- 21,224
- Household income
- $69,806
- Rent vs Own
- Severe rent burden
- 1402.0
Population outlook (Douglas County) Hauer SSP2
- Today (2025)
- 625,245 people
- By 2030
- 661,613 · +5.8%
- By 2040
- 732,395 · +17.1%
- By 2050
- 801,988 · +28.3%
- By 2075
- 968,637 · +54.9%
- By 2100
- 1,101,871 · +76.2%
Race, ethnicity, and origin ACS 2023
- Neighborhood character
- Predominantly White (72%)
- Race & ethnicity
- White 72% Hispanic / Latino 13% Two or more races 8% Black 7% Asian 3% Native American 1%
- Hispanic origin (detail)
- Mexican 9%
- Common ancestry
- Romanian 4% Slovak 2% Portuguese 2%
- Foreign-born
- 11% · Canada, United Kingdom, Jamaica
- Languages at home
- 84% English-only · Spanish 9% Other Indo-European 2% French/Haitian/Cajun 1%
Political lean MEDSL · Douglas
- 2024 margin
- D (+10.2) · D 54.4% · R 44.2% · Other 1.4%
- 2008→2024 swing
- +5.5pp toward D · 2008: 4.6pp · 2024: 10.2pp
- All cycles
- 2024: D+10.2 2020: D+11.3 2016: D+1.4 2012: R+4.3 2008: D+4.6
Not yet ingested
- Civics
- —
Market trends
- HPI YoY
- ▼ -268.80%
- Current HPI
- 261.1403
- Rent YoY
- ▲ 4.26%
- Metro
- Omaha-Council Bluffs, NE-IA
- State GDP YoY
- ▲ 0.68%
- F500 in state
- 2
Industry mix (Fortune 500 HQ in NE)
| Industry | F500 HQs | Revenue |
|---|---|---|
| Conglomerate | 1 | $371B |
|
||
Price history
+134.8% since first listed34 events — show timeline
- 2026-06-05 Pending — GPRMLS
- 2026-06-04 Listed $220,000 GPRMLS
- 2020-12-02 Sold (Public Records) $167,000 Public Records
- 2020-11-30 Sold (MLS) $167,000 GPRMLS
- 2020-10-06 Pending — GPRMLS
- 2020-10-05 Price Changed $164,000 GPRMLS
- 2020-09-30 Listed $169,000 GPRMLS
- 2018-11-28 Sold (Public Records) $134,000 Public Records
- 2018-11-26 Sold (MLS) $133,500 GPRMLS
- 2018-10-18 Pending — GPRMLS
- 2018-09-28 Price Changed $134,500 GPRMLS
- 2018-09-27 Relisted — GPRMLS
- 2018-09-18 Pending — GPRMLS
- 2018-07-26 Price Changed $138,500 GPRMLS
- 2018-07-13 Price Changed $142,500 GPRMLS
- 2018-07-12 Listed $142,000 GPRMLS
- 2018-07-10 Listing Removed — GPRMLS
- 2018-06-13 Price Changed $145,000 GPRMLS
- 2018-05-31 Listed $150,000 GPRMLS
- 2009-11-19 Sold (Public Records) $113,000 Public Records
- 2009-11-13 Sold (MLS) $112,950 GPRMLS
- 2009-10-01 Listing Removed — GPRMLS
- 2009-07-22 Listed $112,900 GPRMLS
- 2004-06-16 Sold (Public Records) $101,000 Public Records
- 2004-06-11 Sold (MLS) $101,000 GPRMLS
- 2004-05-07 Listing Removed — GPRMLS
- 2004-03-10 Listed $104,950 GPRMLS
- 2003-08-23 Sold (Public Records) $105,000 Public Records
- 2003-06-20 Sold (MLS) $105,000 GPRMLS
- 2003-05-31 Listing Removed — GPRMLS
- 2003-04-14 Listed $109,950 GPRMLS
- 2001-08-16 Sold (MLS) $90,000 GPRMLS
- 2001-07-18 Listing Removed — GPRMLS
- 2001-06-07 Listed $93,700 GPRMLS
Property tax history
+4.1%/yrLatest (2025): $3,719 · +15.5% YoY. Source: county tax records.
Cash-flow waterfall
monthlySold comps — $/sqft
last 12 mo · ≤1 miLoading sold comps…