 Multi-family
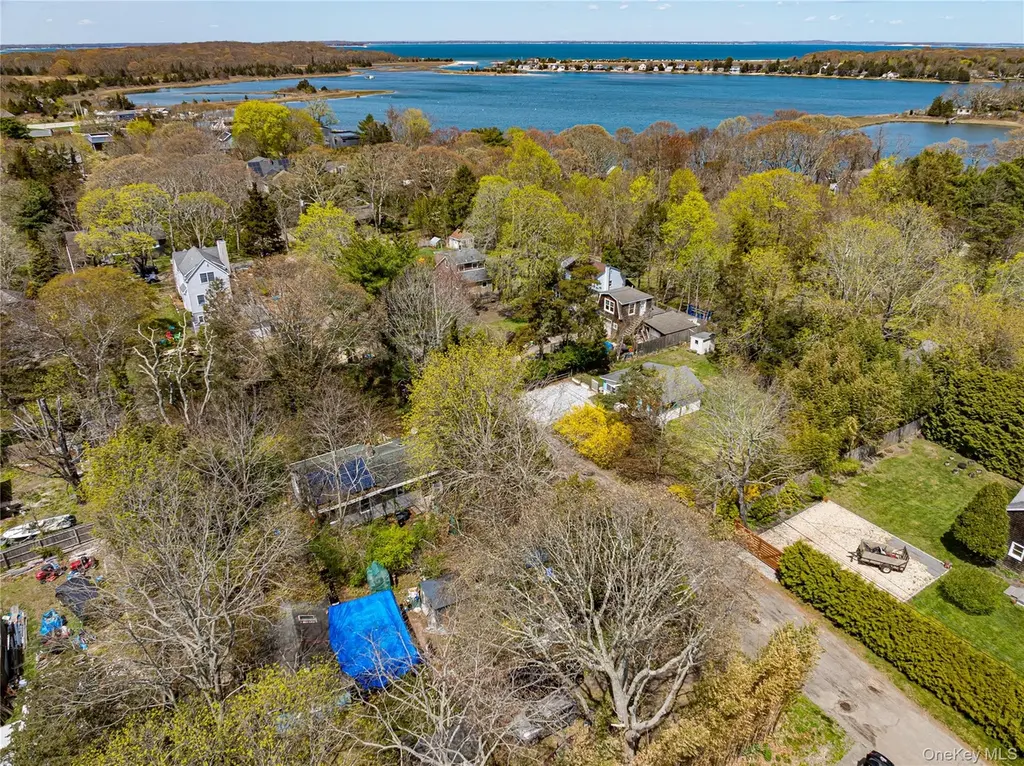
33 Locust Ave Unit 33 & 29 · North Sea, NY
Flood risk 1/10 · Minimal
- FEMA flood zone
- X (unshaded)
- Chance of flooding over 30 yrs
- 0.0%
- Est. flood insurance / yr
- $473 – $860
Fire risk 1/10 · Minimal
- Est. fire insurance / yr
- $691 – $1,283
Heat risk 5/10 · Moderate
- Hot days now (above 90°F)
- 7 days/yr
- Hot days in 30 yrs
- 20 days/yr
Wind risk 8/10 · Major
- Chance of severe wind over 30 yrs
- 80.0%
Air-quality risk 3/10 · Minor
- Unhealthy air days now
- 3 days/yr
- Unhealthy air days in 30 yrs
- 4 days/yr
Risk factors via First Street. Map © Google.
Why this score? — see what drove the B grade
The composite is a weighted blend of 9 inputs, each scored 0–100. Each bar is that input's sub-score; the figure is the points it added to the 100-point composite (weight × sub-score).
- Cash flow +30.0/30.0
- 1% rule +10.0/10.0
- DSCR +10.0/10.0
- ARV discount +7.5/15.0
- Rent growth +5.0/5.0
- Schools +4.8/10.0
- Livability +2.9/5.0
- Condition / age +1.0/5.0
- Appreciation +0.0/10.0
$1,199,999
🖨 Deal sheet 📄 Offer letter ✓ Due diligence
Multi-family units
County records classify this as Multi-Family (2-4 Unit). Listing-text estimate: 1 unit. estimate disagrees with records
Listing remarks
RARE OPPORTUNITY in North Sea – Hamlet of Southampton Located in an up-and-coming section of Southampton, this 0.51-acre property is designated as a legal two-family, the property currently includes two detached ranch-style homes, each offering 2–3 bedrooms, 1 bathroom, and a basement (in each home). Both homes are in need of renovation, presenting a true blank canvas for investors, builders, or end users looking to create something special. With ample space, the property can allow for the construction of even a new 2,500+ sq ft home with an in-ground pool, making it an ideal opportunity to maximize value. Property Highlights: • Legal two-family with R-10 zoning • Two
Key facts
- 0.51-acre parcel
- Detached homes
- Legal two-family
Tags
Property features AI
Exterior
- Parking: Driveway
- Utilities: Electricity connected; Water connected; Cesspool sewer; Solar energy generation
- Home design: Duplex; Fixer condition
- Construction: Frame construction; Block foundation
- Exterior features: Level lot; Chain link perimeter fencing; Not waterfront
Interior
- Bedrooms: Two 2-bedroom units
- Bathrooms: Two full bathrooms
- Heating & cooling: Oil heat; Wall/window air conditioning units
- Interior features: First-floor bedroom; First-floor full bath; Partial unfinished attic; Partial unfinished basement with Bilco doors
Neighborhood map
What this means for you Summary
Snapshot
- This is a 4-bed/2.0-bath multifamily listed at $1.20M. Condition is rated poor.
Deal economics
- At list price, monthly cash flow is $20k ($238k/yr) — positive.
- The deal already cash-flows at list — no discount required.
- Meets the 1% rule at list price ($36k rent vs $1.20M).
- Recommended offer: $1.16M (3.0% below list) — sets the bar for market timing.
- Cap rate 26.1% vs local median 6.5% in North Sea — top-decile yield for the area; either an underpriced asset or a hidden risk that comps aren't pricing in. Stress-test before assuming the spread holds.
Location & tenants
- Location reads 58/100 on livability (#1,063 in NY) — a working-class tenant base; expect higher turnover. Strengths: crime A+, employment A+; Watch: housing C-, amenities F, commute F.
- Southampton Union Free School District (suburban): math 53% / reading 51% proficiency, ranked #293 of 590 in NY (top 50%) — acceptable for families but not a draw, mixed tenant base, ~2y average lease.
- Zoned schools: Southampton Elementary School (math 42% / reading 57%, grade D, #1,085 of 2,108 statewide, top 56%, 376 students, 51% FRL); Southampton Intermediate School (math 30% / reading 47%, grade F, #437 of 729 statewide, top 60%, 363 students, 44% FRL); Southampton High School (math 98%, 595 students, 48% FRL) — zoned schools average 48% FRL vs 30% district-wide (17 pts higher); higher-poverty schools than district average — tighter screening recommended.
- Market conditions: Rents rising fast (+14.6%/yr); 95 active listings in the ZIP; 11 comparable units currently listed for rent nearby; rentals lingering (median 44d on market — plan ~5-8 weeks vacancy on turnover, expect pricing pressure); 55% of comp listings sitting > 30 days — soft ceiling on asking rent; high-income renter base; 1,366 units permitted in Suffolk County in 2024 (216 in 5+ unit buildings).
- At $35,616/mo this rent would consume 274% of the median local household income ($156k/yr) (locally 274% of renters already pay >50% of income on rent) — very limited rent-growth headroom before tenants either downsize or default.
Forward outlook
- Local home prices are declining (-3.0%/yr); year-one equity from $8k of loan paydown is wiped out by about $36k of value loss. Plan a longer hold.
- Suffolk County population projected to shrink 5% by 2050 — rents likely to lag national; underwrite the cash flow, not the appreciation.
- At projected returns (-3.0% appreciation + 8.0% rent growth), your $336k cash investment doubles in ~2 years — after that, you're playing with house money.
Negotiation context
- It's been on market 51 days — a 3% lower offer ($1.16M) is reasonable based on typical stale-listing flexibility.
Risks & watch-outs
- Climate carrying-cost: severe wind risk, 80% chance of damaging wind over 30y; extreme-heat days projected 7→20/yr by 2055 (HVAC capex compounding) — expect insurance premiums to compound above CPI over the hold.
Questions for the listing agent
- It's been on market 51 days. Have you received any prior offers? Is the seller open to a 3% concession, seller financing, or rate buy-down credit?
- Have any recent inspections been done? Can we get a copy of the seller's disclosures and any deferred-maintenance estimates?
- Is there a deadline driving the sale (1031 exchange, divorce, estate, relocation)? That informs how much negotiation room exists.
- Schools are D-rated, which usually means shorter tenancies and higher turnover. Who's the typical renter profile here, and what's been the actual vacancy rate?
- What's the average days-on-market for RENTAL listings here right now (not sales)? A rising rental-DOM trend means longer vacancies and softer asking-rent achievability than the comps imply.
- What's the recent tenant-quality profile in this submarket — average credit score on applications, eviction rate, late-payment / NSF rate, and stable-employment percentage? A property-management company in the area should have these aggregated.
- How much new apartment / multifamily construction is in the pipeline within 1–3 miles? Heavy new supply (>2% of stock underway) typically softens rents 12–24 months out; light construction supports rent growth.
Investment metrics
- 1% rule
- 2.97% ✓
- Cap rate
- 26.14%
- Cash-on-cash
- 70.87%
- DSCR
- 4.15
- GRM
- 2.8
CMA / ARV
No comps found within radius.
Projected returns pro-forma
-3.0% appreciation · 8.0% rent growth · sell at horizon
- IRR
- 76.1%
- Equity multiple
- 4.74×
- Total profit
- $1,258,152
- Equity at exit
- $178,924
- IRR
- 81.1%
- Equity multiple
- 11.66×
- Total profit
- $3,581,833
- Equity at exit
- $103,754
Cash invested: $336,000 (down + closing). Projections, not guarantees.
Landlord ↔ Tenant lean methodology
- Overall (STATE)
- 15 Strongly Tenant-Friendly
- State New York
- 15 Strongly Tenant-Friendly · D+10
- County
- — inherits STATE
- City
- — inherits STATE
ZIP-level market 11968
- Home prices YoY
- -28.6%
- Rents YoY
- 14.6%
- Active inventory
- 95
- Price-to-rent
- 2.8×
Monthly cashflow live
- Estimated rent
- $35,616 high interval (Pro) →
- Mortgage (P&I)
- −$6,293
- Tax est. 1.5%
- −$1,500 /mo · $18,000/yr
- Insurance
- −$500
- HOA
- −$0
- Vacancy / Maint / Mgmt
- −$7,479
- Net cashflow
- $19,844
Break-even live
UW: 25.0% down · 7.5% · 30yr · 1.5% tax · 5.0% vac · 8.0% maint · 8.0% mgmt
Financing live
Cash to close
- Down payment
- $300,000
- Closing costs
- $36,000
- Reserves months
- —
- Total cash needed
- —
Loan-product check · same deal, 3 products live
Conventional
25% down · 7.5% · 30yr
- Down + closing
- —
- Monthly P&I
- —
- Monthly cashflow
- —
- DSCR
- —
- Eligible?
- —
Personal DTI + credit; lowest rate.
DSCR
20% down · 8.5% · 30yr
- Down + closing
- —
- Monthly P&I
- —
- Monthly cashflow
- —
- DSCR
- —
- Eligible?
- —
No personal income docs; deal must DSCR.
Hard money
10% down · 12.0% · 12mo
- Down + closing
- —
- Monthly P&I
- —
- Monthly cashflow
- —
- DSCR
- —
- Eligible?
- —
Short-term bridge; refi at stabilization.
Rent comps 11 comps
| Address | Beds | Baths | Sqft | Rent | $/sqft | DOM | Units | Dist |
|---|---|---|---|---|---|---|---|---|
| 30 Old Fish Cove Rd Unit 1512341P Southampton, NY | 4.0 | 3.5 | 2497 | $25,322 | $10.14 | 22d | 1 | 0.19mi |
| 14 Millstone Dr Unit 1520127P Southampton, NY | 4.0 | 2.0 | 1722 | $18,488 | $10.74 | 22d | 1 | 0.46mi |
| 62 Waters Edge Rd Southampton, NY | 4.0 | 3.0 | 3100 | $20,000 | $6.45 | 11d | 1 | 0.66mi |
| 286 Towd Point Rd Southampton, NY | 4.0 | 3.0 | 1825 | $30,000 | $16.44 | 43d | 1 | 0.68mi |
| 18 Knoll Rd Southampton, NY | 3.0 | 2.5 | 3200 | $40,000 | $12.50 | 22d | 1 | 0.74mi |
| 624 Noyack Rd Southampton, NY | 5.0 | 3.0 | 2600 | $6,000 | $2.31 | 43d | 1 | 0.78mi |
| 29 Missapoque Ave Southampton, NY | 4.0 | 2.0 | 1934 | $8,000 | $4.14 | 43d | 1 | 0.91mi |
| 15 Lake View Ct Southampton, NY | 3.0 | 2.5 | 1800 | $15,000 | $8.33 | 43d | 1 | 1.10mi |
| 278 Big Fresh Pond Rd Southampton, NY | 3.0 | 1.5 | 1400 | $35,000 | $25.00 | 24d | 1 | 1.18mi |
| 99 Turtle Cove Dr Southampton, NY | 3.0 | 1.0 | 2205 | $45,000 | $20.41 | 43d | 1 | 1.35mi |
| 175 Warfield Way Southampton, NY | 3.0 | 2.0 | 1572 | $22,000 | $13.99 | 43d | 1 | 1.40mi |
Listing history 15 events
-
2026-06-18days on market $1,199,999 Active 51 DOM
-
2026-06-17days on market $1,199,999 Active 50 DOM
-
2026-06-16days on market $1,199,999 Active 49 DOM
-
2026-06-15days on market $1,199,999 Active 48 DOM
-
2026-06-13days on market $1,199,999 Active 46 DOM
-
2026-06-13days on market $1,199,999 Active 45 DOM
-
2026-06-09days on market $1,199,999 Active 42 DOM
-
2026-06-08days on market $1,199,999 Active 41 DOM
-
2026-06-07days on market $1,199,999 Active 40 DOM
-
2026-06-04days on market $1,199,999 Active 37 DOM
-
2026-06-03days on market $1,199,999 Active 36 DOM
-
2026-06-02days on market $1,199,999 Active 35 DOM
-
2026-06-01days on market $1,199,999 Active 34 DOM
-
2026-05-31days on market $1,199,999 Active 33 DOM
-
2026-03-31$1,199,999 Active 1140-char remark
ⓘ Source: listings_history table (triggers on properties + properties_extension) + one-shot
backfill from property_details.listing_events for pre-trigger history.
Climate risk First Street
- Flood 1/10 Low FEMA zone X (unshaded) · 0% chance over 30 yrs
- Wildfire 1/10 Low
- Heat 5/10 Major 7 d/yr ≥90°F today · 20 d/yr by 30 yrs out
- Wind 8/10 Severe 80% chance of damaging wind over 30 yrs
- Air quality 3/10 Moderate 3 unhealthy d/yr today · 4 by 30 yrs out
Nearby sold comps map
Loading sold comps map…
Walkable amenities ~0.75 mi
Loading nearby amenities…
Taxation est. · year 1
- Rental income
- $427,389
- − Mortgage interest
- −$67,219
- − Property taxes
- −$18,000
- − Insurance
- −$6,000
- − Repairs & maintenance
- −$34,191
- − Management
- −$34,191
- − Depreciation
- −$34,909
- Taxable income
- $232,879
- Est. tax owed @ 24.0%
- −$55,891
- After-tax cash flow
- $182,231/yr
For passive investors: Depreciation is non-cash, so a rental often shows a tax loss while cash-flowing — sheltering income. Rental losses are passive: they offset passive income freely, and up to $25,000/yr can offset ordinary (W-2) income if you actively participate and your MAGI is under $100k (phasing out to $0 by $150k); unused losses carry forward. On sale, claimed depreciation is recaptured at up to 25%, and gains may owe capital-gains tax (a 1031 exchange can defer both). Figures are a year-1 estimate at your 24.0% rate — not tax advice; consult a CPA.
Condition & rehab AI · 12 photos
This property requires extensive renovation, including roof replacement, exterior siding repair, and interior restoration, to become move-in ready and significantly increase its value.
Repairs flagged
- Major roof — Severe damage to shingles
- Major exterior siding — Damaged and peeling
- Major interior walls/paint — No interior walls or paint visible
- Major bathrooms — No bathrooms visible
- Major kitchen — No kitchen visible
- Major systems — No systems visible
- Major landscaping/curb appeal — Overgrown vegetation, debris scattered
Value-add opportunities
- Both Roof replacement — Critical safety and aesthetic issue
- Both Exterior siding repair/replacement — Improves curb appeal and structural integrity
- Both Interior wall and paint restoration — Enhances living space and value
- Both Bathroom and kitchen renovation — Essential for functionality and value
- Both Landscaping and curb appeal improvements — Enhances property's visual appeal and value
Renovation cost estimate screening
| Repair item | Severity | Est. cost |
|---|---|---|
| roof · Severe damage to shingles | Major | $15,000–50,000 |
| exterior siding · Damaged and peeling | Major | $15,000–50,000 |
| interior walls/paint · No interior walls or paint visible | Major | $15,000–50,000 |
| bathrooms · No bathrooms visible | Major | $15,000–50,000 |
| kitchen · No kitchen visible | Major | $15,000–50,000 |
| systems · No systems visible | Major | $15,000–50,000 |
| landscaping/curb appeal · Overgrown vegetation, debris scattered | Major | $15,000–50,000 |
| Total estimated repair cost · 7 items | $105,000–350,000 |
Value-add ROI direction
- Both Roof replacement — Critical safety and aesthetic issue ↑
- Both Exterior siding repair/replacement — Improves curb appeal and structural integrity ↑
- Both Interior wall and paint restoration — Enhances living space and value ↑
- Both Bathroom and kitchen renovation — Essential for functionality and value ↑
- Both Landscaping and curb appeal improvements — Enhances property's visual appeal and value ↑
ⓘ Cost ranges are severity-bucket heuristics (US national rule-of-thumb). Get contractor quotes + a written scope before underwriting a rehab budget.
Schools (NCES district)
- District
- Southampton Union Free School District
- NCES district ID
- 3627540
- Math proficiency
- 53% ▬ 0.00%
- Reading proficiency
- 51% ▲ 4.00%
- Median HH income
- $85,977
- Composite
- 47.9/100
- National rank
- #2213
- State rank
- #293 of 590 in NY
Livability — North Sea
- Score
- 58/100
- State rank
- #1063
- US rank
- #21178
Category grades
Schools grade is shown separately in the Schools card above.
Census & demographics
- Census place
- North Sea, NY
- County
- Suffolk County · 679,920 people
- Metro
- New York-Newark-Jersey City, NY-NJ-PA
- Population (ZIP)
- 15,312
- Household income
- $156,219
- Rent vs Own
- Severe rent burden
- 274.0
Population outlook (Suffolk County) Hauer SSP2
- Today (2025)
- 1,505,262 people
- By 2030
- 1,498,318 · -0.5%
- By 2040
- 1,471,101 · -2.3%
- By 2050
- 1,424,848 · -5.3%
- By 2075
- 1,337,157 · -11.2%
- By 2100
- 1,217,720 · -19.1%
Race, ethnicity, and origin ACS 2023
- Neighborhood character
- Predominantly White (71%)
- Race & ethnicity
- White 71% Hispanic / Latino 13% Two or more races 10% Black 9% Asian 3% Native American 2%
- Hispanic origin (detail)
- Mexican 3% Puerto Rican 2%
- Common ancestry
- Romanian 5% Scotch-Irish 2% Danish 2%
- Foreign-born
- 15% · Canada, Jamaica, Vietnam
- Languages at home
- 81% English-only · Spanish 11% Other Indo-European 3% German/W. Germanic 2%
Political lean MEDSL · Suffolk
- 2024 margin
- Lean R (+10.0) · D 45.0% · R 55.0%
- 2008→2024 swing
- -16.0pp toward R · 2008: 6.0pp · 2024: -10.0pp
- All cycles
- 2024: R+10.0 2020: R+0.0 2016: R+8.2 2012: D+2.9 2008: D+6.0
Not yet ingested
- Civics
- —
Market trends
- HPI YoY
- ▼ -184.86%
- Current HPI
- 461.1144
- Rent YoY
- ▲ 14.62%
- Metro
- New York-Newark-Jersey City, NY-NJ-PA
- State GDP YoY
- ▲ 2.60%
- F500 in state
- 92
Industry mix (Fortune 500 HQ in NY)
| Industry | F500 HQs | Revenue |
|---|---|---|
| Financial Services | 10 | $950B |
|
||
| Consumer Goods | 9 | $162B |
|
||
| Insurance | 4 | $225B |
|
||
| Telecommunications | 2 | $144B |
|
||
| Pharmaceuticals | 2 | $112B |
|
||
| Media / Entertainment | 2 | $69B |
|
||
Price history
1 event — show timeline
- 2026-03-31 Listed $1,199,999 OneKey® MLS as Distributed by MLS Grid
Cash-flow waterfall
monthlySold comps — $/sqft
last 12 mo · ≤1 miLoading sold comps…