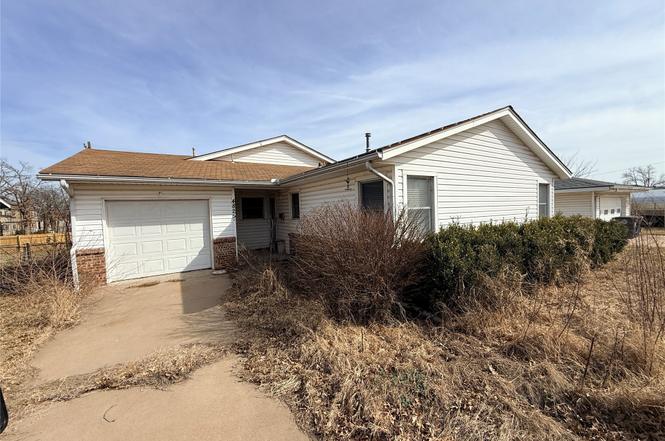
4825 S Lawton Ave · Tulsa, OK
Flood risk 1/10 · Minimal
- FEMA flood zone
- X (unshaded)
- Chance of flooding over 30 yrs
- 0.0%
- Est. flood insurance / yr
- $507 – $1,088
Fire risk 4/10 · Minor
- Est. fire insurance / yr
- $2,463 – $4,575
Heat risk 6/10 · Moderate
- Hot days now (above 111°F)
- 7 days/yr
- Hot days in 30 yrs
- 18 days/yr
Wind risk 3/10 · Minor
- Chance of severe wind over 30 yrs
- 4.0%
Air-quality risk 3/10 · Minor
- Unhealthy air days now
- 2 days/yr
- Unhealthy air days in 30 yrs
- 3 days/yr
Risk factors via First Street. Map © Google.
Why this score? — see what drove the C+ grade
The composite is a weighted blend of 9 inputs, each scored 0–100. Each bar is that input's sub-score; the figure is the points it added to the 100-point composite (weight × sub-score).
- Cash flow +25.1/30.0
- ARV discount +15.0/15.0
- DSCR +8.2/10.0
- 1% rule +6.1/10.0
- Livability +3.8/5.0
- Rent growth +2.7/5.0
- Condition / age +2.5/5.0
- Schools +0.8/10.0
- Appreciation +0.0/10.0
$159,000
🖨 Deal sheet 📄 Offer letter ✓ Due diligence
Listing remarks
Great investment to fix up for your first home! This one has 3 bedrooms plus a bonus room not added into sqft, 2 full bathrooms, 2 living rooms, 1 car garage, HUGE nice outdoor storm shelter, and shed in the spacious backyard! Lots of square footage for you to make your own! True original wood flooring in the bedrooms and front living room. Engineered flooring in the second living room with stone wood-burning fireplace and lovely natural light from the windows. The 2 living rooms are divided by French doors. IT HAS AN ADDITIONAL BONUS ROOM: You could easily expand the bonus room opening to the 2nd living room or leave it as is for an office/flex room. It has a exterior door and AC window un
Key facts
- Spacious backyard
- Bonus room
- French doors
Tags
Property features AI
Exterior
- Parking: Attached garage with workshop area; Carport
- Security: Smoke detector(s); No safety shelter
- Utilities: Public water; Public sewer; Electricity available; Natural gas available; Cable available
- Home design: Single-story home; Faces west; Crawlspace foundation
- Construction: Vinyl siding with wood frame construction; Asphalt/fiberglass roof
- Exterior features: Concrete driveway; Covered porch; Deck; Shed(s); Mature trees on lot; Partial and full fencing
Interior
- Kitchen: Range; Dishwasher
- Bedrooms: Multiple first-floor bedrooms (bedrooms without private baths)
- Flooring: Vinyl flooring; Wood and wood veneer flooring
- Bathrooms: One full bathroom with bathtub (hall bath); One half bathroom connected to master
- Heating & cooling: Central heating (gas); Central air conditioning
- Interior features: Ceiling fan(s); Laminate counters; Vinyl window frames
- Laundry & utility: Washer hookup; Utility room accessible from garage
Neighborhood map
What this means for you Summary
Snapshot
- This is a 3-bed/2.0-bath single-family listed at $159k.
Deal economics
- At list price, monthly cash flow is $351 ($4k/yr) — positive.
- The deal already cash-flows at list — no discount required.
- Meets the 1% rule at list price ($2k rent vs $159k).
- Recommended offer: $149k (6.0% below list) — sets the bar for market timing.
- Cap rate 8.9% vs local median 3.9% in Tulsa — top-decile yield for the area; either an underpriced asset or a hidden risk that comps aren't pricing in. Stress-test before assuming the spread holds.
Location & tenants
- Location reads 75/100 on livability (#13 in OK, #4,058 nationally) — a middle-class / working-renter tenant base. Strengths: amenities A+, commute A+, cost of living A+; Watch: schools F, crime F, employment D-.
- Tulsa (urban): math 7% / reading 12% proficiency, ranked #250 of 270 in OK (top 93%) — low school quality limits family demand, transient renter base, plan for 1-2y turnover; 76% free/reduced lunch — lower-income household profile, screen leases tightly.
- Market conditions: Rents flat; 99 active listings in the ZIP; 5 comparable units currently listed for rent nearby; rentals at typical pace (median 24d on market — plan ~3-4 weeks tenant-placement turnaround); 2,818 units permitted in Tulsa County in 2024 (518 in 5+ unit buildings).
- This rent runs 39% of the median local income ($54k/yr) — at the standard rent-burdened threshold; future hikes will face affordability resistance.
Forward outlook
- Local home prices are declining (-3.0%/yr); year-one equity from $1k of loan paydown is wiped out by about $5k of value loss. Plan a longer hold.
- Tulsa County population projected at +30% by 2050 — long-run rental-demand tailwind backs the buy-and-hold thesis.
Negotiation context
- It's been on market 72 days — a 6% lower offer ($149k) is reasonable based on typical stale-listing flexibility.
- 3 sale attempts since 11y ago; this cycle's ask is 28% above the opening price — seller raised mid-cycle; expect resistance to lowballs.
- Current owner paid $93k; list at $159k implies a 71% gain — meaningful room to come down on a strong offer.
Risks & watch-outs
- Watch-outs: built in 1956 — expect roof / HVAC / electrical / plumbing capex.
- Climate carrying-cost: extreme-heat days projected 7→18/yr by 2055 (HVAC capex compounding) — expect insurance premiums to compound above CPI over the hold.
Questions for the listing agent
- It's been on market 72 days. Have you received any prior offers? Is the seller open to a 6% concession, seller financing, or rate buy-down credit?
- Built in 1956 — when were the roof, HVAC, electrical panel, plumbing, and water heater last replaced?
- Why hasn't it sold? Are there any deal-killer items the seller is aware of (foundation, flood, title, zoning, code violations)?
- Is there a deadline driving the sale (1031 exchange, divorce, estate, relocation)? That informs how much negotiation room exists.
- Schools are F-rated, which usually means shorter tenancies and higher turnover. Who's the typical renter profile here, and what's been the actual vacancy rate?
- Crime grade is F in this area — have there been break-ins, vandalism, or insurance claims at this property in the last 3 years? What carrier currently insures it and at what premium?
- What's the average days-on-market for RENTAL listings here right now (not sales)? A rising rental-DOM trend means longer vacancies and softer asking-rent achievability than the comps imply.
- What's the recent tenant-quality profile in this submarket — average credit score on applications, eviction rate, late-payment / NSF rate, and stable-employment percentage? A property-management company in the area should have these aggregated.
- How much new for-sale + rental construction is in the pipeline within 1–3 miles? Heavy new supply typically softens prices + rents 12–24 months out; constrained supply supports both.
Investment metrics
- 1% rule
- 1.11% ✓
- Cap rate
- 8.94%
- Cash-on-cash
- 9.45%
- DSCR
- 1.42
- GRM
- 7.5
CMA / ARV
- ARV (on-the-fly)
- $226,848
- Comps found
- 5
Show comp detail 5 sales within ~0.75 mi
| Address | Dist | Beds/Ba | Sqft | Sold | Price | $/sf | Match |
|---|---|---|---|---|---|---|---|
| 4939 S Olympia Ave | 0.30mi | 3/2.0 | 1,650 (-1%) | 3mo | $225,000 | $136 | 82 |
| 1315 W 49th St | 0.40mi | 2/2.0 (-1) | 1,540 (-8%) | 0mo | $176,000 | $114 | 63 |
| 4747 S Santa Fe Ave | 0.43mi | 3/2.0 | 1,487 (-11%) | 3mo | $223,000 | $150 | 60 |
| 4946 S Olympia Ave | 0.32mi | 3/1.5 | 1,516 (-9%) | 14mo | $185,000 | $122 | 56 |
| 4745 S Santa Fe Ave | 0.42mi | 3/2.0 | 1,433 (-14%) | 19mo | $210,000 | $147 | 41 |
Match score weights: distance 35% · size 25% · config 20% · recency 20%. Top-matched comps best support the ARV.
Projected returns pro-forma
-3.0% appreciation · 0.78% rent growth · sell at horizon
- IRR
- -4.5%
- Equity multiple
- 0.84×
- Total profit
- $-7,291
- Equity at exit
- $23,707
- IRR
- 2.5%
- Equity multiple
- 1.16×
- Total profit
- $7,274
- Equity at exit
- $13,747
Cash invested: $44,520 (down + closing). Projections, not guarantees.
Landlord ↔ Tenant lean methodology
- Overall (STATE)
- 83 Strongly Landlord-Friendly
- State Oklahoma
- 83 Strongly Landlord-Friendly · R+20
- County
- — inherits STATE
- City
- — inherits STATE
ZIP-level market 74107
- Home prices YoY
- -15.3%
- Rents YoY
- 0.8%
- Active inventory
- 99
- Price-to-rent
- 7.5×
Monthly cashflow live
- Estimated rent
- $1,759 high interval (Pro) →
- Mortgage (P&I)
- −$834
- Tax from tax record
- −$139 /mo · $1,666/yr
- Insurance
- −$66
- HOA
- −$0
- Vacancy / Maint / Mgmt
- −$369
- Net cashflow
- $351
Break-even live
UW: 25.0% down · 7.5% · 30yr · 1.5% tax · 5.0% vac · 8.0% maint · 8.0% mgmt
Financing live
Cash to close
- Down payment
- $39,750
- Closing costs
- $4,770
- Reserves months
- —
- Total cash needed
- —
Loan-product check · same deal, 3 products live
Conventional
25% down · 7.5% · 30yr
- Down + closing
- —
- Monthly P&I
- —
- Monthly cashflow
- —
- DSCR
- —
- Eligible?
- —
Personal DTI + credit; lowest rate.
DSCR
20% down · 8.5% · 30yr
- Down + closing
- —
- Monthly P&I
- —
- Monthly cashflow
- —
- DSCR
- —
- Eligible?
- —
No personal income docs; deal must DSCR.
Hard money
10% down · 12.0% · 12mo
- Down + closing
- —
- Monthly P&I
- —
- Monthly cashflow
- —
- DSCR
- —
- Eligible?
- —
Short-term bridge; refi at stabilization.
Rent comps 5 comps
| Address | Beds | Baths | Sqft | Rent | $/sqft | DOM | Units | Dist |
|---|---|---|---|---|---|---|---|---|
| 1913 W 50th St Tulsa, OK | 3.0 | 2.0 | 1082 | $1,195 | $1.10 | 23d | 1 | 0.79mi |
| 1936 W 40th St Tulsa, OK | 2.0 | 2.0 | 1286 | $2,150 | $1.67 | 21d | 1 | 1.12mi |
| 4328 S 27th West Ave Tulsa, OK | 3.0 | 1.5 | 1606 | $1,650 | $1.03 | 23d | 1 | 1.27mi |
| 1115 E 48th Pl Tulsa, OK | 3.0 | 1.5 | 1195 | $1,500 | $1.26 | 23d | 1 | 1.30mi |
| 3773 Riverside Dr Tulsa, OK | 2.0 | 2.0 | 1786 | $3,400 | $1.90 | 21d | 1 | 1.41mi |
Listing history 23 events
-
2026-06-18days on market $159,000 Active 72 DOM
-
2026-06-17days on market $159,000 Active 71 DOM
-
2026-06-16days on market $159,000 Active 70 DOM
-
2026-06-15days on market $159,000 Active 69 DOM
-
2026-06-13days on market $159,000 Active 67 DOM
-
2026-06-10days on market $159,000 Active 64 DOM
-
2026-06-09days on market $159,000 Active 63 DOM
-
2026-06-08days on market $159,000 Active 62 DOM
-
2026-06-07days on market $159,000 Active 61 DOM
-
2026-06-05days on market $159,000 Active 58 DOM
-
2026-06-03days on market $159,000 Active 57 DOM
-
2026-06-02days on market $159,000 Active 56 DOM
-
2026-06-01days on market $159,000 Active 55 DOM
-
2026-05-31days on market $159,000 Active 54 DOM
-
2026-04-15status Active
-
2026-04-15price $159,000
-
2026-03-20status Pending
-
2026-03-11$124,000 Active
-
2018-01-31soldstatus $93,000
-
2015-12-09soldstatus $59,000
-
2015-10-28historical
-
2015-06-10$89,900 Active
-
2002-06-14soldstatus $72,000
ⓘ Source: listings_history table (triggers on properties + properties_extension) + one-shot
backfill from property_details.listing_events for pre-trigger history.
Tax reassessment forecast OK · Resets to sale price
- Current annual tax
- $1,666 · $139/mo
- Projected year-2 tax
- $1,666 · $139/mo
- Expected delta
- $0/yr ($0/mo · 0.0%)
ⓘ Screening estimate from a state-policy table — verify with the county assessor before closing.
Climate risk First Street
- Flood 1/10 Low FEMA zone X (unshaded) · 0% chance over 30 yrs
- Wildfire 4/10 Moderate
- Heat 6/10 Major 7 d/yr ≥111°F today · 18 d/yr by 30 yrs out
- Wind 3/10 Moderate 4% chance of damaging wind over 30 yrs
- Air quality 3/10 Moderate 2 unhealthy d/yr today · 3 by 30 yrs out
Nearby sold comps map
Loading sold comps map…
Walkable amenities ~0.75 mi
Loading nearby amenities…
Taxation est. · year 1
- Rental income
- $21,106
- − Mortgage interest
- −$8,906
- − Property taxes
- −$1,666
- − Insurance
- −$795
- − Repairs & maintenance
- −$1,688
- − Management
- −$1,688
- − Depreciation
- −$4,625
- Taxable income
- $1,736
- Est. tax owed @ 24.0%
- −$417
- After-tax cash flow
- $3,790/yr
For passive investors: Depreciation is non-cash, so a rental often shows a tax loss while cash-flowing — sheltering income. Rental losses are passive: they offset passive income freely, and up to $25,000/yr can offset ordinary (W-2) income if you actively participate and your MAGI is under $100k (phasing out to $0 by $150k); unused losses carry forward. On sale, claimed depreciation is recaptured at up to 25%, and gains may owe capital-gains tax (a 1031 exchange can defer both). Figures are a year-1 estimate at your 24.0% rate — not tax advice; consult a CPA.
Schools (NCES district)
- District
- Tulsa
- NCES district ID
- 4030240
- Math proficiency
- 7% ▼ -9.00%
- Reading proficiency
- 12% ▼ -7.00%
- Median HH income
- $37,895
- Composite
- 8.04/100
- National rank
- #9919
- State rank
- #250 of 270 in OK
Livability — Tulsa
- Score
- 75/100
- State rank
- #13
- US rank
- #4058
Category grades
Schools grade is shown separately in the Schools card above.
Census & demographics
- Census place
- Tulsa, OK
- County
- Tulsa County · 640,811 people
- City population
- 389,418
- Metro
- Tulsa, OK
- Population (ZIP)
- 19,013
- Household income
- $53,505
- Rent vs Own
- Severe rent burden
- 667.0
Population outlook (Tulsa County) Hauer SSP2
- Today (2025)
- 723,846 people
- By 2030
- 766,033 · +5.8%
- By 2040
- 851,386 · +17.6%
- By 2050
- 938,389 · +29.6%
- By 2075
- 1,166,011 · +61.1%
- By 2100
- 1,350,277 · +86.5%
Race, ethnicity, and origin ACS 2023
- Neighborhood character
- Diverse neighborhood (Simpson 0.63)
- Race & ethnicity
- White 59% Two or more races 18% Hispanic / Latino 11% Black 8% Native American 6% Pacific Islander 2% Asian 1%
- Hispanic origin (detail)
- Mexican 8% Puerto Rican 1%
- Common ancestry
- Lithuanian 2% Slovak 2% Italian 1%
- Foreign-born
- 4% · Canada
- Languages at home
- 90% English-only · Spanish 7% Other Asian/Pacific 2%
Political lean MEDSL · Tulsa
- 2024 margin
- R (+15.2) · D 41.3% · R 56.5% · Other 2.2%
- 2008→2024 swing
- +9.2pp toward D · 2008: -24.5pp · 2024: -15.2pp
- All cycles
- 2024: R+15.2 2020: R+15.6 2016: R+22.9 2012: R+27.4 2008: R+24.5
Not yet ingested
- Civics
- —
Market trends
- HPI YoY
- ▼ -42.46%
- Current HPI
- 235.2296
- Rent YoY
- ▲ 0.78%
- Metro
- Tulsa, OK
- State GDP YoY
- ▲ 1.55%
- F500 in state
- 6
Industry mix (Fortune 500 HQ in OK)
| Industry | F500 HQs | Revenue |
|---|---|---|
| Energy | 3 | $48B |
|
||
Price history
+120.8% since first listed9 events — show timeline
- 2026-04-15 Relisted — MLS Technology, Inc.
- 2026-04-15 Price Changed $159,000 MLS Technology, Inc.
- 2026-03-20 Pending — MLS Technology, Inc.
- 2026-03-11 Listed $124,000 MLS Technology, Inc.
- 2018-01-31 Sold (Public Records) $93,000 Public Records
- 2015-12-09 Sold (Public Records) $59,000 Public Records
- 2015-10-28 Listing Removed — MLS Technology, Inc.
- 2015-06-10 Listed $89,900 MLS Technology, Inc.
- 2002-06-14 Sold (Public Records) $72,000 Public Records
Property tax history
+4.1%/yrLatest (2025): $1,666 · +8.6% YoY. Source: county tax records.
Cash-flow waterfall
monthlySold comps — $/sqft
last 12 mo · ≤1 miLoading sold comps…