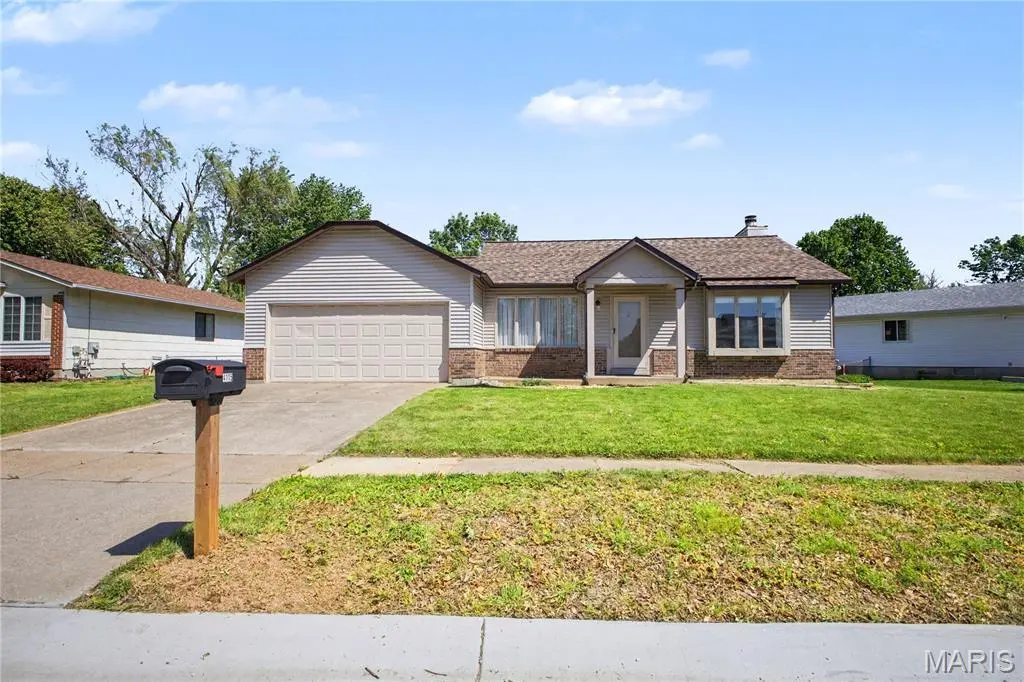
4115 Ninetieth Ave · Old Jamestown, MO
Flood risk 4/10 · Minor
- FEMA flood zone
- X (unshaded)
- Chance of flooding over 30 yrs
- 0.22%
- Est. flood insurance / yr
- $473 – $860
Fire risk 1/10 · Minimal
- Est. fire insurance / yr
- $1,054 – $1,958
Heat risk 5/10 · Moderate
- Hot days now (above 106°F)
- 7 days/yr
- Hot days in 30 yrs
- 21 days/yr
Wind risk 2/10 · Minimal
- Chance of severe wind over 30 yrs
- 1.0%
Air-quality risk 3/10 · Minor
- Unhealthy air days now
- 3 days/yr
- Unhealthy air days in 30 yrs
- 5 days/yr
Risk factors via First Street. Map © Google.
Why this score? — see what drove the C- grade
The composite is a weighted blend of 9 inputs, each scored 0–100. Each bar is that input's sub-score; the figure is the points it added to the 100-point composite (weight × sub-score).
- Cash flow +19.0/30.0
- ARV discount +12.6/15.0
- DSCR +6.0/10.0
- 1% rule +4.8/10.0
- Livability +3.3/5.0
- Rent growth +2.5/5.0
- Condition / age +2.5/5.0
- Schools +1.7/10.0
- Appreciation +0.0/10.0
$228,000
🖨 Deal sheet 📄 Offer letter ✓ Due diligence
Listing remarks
Welcome home! This charming 3-bedroom, 2-bath residence offers the space and versatility you’ve been seeking. Ample space is available in this great home, which includes - a cozy family room and a bonus den. The finished basement adds even more possibilities—think rec room, workout space, or hobby area. Step outside to a level yard perfect for gatherings, pets, or play. Complete with a 2-car garage, this home checks all the boxes! Seller to provide a Passed Occupancy Inspection.
Key facts
- 9,374 sq ft lot
- 2 garage spots
- Built 1979
Property features AI
Finance
- Other: Living area reported as 2,186; Above-grade finished area reported as 1,510
- Financial info: Lease not considered
Exterior
- Parking: Attached 2-car garage
- Utilities: Public water; Public sewer; Electric service (Ameren); Electricity, sewer and water connected
- Home design: Single-family residence; One-story house; Owner by contract
- Construction: Brick veneer and vinyl siding; House structure
- Exterior features: Level lot; Lot dimensions approximately 84 x 125 x 60 x 123
Interior
- Bedrooms: Three bedrooms on the main level
- Bathrooms: Two full bathrooms on the main level
- Heating & cooling: Forced air heating; Central air conditioning (electric)
- Interior features: Full basement; Living room fireplace
Neighborhood map
What this means for you Summary
Snapshot
- This is a 3-bed/2.0-bath single-family listed at $228k.
Deal economics
- At list price, monthly cash flow is $238 ($3k/yr) — positive.
- The deal already cash-flows at list — no discount required.
- To meet the 1% rule (rent ≥ 1% of price), the offer needs to be $224k (1.6% below list).
- Recommended offer: $221k (3.0% below list) — sets the bar for market timing.
- Cap rate 7.5% vs local median 5.3% in Old Jamestown — top-decile yield for the area; either an underpriced asset or a hidden risk that comps aren't pricing in. Stress-test before assuming the spread holds.
Location & tenants
- Location reads 66/100 on livability (#247 in MO) — a middle-class / working-renter tenant base. Strengths: employment A+, housing A+, cost of living A; Watch: amenities F, commute F, health & safety F.
- Hazelwood (suburban): math 11% / reading 26% proficiency, ranked #306 of 324 in MO (top 94%) — low school quality limits family demand, transient renter base, plan for 1-2y turnover.
- Zoned schools: Barrington Elem. (math 9% / reading 28%, grade F, #960 of 1,115 statewide, top 86%, 393 students, 53% FRL); Hazelwood Central High (math 12% / reading 33%, grade F, #455 of 521 statewide, top 88%, 1,628 students, 52% FRL) — zoned schools at 52% FRL track the district average.
- Market conditions: 70 active listings in the ZIP; 4 comparable units currently listed for rent nearby; rentals lingering (median 44d on market — plan ~5-8 weeks vacancy on turnover, expect pricing pressure); 75% of comp listings sitting > 30 days — soft ceiling on asking rent; solid renter incomes; 920 units permitted in St. Louis County in 2024 (250 in 5+ unit buildings).
Forward outlook
- Local home prices are declining (-3.0%/yr); year-one equity from $2k of loan paydown is wiped out by about $7k of value loss. Plan a longer hold.
Negotiation context
- It's been on market 56 days — a 3% lower offer ($221k) is reasonable based on typical stale-listing flexibility.
- 2 sale attempts with the ask held roughly flat each time — persistent listings suggest the price (not the market) is what's stuck; bring a comps-based counter.
- Current owner paid $66k; list at $228k implies a 245% gain — meaningful room to come down on a strong offer.
Risks & watch-outs
- Climate carrying-cost: extreme-heat days projected 7→21/yr by 2055 (HVAC capex compounding) — expect insurance premiums to compound above CPI over the hold.
Questions for the listing agent
- It's been on market 56 days. Have you received any prior offers? Is the seller open to a 3% concession, seller financing, or rate buy-down credit?
- Built in 1979 — when were the roof, HVAC, electrical panel, plumbing, and water heater last replaced?
- Is there a deadline driving the sale (1031 exchange, divorce, estate, relocation)? That informs how much negotiation room exists.
- What's the average days-on-market for RENTAL listings here right now (not sales)? A rising rental-DOM trend means longer vacancies and softer asking-rent achievability than the comps imply.
- What's the recent tenant-quality profile in this submarket — average credit score on applications, eviction rate, late-payment / NSF rate, and stable-employment percentage? A property-management company in the area should have these aggregated.
- How much new for-sale + rental construction is in the pipeline within 1–3 miles? Heavy new supply typically softens prices + rents 12–24 months out; constrained supply supports both.
Investment metrics
- 1% rule
- 0.98% ✗
- Cap rate
- 7.55%
- Cash-on-cash
- 4.48%
- DSCR
- 1.20
- GRM
- 8.5
CMA / ARV
- ARV (median comp)
- $257,435
- List price
- $228,000
- Delta
- -11.43%
- Verdict
- UNDERPRICED
- Comps
- 20 within 1.0 mi
Show comp detail 12 sales within ~0.75 mi
| Address | Dist | Beds/Ba | Sqft | Sold | Price | $/sf | Match |
|---|---|---|---|---|---|---|---|
| 15523 95th Ave | 0.18mi | 3/2.5 | 1,588 (+1%) | 1mo | $260,000 | $164 | 87 |
| 4028 Les Cherbourg Ln | 0.15mi | 3/2.0 | 1,537 (-2%) | 4mo | $250,000 | $163 | 87 |
| 628 Bugle Run Dr | 0.42mi | 3/2.0 | 1,627 (+4%) | 1mo | $250,000 | $154 | 73 |
| 620 Bugle Run Dr | 0.40mi | 3/2.0 | 1,629 (+4%) | 4mo | $265,000 | $163 | 71 |
| 14741 Mondoubleau Ln | 0.41mi | 3/2.0 | 1,491 (-5%) | 2mo | $239,000 | $160 | 71 |
| 4030 Tera Bera Dr | 0.42mi | 3/2.5 | 1,650 (+5%) | 0mo | $244,700 | $148 | 69 |
| 3906 Argonne Forest Dr | 0.72mi | 3/2.0 | 1,576 (+0%) | 1mo | $269,900 | $171 | 64 |
| 738 Waterfall Dr | 0.49mi | 3/2.0 | 1,495 (-5%) | 6mo | $265,000 | $177 | 64 |
| 3933 Arbre Ln | 0.60mi | 3/3.0 | 1,495 (-5%) | 4mo | $229,900 | $154 | 57 |
| 14663 Rouvre Dr | 0.71mi | 2/2.0 (-1) | 1,669 (+6%) | 3mo | $140,000 | $84 | 48 |
| 3365 Brunswick Dr | 0.67mi | 3/2.0 | 1,800 (+15%) | 1mo | $195,000 | $108 | 43 |
| 3929 Hirondelle Ln | 0.66mi | 3/2.5 | 1,391 (-11%) | 7mo | $215,000 | $155 | 43 |
Match score weights: distance 35% · size 25% · config 20% · recency 20%. Top-matched comps best support the ARV.
Projected returns pro-forma
-3.0% appreciation · 3.0% rent growth · sell at horizon
- IRR
- -9.3%
- Equity multiple
- 0.66×
- Total profit
- $-21,760
- Equity at exit
- $33,996
- IRR
- 0.1%
- Equity multiple
- 1.01×
- Total profit
- $628
- Equity at exit
- $19,713
Cash invested: $63,840 (down + closing). Projections, not guarantees.
Landlord ↔ Tenant lean methodology
- Overall (STATE)
- 81 Strongly Landlord-Friendly
- State Missouri
- 81 Strongly Landlord-Friendly · R+10
- County
- — inherits STATE
- City
- — inherits STATE
ZIP-level market 63034
- Active inventory
- 70
- Price-to-rent
- 8.5×
Monthly cashflow live
- Estimated rent
- $2,243 medium interval (Pro) →
- Mortgage (P&I)
- −$1,196
- Tax from tax record
- −$243 /mo · $2,916/yr
- Insurance
- −$95
- HOA
- −$0
- Vacancy / Maint / Mgmt
- −$471
- Net cashflow
- $238
Break-even live
UW: 25.0% down · 7.5% · 30yr · 1.5% tax · 5.0% vac · 8.0% maint · 8.0% mgmt
Financing live
Cash to close
- Down payment
- $57,000
- Closing costs
- $6,840
- Reserves months
- —
- Total cash needed
- —
Loan-product check · same deal, 3 products live
Conventional
25% down · 7.5% · 30yr
- Down + closing
- —
- Monthly P&I
- —
- Monthly cashflow
- —
- DSCR
- —
- Eligible?
- —
Personal DTI + credit; lowest rate.
DSCR
20% down · 8.5% · 30yr
- Down + closing
- —
- Monthly P&I
- —
- Monthly cashflow
- —
- DSCR
- —
- Eligible?
- —
No personal income docs; deal must DSCR.
Hard money
10% down · 12.0% · 12mo
- Down + closing
- —
- Monthly P&I
- —
- Monthly cashflow
- —
- DSCR
- —
- Eligible?
- —
Short-term bridge; refi at stabilization.
Rent comps 4 comps
| Address | Beds | Baths | Sqft | Rent | $/sqft | DOM | Units | Dist |
|---|---|---|---|---|---|---|---|---|
| 15686 93rd Ave Florissant, MO | 3.0 | 2.0 | 1370 | $1,948 | $1.42 | 12d | 1 | 0.25mi |
| 4112 Monsols Dr Florissant, MO | 3.0 | 2.0 | 1120 | $1,945 | $1.74 | 43d | 1 | 0.99mi |
| 13 Cricket Ct Florissant, MO | 4.0 | 3.0 | 1560 | $2,550 | $1.63 | 43d | 1 | 1.02mi |
| 3930 Belcroft Dr Florissant, MO | 3.0 | 3.0 | 1408 | $1,935 | $1.37 | 43d | 1 | 1.47mi |
Listing history 19 events
-
2026-06-18days on market $228,000 Active 56 DOM
-
2026-06-17days on market $228,000 Active 55 DOM
-
2026-06-16days on market $228,000 Active 54 DOM
-
2026-06-16price $228,000 Active 53 DOM
-
2026-06-15days on market $229,000 Active 53 DOM
-
2026-06-13days on market $229,000 Active 51 DOM
-
2026-06-13days on market $229,000 Active 50 DOM
-
2026-06-09days on market $229,000 Active 47 DOM
-
2026-06-08days on market $229,000 Active 46 DOM
-
2026-06-07days on market $229,000 Active 45 DOM
-
2026-06-05days on market $229,000 Active 42 DOM
-
2026-06-03days on market $229,000 Active 41 DOM
-
2026-06-02days on market $229,000 Active 40 DOM
-
2026-06-01days on market $229,000 Active 39 DOM
-
2026-05-31days on market $229,000 Active 38 DOM
-
2026-05-07historical Active Under Contract 446-char remark
-
2026-04-23$229,000 Active 446-char remark
-
2026-04-23historical $229,000 446-char remark
-
1980-09-01soldstatus $66,000
ⓘ Source: listings_history table (triggers on properties + properties_extension) + one-shot
backfill from property_details.listing_events for pre-trigger history.
Tax reassessment forecast MO · Resets to sale price
- Current annual tax
- $2,916 · $243/mo
- Projected year-2 tax
- $2,916 · $243/mo
- Expected delta
- $0/yr ($0/mo · 0.0%)
ⓘ Screening estimate from a state-policy table — verify with the county assessor before closing.
Climate risk First Street
- Flood 4/10 Moderate FEMA zone X (unshaded) · 22% chance over 30 yrs
- Wildfire 1/10 Low
- Heat 5/10 Major 7 d/yr ≥106°F today · 21 d/yr by 30 yrs out
- Wind 2/10 Low 100% chance of damaging wind over 30 yrs
- Air quality 3/10 Moderate 3 unhealthy d/yr today · 5 by 30 yrs out
Nearby sold comps map
Loading sold comps map…
Walkable amenities ~0.75 mi
Loading nearby amenities…
Taxation est. · year 1
- Rental income
- $26,916
- − Mortgage interest
- −$12,772
- − Property taxes
- −$2,916
- − Insurance
- −$1,140
- − Repairs & maintenance
- −$2,153
- − Management
- −$2,153
- − Depreciation
- −$6,633
- Taxable loss
- −$851
- Est. tax savings @ 24.0%
- +$204
- After-tax cash flow
- $3,064/yr
For passive investors: Depreciation is non-cash, so a rental often shows a tax loss while cash-flowing — sheltering income. Rental losses are passive: they offset passive income freely, and up to $25,000/yr can offset ordinary (W-2) income if you actively participate and your MAGI is under $100k (phasing out to $0 by $150k); unused losses carry forward. On sale, claimed depreciation is recaptured at up to 25%, and gains may owe capital-gains tax (a 1031 exchange can defer both). Figures are a year-1 estimate at your 24.0% rate — not tax advice; consult a CPA.
Schools (NCES district)
- District
- Hazelwood
- NCES district ID
- 2913830
- Math proficiency
- 11% ▼ -13.00%
- Reading proficiency
- 26% ▼ -6.00%
- Median HH income
- $51,621
- Composite
- 16.77/100
- National rank
- #9156
- State rank
- #306 of 324 in MO
Livability — Old Jamestown
- Score
- 66/100
- State rank
- #247
- US rank
- #12156
Category grades
Schools grade is shown separately in the Schools card above.
Census & demographics
- Census place
- Old Jamestown, MO
- County
- Saint Louis County · 888,823 people
- City population
- 19,557
- Metro
- St. Louis, MO-IL
- Population (ZIP)
- 18,908
- Household income
- $103,905
- Rent vs Own
- Severe rent burden
- 88.0
Population outlook (St. Louis County) Hauer SSP2
- Today (2025)
- 1,025,227 people
- By 2030
- 1,028,023 · +0.3%
- By 2040
- 1,020,940 · -0.4%
- By 2050
- 1,007,280 · -1.8%
- By 2075
- 987,277 · -3.7%
- By 2100
- 921,984 · -10.1%
Race, ethnicity, and origin ACS 2023
- Neighborhood character
- Predominantly Black (65%)
- Race & ethnicity
- Black 65% White 21% Two or more races 11% Hispanic / Latino 4% Asian 1%
- Common ancestry
- Swedish 1% Italian 1% Romanian 1%
- Foreign-born
- 5% · Canada, Vietnam
- Languages at home
- 95% English-only · Spanish 1% Vietnamese 1% Other Indo-European 1%
Political lean MEDSL · St. Louis
- 2024 margin
- Strong D (+23.4) · D 60.8% · R 37.4% · Other 1.7%
- 2008→2024 swing
- +3.5pp toward D · 2008: 19.9pp · 2024: 23.4pp
- All cycles
- 2024: D+23.4 2020: D+24.0 2016: D+16.2 2012: D+13.7 2008: D+19.9
Not yet ingested
- Civics
- —
Market trends
- HPI YoY
- ▼ -156.28%
- Current HPI
- 180.6267
- Rent YoY
- —
- Metro
- St. Louis, MO-IL
- State GDP YoY
- ▲ 1.84%
- F500 in state
- 20
Industry mix (Fortune 500 HQ in MO)
| Industry | F500 HQs | Revenue |
|---|---|---|
| Healthcare | 1 | $163B |
|
||
| Insurance | 1 | $21B |
|
||
| Industrial Technology | 1 | $17B |
|
||
| Retail | 1 | $16B |
|
||
| Industrial Distribution | 1 | $10B |
|
||
| Utilities | 1 | $9B |
|
||
Price history
+245.5% since first listed6 events — show timeline
- 2026-06-15 Price Changed $228,000 MARIS as Distributed by MLS Grid
- 2026-05-30 Relisted — MARIS as Distributed by MLS Grid
- 2026-05-07 Contingent — MARIS as Distributed by MLS Grid
- 2026-04-23 Listed $229,000 MARIS as Distributed by MLS Grid
- 2026-04-23 Coming Soon $229,000 MARIS as Distributed by MLS Grid
- 1980-09-01 Sold (Public Records) $66,000 Public Records
Property tax history
+3.4%/yrLatest (2022): $2,916 · +5.7% YoY. Source: county tax records.
Cash-flow waterfall
monthlySold comps — $/sqft
last 12 mo · ≤1 miLoading sold comps…