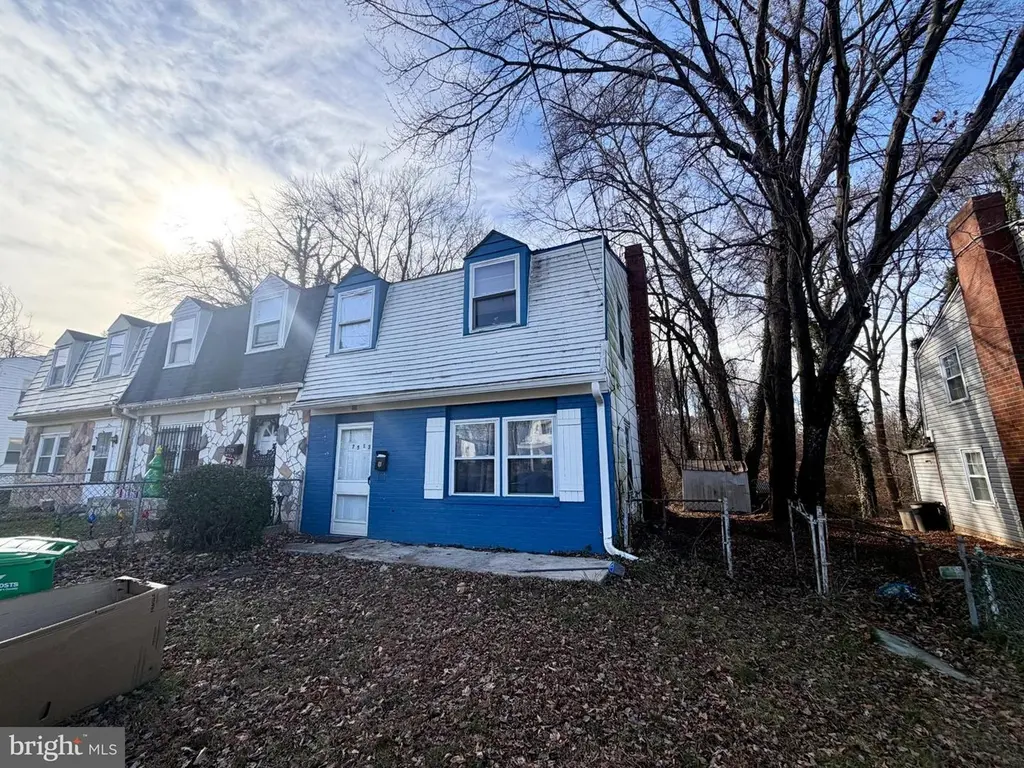
7513 Allendale Dr · Landover, MD
Flood risk 1/10 · Minimal
- FEMA flood zone
- X (unshaded)
- Chance of flooding over 30 yrs
- 0.0%
- Est. flood insurance / yr
- $507 – $1,088
Fire risk 1/10 · Minimal
- Est. fire insurance / yr
- $755 – $1,403
Heat risk 7/10 · Major
- Hot days now (above 103°F)
- 7 days/yr
- Hot days in 30 yrs
- 15 days/yr
Wind risk 4/10 · Minor
- Chance of severe wind over 30 yrs
- 20.0%
Air-quality risk 4/10 · Minor
- Unhealthy air days now
- 4 days/yr
- Unhealthy air days in 30 yrs
- 5 days/yr
Risk factors via First Street. Map © Google.
Why this score? — see what drove the C- grade
The composite is a weighted blend of 9 inputs, each scored 0–100. Each bar is that input's sub-score; the figure is the points it added to the 100-point composite (weight × sub-score).
- Cash flow +18.2/30.0
- ARV discount +15.0/15.0
- DSCR +5.7/10.0
- 1% rule +4.6/10.0
- Rent growth +3.6/5.0
- Livability +3.5/5.0
- Condition / age +2.5/5.0
- Schools +1.7/10.0
- Appreciation +0.0/10.0
$240,000
🖨 Deal sheet 📄 Offer letter ✓ Due diligence
Listing remarks MLS
NEW PRICE IMPROVEMENT! Calling all investors and renovation buyers! This end-unit townhome presents 1320 sq. ft. of untapped potential in a desirable neighborhood. With 3 bedrooms and 1 bathroom, this property is perfectly positioned for your value-add strategy.
Key facts
- Built 1959
- Listed 155 days
Neighborhood map
What this means for you Summary
Snapshot
- This is a 3-bed/1.5-bath townhouse listed at $240k.
Deal economics
- At list price, monthly cash flow is $216 ($3k/yr) — positive.
- The deal already cash-flows at list — no discount required.
- To meet the 1% rule (rent ≥ 1% of price), the offer needs to be $231k (3.9% below list).
- Recommended offer: $211k (12.0% below list) — sets the bar for market timing.
- Cap rate 7.4% vs local median 4.9% in Landover — top-decile yield for the area; either an underpriced asset or a hidden risk that comps aren't pricing in. Stress-test before assuming the spread holds.
Location & tenants
- Location reads 69/100 on livability (#194 in MD) — a middle-class / working-renter tenant base. Strengths: commute A+, housing A+; Watch: health & safety C-, schools F, crime F.
- Prince George'S County Public Schools (suburban): math 8% / reading 24% proficiency, ranked #21 of 24 in MD (top 88%) — low school quality limits family demand, transient renter base, plan for 1-2y turnover.
- Market conditions: Rents rising fast (+4.3%/yr); 133 active listings in the ZIP; 23 comparable units currently listed for rent nearby; rentals at typical pace (median 19d on market — plan ~3-4 weeks tenant-placement turnaround); solid renter incomes; 1,481 units permitted in Prince George's County in 2024 (0 in 5+ unit buildings).
- This rent runs 32% of the median local income ($86k/yr) — at the standard rent-burdened threshold; future hikes will face affordability resistance.
Forward outlook
- Local home prices are declining (-3.0%/yr); year-one equity from $2k of loan paydown is wiped out by about $7k of value loss. Plan a longer hold.
- Prince George's County population projected at +18% by 2050 — long-run rental-demand tailwind backs the buy-and-hold thesis.
Negotiation context
- It's been on market 155 days — a 12% lower offer ($211k) is reasonable based on typical stale-listing flexibility.
- 5 sale attempts since 22y ago; this cycle's ask has dropped $20k (8%) from the opening price — seller is motivated, your offer sets the floor, not the list.
- Current owner paid $148k; list at $240k implies a 62% gain — meaningful room to come down on a strong offer.
Risks & watch-outs
- Watch-outs: built in 1959 — expect roof / HVAC / electrical / plumbing capex.
- Climate carrying-cost: extreme-heat days projected 7→15/yr by 2055 (HVAC capex compounding) — expect insurance premiums to compound above CPI over the hold.
Questions for the listing agent
- It's been on market 155 days. Have you received any prior offers? Is the seller open to a 12% concession, seller financing, or rate buy-down credit?
- Built in 1959 — when were the roof, HVAC, electrical panel, plumbing, and water heater last replaced?
- Why hasn't it sold? Are there any deal-killer items the seller is aware of (foundation, flood, title, zoning, code violations)?
- Is there a deadline driving the sale (1031 exchange, divorce, estate, relocation)? That informs how much negotiation room exists.
- Schools are F-rated, which usually means shorter tenancies and higher turnover. Who's the typical renter profile here, and what's been the actual vacancy rate?
- Crime grade is F in this area — have there been break-ins, vandalism, or insurance claims at this property in the last 3 years? What carrier currently insures it and at what premium?
- What's the average days-on-market for RENTAL listings here right now (not sales)? A rising rental-DOM trend means longer vacancies and softer asking-rent achievability than the comps imply.
- What's the recent tenant-quality profile in this submarket — average credit score on applications, eviction rate, late-payment / NSF rate, and stable-employment percentage? A property-management company in the area should have these aggregated.
- How much new for-sale + rental construction is in the pipeline within 1–3 miles? Heavy new supply typically softens prices + rents 12–24 months out; constrained supply supports both.
Investment metrics
- 1% rule
- 0.96% ✗
- Cap rate
- 7.37%
- Cash-on-cash
- 3.85%
- DSCR
- 1.17
- GRM
- 8.7
CMA / ARV
- ARV (median comp)
- $310,263
- List price
- $240,000
- Delta
- -22.65%
- Verdict
- UNDERPRICED
- Comps
- 20 within 1.0 mi
Show comp detail 12 sales within ~0.75 mi
| Address | Dist | Beds/Ba | Sqft | Sold | Price | $/sf | Match |
|---|---|---|---|---|---|---|---|
| 7509 Allendale Dr | 0.02mi | 3/1.5 | 1,320 (0%) | 2mo | $208,000 | $158 | 97 |
| 7630 Allendale Dr | 0.14mi | 3/1.5 | 1,320 (0%) | 1mo | $325,000 | $246 | 92 |
| 7614 Allendale Dr | 0.10mi | 3/1.5 | 1,280 (-3%) | 4mo | $245,900 | $192 | 86 |
| 1780 Village Green Dr Unit C-68 | 0.20mi | 3/2.0 | 1,282 (-3%) | 4mo | $180,000 | $140 | 81 |
| 7615 Oxman Rd | 0.33mi | 3/2.0 | 1,274 (-4%) | 0mo | $330,000 | $259 | 77 |
| 1801 Cedarwood | 0.45mi | 3/2.0 | 1,300 (-2%) | 1mo | $362,000 | $278 | 74 |
| 1849 Village Green Dr | 0.16mi | 3/2.0 | 1,174 (-11%) | 1mo | $160,000 | $136 | 71 |
| 1732 Dutch Village Dr Unit N-369 | 0.20mi | 4/2.0 (+1) | 1,180 (-11%) | 1mo | $191,000 | $162 | 65 |
| 1825 Village Green Dr | 0.15mi | 4/2.0 (+1) | 1,171 (-11%) | 2mo | $236,900 | $202 | 65 |
| 1852 Village Green Dr Unit E-122 | 0.19mi | 4/2.0 (+1) | 1,180 (-11%) | 3mo | $230,000 | $195 | 64 |
| 8110 Sheriff Rd | 0.57mi | 3/1.5 | 1,188 (-10%) | 0mo | $280,000 | $236 | 56 |
| 1368 Nalley Ter | 0.54mi | 3/1.5 | 1,160 (-12%) | 1mo | $313,000 | $270 | 54 |
Match score weights: distance 35% · size 25% · config 20% · recency 20%. Top-matched comps best support the ARV.
Projected returns pro-forma
-3.0% appreciation · 4.3% rent growth · sell at horizon
- IRR
- -8.9%
- Equity multiple
- 0.67×
- Total profit
- $-22,102
- Equity at exit
- $35,785
- IRR
- 2.2%
- Equity multiple
- 1.17×
- Total profit
- $11,325
- Equity at exit
- $20,751
Cash invested: $67,200 (down + closing). Projections, not guarantees.
Landlord ↔ Tenant lean methodology
- Overall (STATE)
- 27 Tenant-Leaning
- State Maryland
- 27 Tenant-Leaning · D+14
- County
- — inherits STATE
- City
- — inherits STATE
ZIP-level market 20785
- Home prices YoY
- -30.4%
- Rents YoY
- 4.3%
- Active inventory
- 133
- Price-to-rent
- 8.7×
Monthly cashflow live
- Estimated rent
- $2,307 high interval (Pro) →
- Mortgage (P&I)
- −$1,259
- Tax from tax record
- −$249 /mo · $2,984/yr
- Insurance
- −$100
- HOA
- −$0
- Vacancy / Maint / Mgmt
- −$485
- Net cashflow
- $216
Break-even live
UW: 25.0% down · 7.5% · 30yr · 1.5% tax · 5.0% vac · 8.0% maint · 8.0% mgmt
Financing live
Cash to close
- Down payment
- $60,000
- Closing costs
- $7,200
- Reserves months
- —
- Total cash needed
- —
Loan-product check · same deal, 3 products live
Conventional
25% down · 7.5% · 30yr
- Down + closing
- —
- Monthly P&I
- —
- Monthly cashflow
- —
- DSCR
- —
- Eligible?
- —
Personal DTI + credit; lowest rate.
DSCR
20% down · 8.5% · 30yr
- Down + closing
- —
- Monthly P&I
- —
- Monthly cashflow
- —
- DSCR
- —
- Eligible?
- —
No personal income docs; deal must DSCR.
Hard money
10% down · 12.0% · 12mo
- Down + closing
- —
- Monthly P&I
- —
- Monthly cashflow
- —
- DSCR
- —
- Eligible?
- —
Short-term bridge; refi at stabilization.
Rent comps 23 comps
| Address | Beds | Baths | Sqft | Rent | $/sqft | DOM | Units | Dist |
|---|---|---|---|---|---|---|---|---|
| 7607 Burnside Rd Hyattsville, MD | 3.0 | 1.5 | 1280 | $2,200 | $1.72 | 43d | 1 | 0.05mi |
| 7714 Greymont St Hyattsville, MD | 3.0 | 1.5 | 1320 | $2,200 | $1.67 | 17d | 1 | 0.11mi |
| 7711 Burnside Rd Hyattsville, MD | 3.0 | 1.5 | 1320 | $2,200 | $1.67 | 18d | 1 | 0.11mi |
| 1846 Cedarwood Ct Hyattsville, MD | 3.0 | 2.5 | 1120 | $2,150 | $1.92 | 43d | 1 | 0.39mi |
| 2500 Markham Ln #5 Hyattsville, MD | 2.0 | 2.0 | 1028 | $2,000 | $1.95 | 24d | 1 | 0.54mi |
| 2014 E Marlboro Ave Hyattsville, MD | 1.0–3.0 | 1.0–2.0 | 987 | $1,874 | $1.90 | 1d | 2 | 0.56mi |
| 1741 Countrywood Ct Hyattsville, MD | 3.0 | 2.0 | 1312 | $2,295 | $1.75 | 24d | 1 | 0.58mi |
| 1746 Countrywood Ct Hyattsville, MD | 3.0 | 2.5 | 1296 | $2,450 | $1.89 | 11d | 1 | 0.58mi |
| 1127 Ivy Club Ln Hyattsville, MD | 1.0–2.0 | 1.0–2.0 | 826 | $1,999 | $2.42 | 2d | 7 | 0.73mi |
| 1842 Ryderwood Ct Hyattsville, MD | 4.0 | 3.5 | 1680 | $3,199 | $1.90 | 18d | 1 | 0.75mi |
| 2712 Red Oak Ln Glenarden, MD | 3.0 | 2.0 | 1200 | $2,400 | $2.00 | 18d | 1 | 0.79mi |
| 916 Portia Ct Hyattsville, MD | 3.0 | 2.5 | 1029 | $2,800 | $2.72 | 43d | 1 | 0.85mi |
| 3131 82nd Ave Hyattsville, MD | 3.0 | 1.0 | 962 | $1,450 | $1.51 | 43d | 1 | 0.88mi |
| 3119 75th Ave Hyattsville, MD | 2.0 | 2.0 | 1018 | $1,786 | $1.75 | 43d | 1 | 1.01mi |
| 7290 Mahogany Dr Hyattsville, MD | 3.0 | 2.5 | 1300 | $2,400 | $1.85 | 4d | 1 | 1.01mi |
| 7626 Green Willow Ct Hyattsville, MD | 4.0 | 3.0 | 1220 | $2,850 | $2.34 | 18d | 1 | 1.13mi |
| 6706 Central Hills Ter Hyattsville, MD | 3.0 | 2.5 | 1212 | $2,500 | $2.06 | 43d | 1 | 1.16mi |
| 2754 Zeek Ln Lanham, MD | 3.0 | 2.5 | 1616 | $3,000 | $1.86 | 43d | 1 | 1.17mi |
| 7727 Swan Ter Hyattsville, MD | 3.0 | 2.5 | 1700 | $2,200 | $1.29 | 17d | 1 | 1.20mi |
| 1105 Carrington Ave Capitol Heights, MD | 3.0 | 1.5 | 1152 | $2,395 | $2.08 | 1d | 1 | 1.36mi |
| 1105 Carrington Ave Capitol Heights, MD | 3.0 | 1.5 | 1152 | $2,400 | $2.08 | 43d | 1 | 1.36mi |
| 8251 Ridgefield Blvd Landover, MD | 2.0–4.0 | 1.5–2.5 | 1182 | $2,643 | $2.24 | 1d | 54 | 1.43mi |
| 8100 Gibbs Way Hyattsville, MD | 1.0–3.0 | 1.0–2.5 | 1082 | $2,825 | $2.61 | 1d | 58 | 1.45mi |
Listing history 30 events
-
2026-06-18days on market $240,000 Active 155 DOM
-
2026-06-17days on market $240,000 Active 154 DOM
-
2026-06-16days on market $240,000 Active 153 DOM
-
2026-06-15days on market $240,000 Active 152 DOM
-
2026-06-13days on market $240,000 Active 150 DOM
-
2026-06-10days on market $240,000 Active 146 DOM
-
2026-06-08days on market $240,000 Active 145 DOM
-
2026-06-07days on market $240,000 Active 144 DOM
-
2026-06-04days on market $240,000 Active 141 DOM
-
2026-06-03days on market $240,000 Active 140 DOM
-
2026-06-02days on market $240,000 Active 139 DOM
-
2026-06-01days on market $240,000 Active 138 DOM
-
2026-05-31days on market $240,000 Active 137 DOM
-
2026-02-09price $240,000 262-char remark
Show marketing remark (262 chars)
NEW PRICE IMPROVEMENT! Calling all investors and renovation buyers! This end-unit townhome presents 1320 sq. ft. of untapped potential in a desirable neighborhood. With 3 bedrooms and 1 bathroom, this property is perfectly positioned for your value-add strategy.
-
2026-01-14$260,000 Active 262-char remark
Show marketing remark (262 chars)
NEW PRICE IMPROVEMENT! Calling all investors and renovation buyers! This end-unit townhome presents 1320 sq. ft. of untapped potential in a desirable neighborhood. With 3 bedrooms and 1 bathroom, this property is perfectly positioned for your value-add strategy.
-
2025-05-02historical
-
2025-02-03$260,000 Active
-
2024-12-17historical
-
2024-08-19historical
-
2024-06-26$275,000 Active
-
2024-06-19historical
-
2016-11-16soldstatus $148,000
-
2016-09-29soldstatus $148,000 Sold
-
2016-09-29soldstatus $148,000
-
2016-07-08status Contract
-
2016-07-02$150,000 Active
-
2005-01-05historical
-
2004-10-31
-
1995-09-12soldstatus $74,500
-
1975-04-28soldstatus $13,603
ⓘ Source: listings_history table (triggers on properties + properties_extension) + one-shot
backfill from property_details.listing_events for pre-trigger history.
Tax reassessment forecast MD · Partial reset (capped growth)
- Current annual tax
- $2,984 · $249/mo
- Projected year-2 tax
- $2,984 · $249/mo
- Expected delta
- $0/yr ($0/mo · 0.0%)
ⓘ Screening estimate from a state-policy table — verify with the county assessor before closing.
Climate risk First Street
- Flood 1/10 Low FEMA zone X (unshaded) · 0% chance over 30 yrs
- Wildfire 1/10 Low
- Heat 7/10 Severe 7 d/yr ≥103°F today · 15 d/yr by 30 yrs out
- Wind 4/10 Moderate 20% chance of damaging wind over 30 yrs
- Air quality 4/10 Moderate 4 unhealthy d/yr today · 5 by 30 yrs out
Nearby sold comps map
Loading sold comps map…
Walkable amenities ~0.75 mi
Loading nearby amenities…
Taxation est. · year 1
- Rental income
- $27,688
- − Mortgage interest
- −$13,444
- − Property taxes
- −$2,984
- − Insurance
- −$1,200
- − Repairs & maintenance
- −$2,215
- − Management
- −$2,215
- − Depreciation
- −$6,982
- Taxable loss
- −$1,352
- Est. tax savings @ 24.0%
- +$324
- After-tax cash flow
- $2,911/yr
For passive investors: Depreciation is non-cash, so a rental often shows a tax loss while cash-flowing — sheltering income. Rental losses are passive: they offset passive income freely, and up to $25,000/yr can offset ordinary (W-2) income if you actively participate and your MAGI is under $100k (phasing out to $0 by $150k); unused losses carry forward. On sale, claimed depreciation is recaptured at up to 25%, and gains may owe capital-gains tax (a 1031 exchange can defer both). Figures are a year-1 estimate at your 24.0% rate — not tax advice; consult a CPA.
Schools (NCES district)
- District
- Prince George'S County Public Schools
- NCES district ID
- 2400510
- Math proficiency
- 8% ▼ -11.00%
- Reading proficiency
- 24% ▼ -9.00%
- Median HH income
- $73,967
- Composite
- 16.82/100
- National rank
- #9151
- State rank
- #21 of 24 in MD
Livability — Landover
- Score
- 69/100
- State rank
- #194
- US rank
- #8942
Category grades
Schools grade is shown separately in the Schools card above.
Census & demographics
- Census place
- Landover, MD
- County
- Prince Georges County · 919,866 people
- City population
- 40,946
- Metro
- Washington-Arlington-Alexandria, DC-VA-MD-WV
- Population (ZIP)
- 40,066
- Household income
- $85,994
- Rent vs Own
- Severe rent burden
- 1927.0
Population outlook (Prince George's County) Hauer SSP2
- Today (2025)
- 1,005,426 people
- By 2030
- 1,048,416 · +4.3%
- By 2040
- 1,123,425 · +11.7%
- By 2050
- 1,183,220 · +17.7%
- By 2075
- 1,306,202 · +29.9%
- By 2100
- 1,408,179 · +40.1%
Race, ethnicity, and origin ACS 2023
- Neighborhood character
- Predominantly Black (70%)
- Race & ethnicity
- Black 70% Hispanic / Latino 16% White 6% Two or more races 6% Asian 3%
- Hispanic origin (detail)
- Mexican 3% Dominican 1%
- Common ancestry
- Hispanic 2% Swiss 0%
- Foreign-born
- 21% · Canada, United Kingdom, China
- Languages at home
- 74% English-only · Spanish 13% French/Haitian/Cajun 4% Other Indo-European 1%
Political lean MEDSL · Prince George's
- 2024 margin
- Solid D (+75.2) · D 86.3% · R 11.2% · Other 2.5%
- 2008→2024 swing
- -3.3pp toward R · 2008: 78.5pp · 2024: 75.2pp
- All cycles
- 2024: D+75.2 2020: D+80.5 2016: D+81.0 2012: D+80.9 2008: D+78.5
Not yet ingested
- Civics
- —
Market trends
- HPI YoY
- ▼ -137.48%
- Current HPI
- 314.7413
- Rent YoY
- ▲ 4.30%
- Metro
- Washington-Arlington-Alexandria, DC-VA-MD-WV
- State GDP YoY
- ▲ 2.97%
- F500 in state
- 12
Industry mix (Fortune 500 HQ in MD)
| Industry | F500 HQs | Revenue |
|---|---|---|
| Aerospace / Defense | 1 | $71B |
|
||
| Utilities | 1 | $25B |
|
||
| Hotels | 1 | $24B |
|
||
| Consumer Goods | 1 | $7B |
|
||
| Real Estate | 1 | $6B |
|
||
| Chemicals | 1 | $2B |
|
||
Price history
+1664.3% since first listed17 events — show timeline
- 2026-02-09 Price Changed $240,000 BRIGHT MLS
- 2026-01-14 Listed $260,000 BRIGHT MLS
- 2025-05-02 Listing Removed — BRIGHT MLS
- 2025-02-03 Listed $260,000 BRIGHT MLS
- 2024-12-17 Coming Soon — BRIGHT MLS
- 2024-08-19 Listing Removed — BRIGHT MLS
- 2024-06-26 Listed $275,000 BRIGHT MLS
- 2024-06-19 Coming Soon — BRIGHT MLS
- 2016-11-16 Sold (Public Records) $148,000 Public Records
- 2016-09-29 Sold (MLS) $148,000 BRIGHT MLS
- 2016-09-29 Sold (MLS) $148,000 MRIS
- 2016-07-08 Pending — MRIS
- 2016-07-02 Listed $150,000 MRIS
- 2005-01-05 Delisted — MRIS
- 2004-10-31 Listed — MRIS
- 1995-09-12 Sold (Public Records) $74,500 Public Records
- 1975-04-28 Sold (Public Records) $13,603 Public Records
Property tax history
+7.1%/yrLatest (2025): $2,984 · +4.0% YoY. Source: county tax records.
Cash-flow waterfall
monthlySold comps — $/sqft
last 12 mo · ≤1 miLoading sold comps…