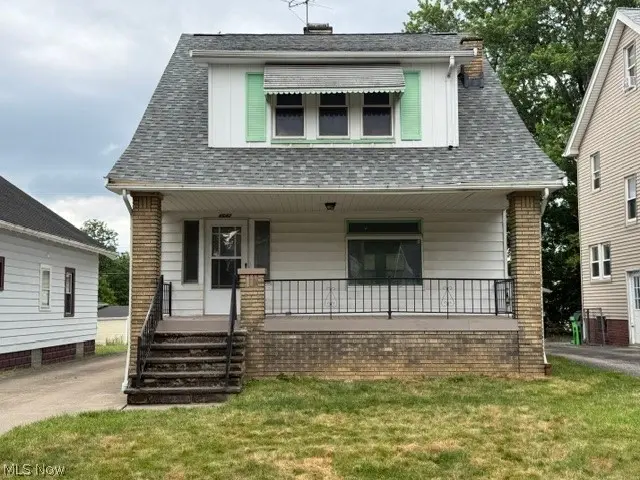
4642 Rockwood Rd · Garfield Heights, OH
Flood risk 1/10 · Minimal
- FEMA flood zone
- X (unshaded)
- Chance of flooding over 30 yrs
- 0.0%
- Est. flood insurance / yr
- $473 – $860
Fire risk 1/10 · Minimal
- Est. fire insurance / yr
- $713 – $1,323
Heat risk 3/10 · Minor
- Hot days now (above 96°F)
- 7 days/yr
- Hot days in 30 yrs
- 17 days/yr
Wind risk 1/10 · Minimal
- Chance of severe wind over 30 yrs
- —
Air-quality risk 3/10 · Minor
- Unhealthy air days now
- 2 days/yr
- Unhealthy air days in 30 yrs
- 3 days/yr
Risk factors via First Street. Map © Google.
Why this score? — see what drove the D- grade
The composite is a weighted blend of 9 inputs, each scored 0–100. Each bar is that input's sub-score; the figure is the points it added to the 100-point composite (weight × sub-score).
- Cash flow +13.7/30.0
- 1% rule +4.5/10.0
- DSCR +4.1/10.0
- Rent growth +3.7/5.0
- Livability +3.4/5.0
- ARV discount +2.7/15.0
- Condition / age +2.5/5.0
- Schools +1.3/10.0
- Appreciation +0.0/10.0
$159,900
🖨 Deal sheet 📄 Offer letter ✓ Due diligence
Listing remarks
Come see this updated 3-bedroom, 1-bath home in Garfield Heights! This move-in-ready property features a 2-car detached garage and a long list of recent improvements, including a new roof, new A/C, new luxury vinyl plank flooring, fresh paint throughout, and a new refrigerator. Whether you're a first-time buyer or looking to add to your investment portfolio, this home offers comfort, value, and peace of mind with its major updates already completed. Schedule your showing today!
Key facts
- Fresh paint
- New flooring
- New a/c
Tags
Property features AI
Exterior
- Parking: Detached 2-car garage
- Utilities: Public water; Public sewer
- Home design: Two-story home; Aluminum siding exterior; Asphalt/fiberglass roof
- Construction: Built per public records; Aluminum siding; Asphalt/Fiberglass roof
- Exterior features: Lot approximately 0.11 acres; Public records lot information
Interior
- Kitchen: Kitchen on main level (11 x 9)
- Bedrooms: Second-floor bedroom (13 x 10); Second-floor bedroom (15 x 10); Second-floor bedroom (12 x 11)
- Bathrooms: 1 full bathroom
- Heating & cooling: Central air conditioning; Forced air heating (gas)
- Interior features: Full basement
Neighborhood map
What this means for you Summary
Snapshot
- This is a 3-bed/1.5-bath single-family listed at $160k.
Deal economics
- At list price, monthly cash flow is $11 ($134/yr) — positive.
- The deal already cash-flows at list — no discount required.
- To meet the 1% rule (rent ≥ 1% of price), the offer needs to be $152k (5.0% below list).
- Recommended offer: $152k (5.0% below list) — sets the bar for 1% rule.
Location & tenants
- Location reads 67/100 on livability (#593 in OH) — a middle-class / working-renter tenant base. Strengths: cost of living A+, housing A+, health & safety A; Watch: schools C-, crime D-, amenities F.
- Garfield Heights City Schools (suburban): math 8% / reading 22% proficiency, ranked #643 of 656 in OH (top 98%) — low school quality limits family demand, transient renter base, plan for 1-2y turnover; 64% free/reduced lunch — lower-income household profile, screen leases tightly.
- Market conditions: Rents rising fast (+4.8%/yr); 120 active listings in the ZIP; 34 comparable units currently listed for rent nearby; rentals at typical pace (median 17d on market — plan ~3-4 weeks tenant-placement turnaround); 1,441 units permitted in Cuyahoga County in 2024 (700 in 5+ unit buildings).
- This rent runs 32% of the median local income ($57k/yr) — at the standard rent-burdened threshold; future hikes will face affordability resistance.
Forward outlook
- Local home prices are declining (-3.0%/yr); year-one equity from $1k of loan paydown is wiped out by about $5k of value loss. Plan a longer hold.
- Cuyahoga County population projected to shrink 8% by 2050 — rents likely to lag national; underwrite the cash flow, not the appreciation.
Negotiation context
- Only 6 days on market — expect competitive offers; lowballing is unlikely to land.
- Current owner paid $40k; list at $160k implies a 300% gain — meaningful room to come down on a strong offer.
Risks & watch-outs
- Watch-outs: built in 1925 — expect roof / HVAC / electrical / plumbing capex.
Questions for the listing agent
- Built in 1925 — when were the roof, HVAC, electrical panel, plumbing, and water heater last replaced?
- Is there a deadline driving the sale (1031 exchange, divorce, estate, relocation)? That informs how much negotiation room exists.
- Crime grade is D in this area — have there been break-ins, vandalism, or insurance claims at this property in the last 3 years? What carrier currently insures it and at what premium?
- The area grade is low — what's the realistic commute time and amenity access for the typical tenant pool here? Any planned neighborhood developments (good or bad) we should know about?
- What's the average days-on-market for RENTAL listings here right now (not sales)? A rising rental-DOM trend means longer vacancies and softer asking-rent achievability than the comps imply.
- What's the recent tenant-quality profile in this submarket — average credit score on applications, eviction rate, late-payment / NSF rate, and stable-employment percentage? A property-management company in the area should have these aggregated.
- How much new for-sale + rental construction is in the pipeline within 1–3 miles? Heavy new supply typically softens prices + rents 12–24 months out; constrained supply supports both.
Investment metrics
- 1% rule
- 0.95% ✗
- Cap rate
- 6.38%
- Cash-on-cash
- 0.30%
- DSCR
- 1.01
- GRM
- 8.8
CMA / ARV
- ARV (on-the-fly)
- $144,480
- Comps found
- 12
Show comp detail 12 sales within ~0.75 mi
| Address | Dist | Beds/Ba | Sqft | Sold | Price | $/sf | Match |
|---|---|---|---|---|---|---|---|
| 4690 E 90th St | 0.24mi | 3/1.5 | 1,278 (-7%) | 3mo | $105,000 | $82 | 74 |
| 4729 E 90th St | 0.29mi | 4/2.5 (+1) | 1,387 (+1%) | 4mo | $145,000 | $105 | 73 |
| 4658 Burleigh Rd | 0.07mi | 3/2.0 | 1,200 (-13%) | 5mo | $205,000 | $171 | 70 |
| 4874 E 95th St | 0.52mi | 3/1.0 | 1,352 (-2%) | 4mo | $91,000 | $67 | 67 |
| 4928 E 84th | 0.54mi | 3/1.0 | 1,352 (-2%) | 5mo | $133,000 | $98 | 66 |
| 4850 E 90th St | 0.45mi | 3/1.5 | 1,284 (-7%) | 4mo | $178,500 | $139 | 64 |
| 4768 Burleigh Rd | 0.26mi | 3/1.0 | 1,188 (-14%) | 2mo | $132,000 | $111 | 62 |
| 4868 E 88th St | 0.46mi | 3/1.5 | 1,232 (-10%) | 2mo | $75,000 | $61 | 60 |
| 4863 E 93rd St | 0.52mi | 3/1.5 | 1,212 (-12%) | 1mo | $136,000 | $112 | 55 |
| 4845 E 90th St | 0.46mi | 3/1.5 | 1,182 (-14%) | 4mo | $105,000 | $89 | 52 |
| 4847 E 94th St | 0.53mi | 3/1.5 | 1,173 (-15%) | 2mo | $167,000 | $142 | 49 |
| 10217 Parkview Ave | 0.73mi | 4/1.0 (+1) | 1,312 (-5%) | 4mo | $95,000 | $72 | 48 |
Match score weights: distance 35% · size 25% · config 20% · recency 20%. Top-matched comps best support the ARV.
Projected returns pro-forma
-3.0% appreciation · 4.8% rent growth · sell at horizon
- IRR
- -13.6%
- Equity multiple
- 0.50×
- Total profit
- $-22,324
- Equity at exit
- $23,842
- IRR
- -1.9%
- Equity multiple
- 0.86×
- Total profit
- $-6,303
- Equity at exit
- $13,825
Cash invested: $44,772 (down + closing). Projections, not guarantees.
Landlord ↔ Tenant lean methodology
- Overall (STATE)
- 73 Landlord-Friendly
- State Ohio
- 73 Landlord-Friendly · R+6
- County
- — inherits STATE
- City
- — inherits STATE
ZIP-level market 44125
- Rents YoY
- 4.8%
- Active inventory
- 120
- Price-to-rent
- 8.8×
Monthly cashflow live
- Estimated rent
- $1,518 high interval (Pro) →
- Mortgage (P&I)
- −$839
- Tax from tax record
- −$283 /mo · $3,399/yr
- Insurance
- −$67
- HOA
- −$0
- Vacancy / Maint / Mgmt
- −$319
- Net cashflow
- $11
Break-even live
UW: 25.0% down · 7.5% · 30yr · 1.5% tax · 5.0% vac · 8.0% maint · 8.0% mgmt
Financing live
Cash to close
- Down payment
- $39,975
- Closing costs
- $4,797
- Reserves months
- —
- Total cash needed
- —
Loan-product check · same deal, 3 products live
Conventional
25% down · 7.5% · 30yr
- Down + closing
- —
- Monthly P&I
- —
- Monthly cashflow
- —
- DSCR
- —
- Eligible?
- —
Personal DTI + credit; lowest rate.
DSCR
20% down · 8.5% · 30yr
- Down + closing
- —
- Monthly P&I
- —
- Monthly cashflow
- —
- DSCR
- —
- Eligible?
- —
No personal income docs; deal must DSCR.
Hard money
10% down · 12.0% · 12mo
- Down + closing
- —
- Monthly P&I
- —
- Monthly cashflow
- —
- DSCR
- —
- Eligible?
- —
Short-term bridge; refi at stabilization.
Rent comps 34 comps
| Address | Beds | Baths | Sqft | Rent | $/sqft | DOM | Units | Dist |
|---|---|---|---|---|---|---|---|---|
| 4685 Horton Rd Cleveland, OH | 3.0 | 1.0 | 1174 | $1,400 | $1.19 | 16d | 1 | 0.15mi |
| 4633 Warner Rd Unit 2 Garfield Heights, OH | 3.0 | 1.0 | 1120 | $1,500 | $1.34 | 3d | 1 | 0.20mi |
| 4772 E 90th St Unit Down Garfield Heights, OH | 2.0 | 1.0 | 1004 | $950 | $0.95 | 16d | 1 | 0.32mi |
| 9309 Garfield Blvd Cleveland, OH | 2.0 | 1.0 | 1056 | $1,400 | $1.33 | 21d | 1 | 0.41mi |
| 4852 E 81st St Cleveland, OH | 3.0 | 1.0 | 1104 | $1,850 | $1.68 | 1d | 1 | 0.42mi |
| 4913 E 85th St Unit down Garfield Heights, OH | 2.0 | 1.0 | 1008 | $950 | $0.94 | 23d | 1 | 0.51mi |
| 4874 E 95th St Cleveland, OH | 3.0 | 1.5 | 1352 | $1,774 | $1.31 | 23d | 1 | 0.51mi |
| 4874 E 95th St Cleveland, OH | 3.0 | 1.5 | 1352 | $1,774 | $1.31 | 20d | 1 | 0.51mi |
| 4916 E 85th St Cleveland, OH | 3.0 | 1.0 | 1248 | $1,700 | $1.36 | 16d | 1 | 0.51mi |
| 4935 E 86th St Cleveland, OH | 3.0 | 1.0 | 1242 | $1,300 | $1.05 | 16d | 1 | 0.53mi |
| 4928 E 84th St Cleveland, OH | 3.0 | 1.0 | 1352 | $1,395 | $1.03 | 12d | 1 | 0.53mi |
| 4960 E 84th St Cleveland, OH | 3.0 | 1.5 | 1352 | $1,495 | $1.11 | 7d | 1 | 0.59mi |
| 4859 E 97th St Cleveland, OH | 2.0 | 1.0 | 1000 | $1,150 | $1.15 | 23d | 1 | 0.60mi |
| 10010 Parkview Ave Garfield Heights, OH | 3.0 | 1.0 | 877 | $1,500 | $1.71 | 17d | 1 | 0.65mi |
| 9516 Alexander Rd Cleveland, OH | 3.0 | 1.0 | 1500 | $2,000 | $1.33 | 19d | 1 | 0.75mi |
| 5052 E 88th St Cleveland, OH | 3.0 | 1.0 | 1221 | $1,400 | $1.15 | 7d | 1 | 0.76mi |
| 10401 Homeworth Ave Unit Up Unit Garfield Heights, OH | 2.0 | 1.0 | 1206 | $1,095 | $0.91 | 20d | 1 | 0.86mi |
| 10308 Homeworth Ave Unit Down Garfield Heights, OH | 2.0 | 1.0 | 892 | $950 | $1.07 | 23d | 1 | 0.86mi |
| 9334 McCracken Blvd Cleveland, OH | 4.0 | 1.0 | 1150 | $1,595 | $1.39 | 16d | 1 | 0.86mi |
| 7133 Bletch Ct Cleveland, OH | 3.0 | 1.5 | 1471 | $2,000 | $1.36 | 43d | 1 | 0.94mi |
| 10722 Edgepark Dr Garfield Heights, OH | 3.0 | 1.0 | 1296 | $1,449 | $1.12 | 17d | 1 | 0.94mi |
| 10720 Edgepark Dr Cleveland, OH | 3.0 | 1.0 | 1296 | $1,449 | $1.12 | 17d | 1 | 0.95mi |
| 4930 E 108th St Unit Down Garfield Heights, OH | 2.0 | 1.0 | 1067 | $925 | $0.87 | 16d | 1 | 0.99mi |
| 10715 Wadsworth Ave Cleveland, OH | 2.0 | 1.0 | 960 | $800 | $0.83 | 23d | 1 | 1.03mi |
| 10725 Vernon Ave Cleveland, OH | 2.0 | 1.0 | 1092 | $975 | $0.89 | 17d | 1 | 1.06mi |
| 10721 Plymouth Ave Cleveland, OH | 3.0 | 1.0 | 1300 | $2,000 | $1.54 | 1d | 1 | 1.09mi |
| 5014 E 71st St Cleveland, OH | 2.0 | 1.0 | 900 | $1,200 | $1.33 | 7d | 1 | 1.10mi |
| 10717 Park Heights Ave Unit 3 Garfield Heights, OH | 2.0 | 1.0 | 900 | $750 | $0.83 | 23d | 1 | 1.11mi |
| 11110 Vernon Ave Cleveland, OH | 3.0 | 1.0 | 1224 | $1,395 | $1.14 | 23d | 1 | 1.22mi |
| 11107 Park Heights Ave Cleveland, OH | 4.0 | 2.0 | 1640 | $2,000 | $1.22 | 1d | 1 | 1.24mi |
| 11006 McCracken Rd Cleveland, OH | 2.0 | 1.0 | 887 | $1,350 | $1.52 | 23d | 1 | 1.25mi |
| 11213 McCracken Rd Cleveland, OH | 3.0 | 1.0 | 1200 | $1,375 | $1.15 | 7d | 1 | 1.30mi |
| 11303 McCracken Rd Cleveland, OH | 3.0 | 1.0 | 1300 | $1,650 | $1.27 | 4d | 1 | 1.33mi |
| 5145 E 114th St Cleveland, OH | 3.0 | 1.5 | 1174 | $1,620 | $1.38 | 7d | 1 | 1.45mi |
Listing history 6 events
-
2026-06-18days on market $159,900 Active 6 DOM
-
2026-06-17days on market $159,900 Active 5 DOM
-
2026-06-16days on market $159,900 Active 4 DOM
-
2026-06-15days on market $159,900 Active 3 DOM
-
2026-06-13remarks 482-char remark
-
2026-06-13$159,900 Active 1 DOM
ⓘ Source: listings_history table (triggers on properties + properties_extension) + one-shot
backfill from property_details.listing_events for pre-trigger history.
Tax reassessment forecast OH · Partial reset (capped growth)
- Current annual tax
- $3,399 · $283/mo
- Projected year-2 tax
- $3,399 · $283/mo
- Expected delta
- $0/yr ($0/mo · 0.0%)
ⓘ Screening estimate from a state-policy table — verify with the county assessor before closing.
Climate risk First Street
- Flood 1/10 Low FEMA zone X (unshaded) · 0% chance over 30 yrs
- Wildfire 1/10 Low
- Heat 3/10 Moderate 7 d/yr ≥96°F today · 17 d/yr by 30 yrs out
- Wind 1/10 Low
- Air quality 3/10 Moderate 2 unhealthy d/yr today · 3 by 30 yrs out
Nearby sold comps map
Loading sold comps map…
Walkable amenities ~0.75 mi
Loading nearby amenities…
Taxation est. · year 1
- Rental income
- $18,222
- − Mortgage interest
- −$8,957
- − Property taxes
- −$3,399
- − Insurance
- −$800
- − Repairs & maintenance
- −$1,458
- − Management
- −$1,458
- − Depreciation
- −$4,652
- Taxable loss
- −$2,501
- Est. tax savings @ 24.0%
- +$600
- After-tax cash flow
- $734/yr
For passive investors: Depreciation is non-cash, so a rental often shows a tax loss while cash-flowing — sheltering income. Rental losses are passive: they offset passive income freely, and up to $25,000/yr can offset ordinary (W-2) income if you actively participate and your MAGI is under $100k (phasing out to $0 by $150k); unused losses carry forward. On sale, claimed depreciation is recaptured at up to 25%, and gains may owe capital-gains tax (a 1031 exchange can defer both). Figures are a year-1 estimate at your 24.0% rate — not tax advice; consult a CPA.
Schools (NCES district)
- District
- Garfield Heights City Schools
- NCES district ID
- 3904404
- Math proficiency
- 8% ▼ -19.00%
- Reading proficiency
- 22% ▼ -18.00%
- Median HH income
- $41,334
- Composite
- 12.88/100
- National rank
- #9590
- State rank
- #643 of 656 in OH
Livability — Garfield Heights
- Score
- 67/100
- State rank
- #593
- US rank
- #10152
Category grades
Schools grade is shown separately in the Schools card above.
Census & demographics
- Census place
- Garfield Heights, OH
- County
- Cuyahoga County · 1,090,369 people
- City population
- 29,461
- Metro
- Cleveland-Elyria, OH
- Population (ZIP)
- 29,461
- Household income
- $57,363
- Rent vs Own
- Severe rent burden
- 1738.0
Population outlook (Cuyahoga County) Hauer SSP2
- Today (2025)
- 1,244,621 people
- By 2030
- 1,230,093 · -1.2%
- By 2040
- 1,189,108 · -4.5%
- By 2050
- 1,145,706 · -7.9%
- By 2075
- 1,076,557 · -13.5%
- By 2100
- 978,987 · -21.3%
Race, ethnicity, and origin ACS 2023
- Neighborhood character
- Diverse neighborhood (Simpson 0.61)
- Race & ethnicity
- Black 47% White 41% Two or more races 7% Hispanic / Latino 6%
- Hispanic origin (detail)
- Mexican 2% Puerto Rican 3%
- Common ancestry
- Romanian 11% Slovak 1% Lithuanian 1%
- Foreign-born
- 3% · Canada
- Languages at home
- 94% English-only · Spanish 4% Russian/Polish/Slavic 1%
Political lean MEDSL · Cuyahoga
- 2024 margin
- Solid D (+31.5) · D 65.4% · R 33.9%
- 2008→2024 swing
- -7.4pp toward R · 2008: 38.9pp · 2024: 31.5pp
- All cycles
- 2024: D+31.5 2020: D+34.1 2016: D+35.0 2012: D+38.7 2008: D+38.9
Not yet ingested
- Civics
- —
Market trends
- HPI YoY
- ▼ -116.98%
- Current HPI
- 155.1507
- Rent YoY
- ▲ 4.80%
- Metro
- Cleveland-Elyria, OH
- State GDP YoY
- ▲ 1.98%
- F500 in state
- 48
Industry mix (Fortune 500 HQ in OH)
| Industry | F500 HQs | Revenue |
|---|---|---|
| Insurance | 3 | $145B |
|
||
| Industrial Machinery | 3 | $49B |
|
||
| Financial Services | 3 | $24B |
|
||
| Consumer Goods | 2 | $93B |
|
||
| Aerospace / Defense | 2 | $47B |
|
||
| Utilities | 2 | $33B |
|
||
Price history
+299.8% since first listed2 events — show timeline
- 2026-06-12 Listed $159,900 MLSNOW
- 1981-12-07 Sold (Public Records) $40,000 Public Records
Property tax history
+2.4%/yrLatest (2025): $3,399 · -19.6% YoY. Source: county tax records.
Cash-flow waterfall
monthlySold comps — $/sqft
last 12 mo · ≤1 miLoading sold comps…