 Duplex
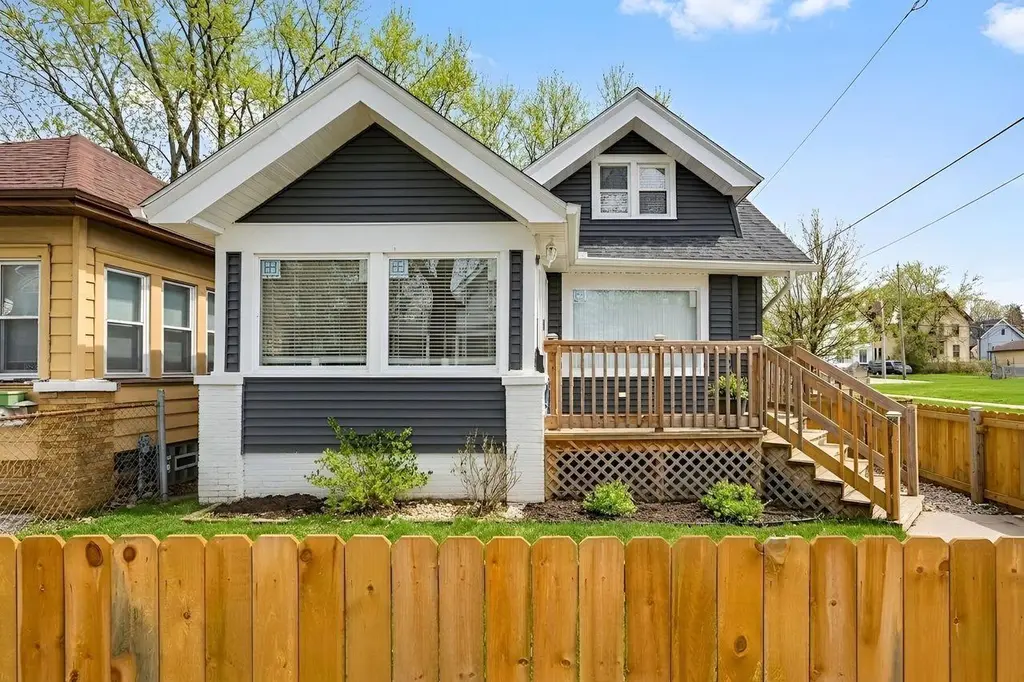
3299 N 9th St · Milwaukee, WI
Flood risk 1/10 · Minimal
- FEMA flood zone
- X (unshaded)
- Chance of flooding over 30 yrs
- 0.0%
- Est. flood insurance / yr
- $473 – $860
Fire risk 1/10 · Minimal
- Est. fire insurance / yr
- $636 – $1,182
Heat risk 2/10 · Minimal
- Hot days now (above 98°F)
- 7 days/yr
- Hot days in 30 yrs
- 13 days/yr
Wind risk 2/10 · Minimal
- Chance of severe wind over 30 yrs
- —
Air-quality risk 3/10 · Minor
- Unhealthy air days now
- 3 days/yr
- Unhealthy air days in 30 yrs
- 4 days/yr
Risk factors via First Street. Map © Google.
Why this score? — see what drove the B- grade
The composite is a weighted blend of 9 inputs, each scored 0–100. Each bar is that input's sub-score; the figure is the points it added to the 100-point composite (weight × sub-score).
- Cash flow +22.2/30.0
- Appreciation +10.0/10.0
- ARV discount +7.5/15.0
- DSCR +7.1/10.0
- 1% rule +6.7/10.0
- Rent growth +4.6/5.0
- Livability +4.0/5.0
- Condition / age +2.5/5.0
- Schools +1.2/10.0
$174,900
🖨 Deal sheet (PDF) 📄 Offer letter ✓ Due diligence
Multi-family units
County records classify this as Multi-Family (2-4 Unit). Listing-text estimate: 2 units. confirmed
Listing remarks MLS
This wonderful home has so much to offer. Natural woodwork, built in china cabinets, sunroom, large yard, detach garage. Can be used as a single familyl or duplex, nice for growing family. Upper also has an addition kitchen! This could be used as a 5th bedroom if converted-many options, many possibilities. Motivated seller
Key facts
- 3,920 sq ft lot
- 2 garage spots
- Built 1926
Property features AI
Finance
- Other: Property contains 2 units; Seller and tenants' personal property excluded from sale
Exterior
- Parking: Detached 2-car garage; 1 additional off-street parking space
- Utilities: Municipal water; Municipal sewer
- Home design: 1.5-story multi-family building; Zoning: RT4
- Construction: Less than 1/2 acre lot (approx. 0.09 acre)
- Exterior features: Aluminum/steel siding
Interior
- Kitchen: Unit 2 kitchen on upper level (approx. 12 x 10); Oven/stove (2); Refrigerator (2); Microwave (2)
- Bedrooms: Unit 1: 2 bedrooms; Unit 2: 1 bedroom (upper level, approx. 11 x 11)
- Bathrooms: Unit 1: 1 full bath and 1 half bath; Unit 2: 1 full bath
- Interior features: Full block basement
- Laundry & utility: Washer and dryer included; 2 electric meters, 1 gas meter
Neighborhood map
What this means for you Summary
Snapshot
- This is a 2 × 2.0-bed/1.5-bath units multifamily listed at $175k.
Deal economics
- At list price, monthly cash flow is $286 ($3k/yr) — positive. Per door: $143/mo.
- The deal already cash-flows at list — no discount required.
- Meets the 1% rule at list price ($2k rent vs $175k).
- Recommended offer: $164k (6.0% below list) — sets the bar for market timing.
- Cap rate 8.3% vs local median 5.1% in Milwaukee — top-decile yield for the area; either an underpriced asset or a hidden risk that comps aren't pricing in. Stress-test before assuming the spread holds.
Location & tenants
- Location reads 81/100 on livability (#55 in WI, #1,534 nationally) — a professional / high-income tenant draw. Strengths: amenities A+, commute A+, cost of living A+; Watch: employment D+, schools F, crime F.
- Milwaukee School District (urban): math 10% / reading 18% proficiency, ranked #337 of 342 in WI (top 98%) — low school quality limits family demand, transient renter base, plan for 1-2y turnover; 77% free/reduced lunch — lower-income household profile, screen leases tightly.
- Market conditions: Rents rising fast (+8.3%/yr); 150 active listings in the ZIP; 10 comparable units currently listed for rent nearby; rentals at typical pace (median 24d on market — plan ~3-4 weeks tenant-placement turnaround); lower-income renter base — watch delinquency; 1,017 units permitted in Milwaukee County in 2024 (803 in 5+ unit buildings).
- At $2,046/mo this rent would consume 84% of the median local household income ($29k/yr) (locally 2061% of renters already pay >50% of income on rent) — very limited rent-growth headroom before tenants either downsize or default.
Forward outlook
- In year one you build about $19k of equity ($1k loan paydown + $17k appreciation (10.0% local appreciation)).
- Milwaukee County population projected at +4% by 2050 — modest demand growth; plan on rents tracking national, not racing it.
- At projected returns (10.0% appreciation + 8.0% rent growth), your $49k cash investment doubles in ~3 years — after that, you're playing with house money.
- By year 2, paydown + projected appreciation supports a ~$30k cash-out refi (75% LTV) — recoverable capital for the next deal without selling this one.
Negotiation context
- It's been on market 90 days — a 6% lower offer ($164k) is reasonable based on typical stale-listing flexibility.
- 6 sale attempts since 14y ago with the ask held roughly flat each time — persistent listings suggest the price (not the market) is what's stuck; bring a comps-based counter.
- Current owner paid $23k; list at $175k implies a 660% gain — meaningful room to come down on a strong offer.
Risks & watch-outs
- Watch-outs: built in 1926 — expect roof / HVAC / electrical / plumbing capex.
Questions for the listing agent
- It's been on market 90 days. Have you received any prior offers? Is the seller open to a 6% concession, seller financing, or rate buy-down credit?
- Can we see the unit-by-unit rent roll, current vacancy, and any below-market leases? What's the average tenancy length?
- What capital expenditures (roof, boiler, parking lot, exteriors) have been made in the last 5 years, and what's planned in the next 2?
- Built in 1926 — when were the roof, HVAC, electrical panel, plumbing, and water heater last replaced?
- Why hasn't it sold? Are there any deal-killer items the seller is aware of (foundation, flood, title, zoning, code violations)?
- Is there a deadline driving the sale (1031 exchange, divorce, estate, relocation)? That informs how much negotiation room exists.
- Schools are F-rated, which usually means shorter tenancies and higher turnover. Who's the typical renter profile here, and what's been the actual vacancy rate?
- Crime grade is F in this area — have there been break-ins, vandalism, or insurance claims at this property in the last 3 years? What carrier currently insures it and at what premium?
- What's the average days-on-market for RENTAL listings here right now (not sales)? A rising rental-DOM trend means longer vacancies and softer asking-rent achievability than the comps imply.
- What's the recent tenant-quality profile in this submarket — average credit score on applications, eviction rate, late-payment / NSF rate, and stable-employment percentage? A property-management company in the area should have these aggregated.
- How much new apartment / multifamily construction is in the pipeline within 1–3 miles? Heavy new supply (>2% of stock underway) typically softens rents 12–24 months out; light construction supports rent growth.
Investment metrics
- 1% rule
- 1.17% ✓
- Cap rate
- 8.26%
- Cash-on-cash
- 7.01%
- DSCR
- 1.31
- GRM
- 7.1
CMA / ARV
- ARV (on-the-fly)
- $82,246
- Comps found
- 12
Show comp detail 12 sales within ~0.75 mi
| Address | Dist | Beds/Ba | Sqft | Sold | Price | $/sf | Match |
|---|---|---|---|---|---|---|---|
| 3258 N 12th St #3260 | 0.17mi | 4/2.0 (+1) | 2,086 (+4%) | 3mo | $51,000 | $24 | 78 |
| 3283 N 14th St #3285 | 0.32mi | 4/2.0 (+1) | 2,044 (+2%) | 2mo | $80,000 | $39 | 75 |
| 3328 N 13th St #3330 | 0.23mi | 4/2.0 (+1) | 2,176 (+8%) | 6mo | $130,000 | $60 | 65 |
| 608 W Burleigh St #610 | 0.32mi | 4/2.0 (+1) | 2,174 (+8%) | 3mo | $112,000 | $52 | 64 |
| 3065 N 10th St | 0.30mi | 4/2.0 (+1) | 1,753 (-13%) | 2mo | $60,000 | $34 | 58 |
| 3613 N 11th St | 0.36mi | 4/2.0 (+1) | 2,197 (+10%) | 6mo | $35,000 | $16 | 57 |
| 3701 N 14th St #3703 | 0.52mi | 4/2.0 (+1) | 2,174 (+8%) | 4mo | $90,000 | $41 | 53 |
| 3047 N 12th St | 0.39mi | 4/2.0 (+1) | 1,774 (-12%) | 6mo | $28,000 | $16 | 53 |
| 3905 N 13th St #3907 | 0.67mi | 4/2.0 (+1) | 1,884 (-6%) | 2mo | $144,500 | $77 | 52 |
| 3748 N 17th St | 0.67mi | 4/2.0 (+1) | 2,161 (+8%) | 2mo | $80,000 | $37 | 49 |
| 3341 N 3rd St #3343 | 0.44mi | 4/2.0 (+1) | 2,292 (+14%) | 4mo | $109,000 | $48 | 48 |
| 3906 N 6th St #3908 | 0.71mi | 4/2.0 (+1) | 2,223 (+11%) | 4mo | $134,900 | $61 | 40 |
Match score weights: distance 35% · size 25% · config 20% · recency 20%. Top-matched comps best support the ARV.
Projected returns pro-forma
10.0% appreciation · 8.0% rent growth · sell at horizon
- IRR
- 31.7%
- Equity multiple
- 3.54×
- Total profit
- $124,388
- Equity at exit
- $157,564
- IRR
- 29.2%
- Equity multiple
- 8.74×
- Total profit
- $378,975
- Equity at exit
- $339,792
Cash invested: $48,972 (down + closing). Projections, not guarantees.
Landlord ↔ Tenant lean methodology
- Overall (STATE)
- 73 Landlord-Friendly
- State Wisconsin
- 73 Landlord-Friendly · R+2
- County
- — inherits STATE
- City
- — inherits STATE
ZIP-level market 53206
- Rents YoY
- 8.3%
- Active inventory
- 150
- Price-to-rent
- 14.2×
Monthly cashflow live
- Estimated rent
- $2,046 high interval (Pro) →
- Mortgage (P&I)
- −$917
- Tax from tax record
- −$340 /mo · $4,083/yr
- Insurance
- −$73
- HOA
- −$0
- Vacancy / Maint / Mgmt
- −$430
- Net cashflow
- $286
Break-even live
Sensitivity live
| Price | -10% $385 | -5% $335 | +0% $286 | +5% $236 | +10% $187 |
|---|---|---|---|---|---|
| Rent | -10% $124 | -5% $205 | +0% $286 | +5% $367 | +10% $448 |
| Rate | -1.0pp $374 | -0.5pp $330 | base $286 | +0.5pp $241 | +1.0pp $195 |
2-unit breakdown (identical units grouped — click to expand)
| Units | Beds | Baths | Est. rent |
|---|---|---|---|
| 2× units | 2.0 | 1.5 | $2,046 |
| #1 | 2.0 | 1.5 | $1,023 |
| #2 | 2.0 | 1.5 | $1,023 |
| Total (2 units) | $2,046 | ||
UW: 25.0% down · 7.5% · 30yr · 1.5% tax · 5.0% vac · 8.0% maint · 8.0% mgmt
Financing live
Cash to close
- Down payment
- $43,725
- Closing costs
- $5,247
- Reserves months
- —
- Total cash needed
- —
Loan-product check · same deal, 3 products live
Conventional
25% down · 7.5% · 30yr
- Down + closing
- —
- Monthly P&I
- —
- Monthly cashflow
- —
- DSCR
- —
- Eligible?
- —
Personal DTI + credit; lowest rate.
DSCR
20% down · 8.5% · 30yr
- Down + closing
- —
- Monthly P&I
- —
- Monthly cashflow
- —
- DSCR
- —
- Eligible?
- —
No personal income docs; deal must DSCR.
Hard money
10% down · 12.0% · 12mo
- Down + closing
- —
- Monthly P&I
- —
- Monthly cashflow
- —
- DSCR
- —
- Eligible?
- —
Short-term bridge; refi at stabilization.
Rent comps 10 comps
| Address | Beds | Baths | Sqft | Rent | $/sqft | DOM | Units | Dist |
|---|---|---|---|---|---|---|---|---|
| 3420-22 N Vel R Phillips Ave Milwaukee, WI | 3.0 | 1.0 | 2756 | $1,195 | $0.43 | 44d | 1 | 0.42mi |
| 3420 N Vel R. Phillips Ave Unit 3422 Milwaukee, WI | 3.0 | 1.0 | 2756 | $1,195 | $0.43 | 44d | 1 | 0.43mi |
| 912 W Hadley St Milwaukee, WI | 2.0 | 1.0 | 2222 | $1,250 | $0.56 | 15d | 1 | 0.65mi |
| 3042 N Palmer St #5 Milwaukee, WI | 3.0 | 1.0 | 1718 | $1,050 | $0.61 | 24d | 1 | 0.78mi |
| 312 E Townsend St Unit 312 Milwaukee, WI | 3.0 | 1.0 | 1400 | $1,250 | $0.89 | 24d | 1 | 0.81mi |
| 2116 W Atkinson Ave Unit A Milwaukee, WI | 4.0 | 1.0 | 1707 | $2,000 | $1.17 | 2d | 1 | 1.19mi |
| 2308 W Clarke St Milwaukee, WI | 4.0 | 2.0 | 1545 | $1,750 | $1.13 | 24d | 1 | 1.29mi |
| 2772 N Bremen St #2774 Milwaukee, WI | 3.0 | 1.0 | 1500 | $1,795 | $1.20 | 44d | 1 | 1.35mi |
| 400 E Meinecke Ave #402 Milwaukee, WI | 3.0 | 1.0 | 1700 | $1,800 | $1.06 | 17d | 1 | 1.43mi |
| 2931 W Chambers St Milwaukee, WI | 2.0 | 1.0 | 1400 | $1,050 | $0.75 | 24d | 1 | 1.46mi |
Listing history 29 events
-
2026-06-18days on market $174,900 Active 90 DOM
-
2026-06-17days on market $174,900 Active 89 DOM
-
2026-06-16days on market $174,900 Active 88 DOM
-
2026-06-15days on market $174,900 Active 87 DOM
-
2026-06-13days on market $174,900 Active 85 DOM
-
2026-06-13days on market $174,900 Active 84 DOM
-
2026-06-09days on market $174,900 Active 81 DOM
-
2026-06-08days on market $174,900 Active 80 DOM
-
2026-06-07days on market $174,900 Active 79 DOM
-
2026-06-05days on market $174,900 Active 76 DOM
-
2026-06-03days on market $174,900 Active 75 DOM
-
2026-06-02days on market $174,900 Active 74 DOM
-
2026-06-01days on market $174,900 Active 73 DOM
-
2026-05-31days on market $174,900 Active 72 DOM
-
2026-03-24historical Contingent
-
2026-03-20$174,900 Active
-
2026-03-18historical $174,900
-
2013-02-02$67,000 325-char remark
Show marketing remark (343 chars)
This wonderful home has so much to offer a new owner. Natural woodwork, built in china cabinets, sunroom, large yard, detach garage. Can be used as a single family or duplex-nice home for growing family, upper also has an additional kitchen, could be used as an additional bedroom if converted-Many options many possiblities. Motivated seller!
-
2013-02-02historical 325-char remark
Show marketing remark (343 chars)
This wonderful home has so much to offer a new owner. Natural woodwork, built in china cabinets, sunroom, large yard, detach garage. Can be used as a single family or duplex-nice home for growing family, upper also has an additional kitchen, could be used as an additional bedroom if converted-Many options many possiblities. Motivated seller!
-
2013-02-02$90,000 343-char remark
Show marketing remark (343 chars)
This wonderful home has so much to offer a new owner. Natural woodwork, built in china cabinets, sunroom, large yard, detach garage. Can be used as a single family or duplex-nice home for growing family, upper also has an additional kitchen, could be used as an additional bedroom if converted-Many options many possiblities. Motivated seller!
-
2013-02-02historical 343-char remark
Show marketing remark (343 chars)
This wonderful home has so much to offer a new owner. Natural woodwork, built in china cabinets, sunroom, large yard, detach garage. Can be used as a single family or duplex-nice home for growing family, upper also has an additional kitchen, could be used as an additional bedroom if converted-Many options many possiblities. Motivated seller!
-
2012-10-10$24,900
-
2012-10-10historical
-
2012-10-10historical
-
2012-10-10$90,000
-
2012-10-09historical
-
2012-10-09$67,000
-
2008-09-05soldstatus $23,000
-
2006-07-24soldstatus $81,000
ⓘ Source: listings_history table (triggers on properties + properties_extension) + one-shot
backfill from property_details.listing_events for pre-trigger history.
Tax reassessment forecast WI · Partial reset (capped growth)
- Current annual tax
- $4,083 · $340/mo
- Projected year-2 tax
- $4,083 · $340/mo
- Expected delta
- $0/yr ($0/mo · 0.0%)
ⓘ Screening estimate from a state-policy table — verify with the county assessor before closing.
Climate risk First Street
- Flood 1/10 Low FEMA zone X (unshaded) · 0% chance over 30 yrs
- Wildfire 1/10 Low
- Heat 2/10 Low 7 d/yr ≥98°F today · 13 d/yr by 30 yrs out
- Wind 2/10 Low
- Air quality 3/10 Moderate 3 unhealthy d/yr today · 4 by 30 yrs out
Nearby sold comps map
Loading sold comps map…
Walkable amenities ~0.75 mi
Loading nearby amenities…
Taxation est. · year 1
- Rental income
- $24,552
- − Mortgage interest
- −$9,797
- − Property taxes
- −$4,083
- − Insurance
- −$874
- − Repairs & maintenance
- −$1,964
- − Management
- −$1,964
- − Depreciation
- −$5,088
- Taxable income
- $781
- Est. tax owed @ 24.0%
- −$187
- After-tax cash flow
- $3,244/yr
For passive investors: Depreciation is non-cash, so a rental often shows a tax loss while cash-flowing — sheltering income. Rental losses are passive: they offset passive income freely, and up to $25,000/yr can offset ordinary (W-2) income if you actively participate and your MAGI is under $100k (phasing out to $0 by $150k); unused losses carry forward. On sale, claimed depreciation is recaptured at up to 25%, and gains may owe capital-gains tax (a 1031 exchange can defer both). Figures are a year-1 estimate at your 24.0% rate — not tax advice; consult a CPA.
Schools (NCES district)
- District
- Milwaukee School District
- NCES district ID
- 5509600
- Math proficiency
- 10% ▼ -5.00%
- Reading proficiency
- 18% ▬ 0.00%
- Median HH income
- $36,339
- Composite
- 11.61/100
- National rank
- #9696
- State rank
- #337 of 342 in WI
Livability — Milwaukee
- Score
- 81/100
- State rank
- #55
- US rank
- #1534
Category grades
Schools grade is shown separately in the Schools card above.
Census & demographics
- Census place
- Milwaukee, WI
- County
- Milwaukee County · 926,379 people
- City population
- 573,768
- Metro
- Milwaukee-Waukesha, WI
- Population (ZIP)
- 19,887
- Household income
- $29,336
- Rent vs Own
- Severe rent burden
- 2061.0
Population outlook (Milwaukee County) Hauer SSP2
- Today (2025)
- 995,758 people
- By 2030
- 1,009,124 · +1.3%
- By 2040
- 1,028,128 · +3.3%
- By 2050
- 1,040,066 · +4.4%
- By 2075
- 1,057,849 · +6.2%
- By 2100
- 1,039,774 · +4.4%
Race, ethnicity, and origin ACS 2023
- Neighborhood character
- Predominantly Black (91%)
- Race & ethnicity
- Black 91% Two or more races 3% White 3% Hispanic / Latino 3%
- Common ancestry
- Norwegian 1%
- Foreign-born
- 1% · Canada
- Languages at home
- 97% English-only · Spanish 2%
Political lean MEDSL · Milwaukee
- 2024 margin
- Solid D (+38.5) · D 68.3% · R 29.8% · Other 1.8%
- 2008→2024 swing
- +2.7pp toward D · 2008: 35.9pp · 2024: 38.5pp
- All cycles
- 2024: D+38.5 2020: D+39.9 2016: D+37.5 2012: D+34.6 2008: D+35.9
Not yet ingested
- Civics
- —
Market trends
- HPI YoY
- ▲ 133.03%
- Current HPI
- 397.7151
- Rent YoY
- ▲ 8.28%
- Metro
- Milwaukee-Waukesha, WI
- State GDP YoY
- ▲ 2.10%
- F500 in state
- 20
Industry mix (Fortune 500 HQ in WI)
| Industry | F500 HQs | Revenue |
|---|---|---|
| Industrial Machinery | 4 | $23B |
|
||
| Industrial Technology | 2 | $36B |
|
||
| Insurance | 1 | $36B |
|
||
| Professional Services | 1 | $19B |
|
||
| Utilities | 1 | $9B |
|
||
| Consumer Goods | 1 | $3B |
|
||
Price history
+115.9% since first listed15 events — show timeline
- 2026-03-24 Contingent — METROMLS
- 2026-03-20 Listed $174,900 METROMLS
- 2026-03-18 Coming Soon $174,900 METROMLS
- 2013-02-02 Listing Removed — METROMLS
- 2013-02-02 Listed $67,000 METROMLS
- 2013-02-02 Listing Removed — METROMLS
- 2013-02-02 Listed $90,000 METROMLS
- 2012-10-10 Listing Removed — METROMLS
- 2012-10-10 Listed $24,900 METROMLS
- 2012-10-10 Listed $90,000 METROMLS
- 2012-10-10 Listing Removed — METROMLS
- 2012-10-09 Listed $67,000 METROMLS
- 2012-10-09 Listing Removed — METROMLS
- 2008-09-05 Sold (MLS) $23,000 METROMLS
- 2006-07-24 Sold (Public Records) $81,000 Public Records
Property tax history
+13.5%/yrLatest (2024): $4,083 · +59.3% YoY. Source: county tax records.
Cash-flow waterfall
monthlySold comps — $/sqft
last 12 mo · ≤1 miLoading sold comps…