 🏢 Co-op
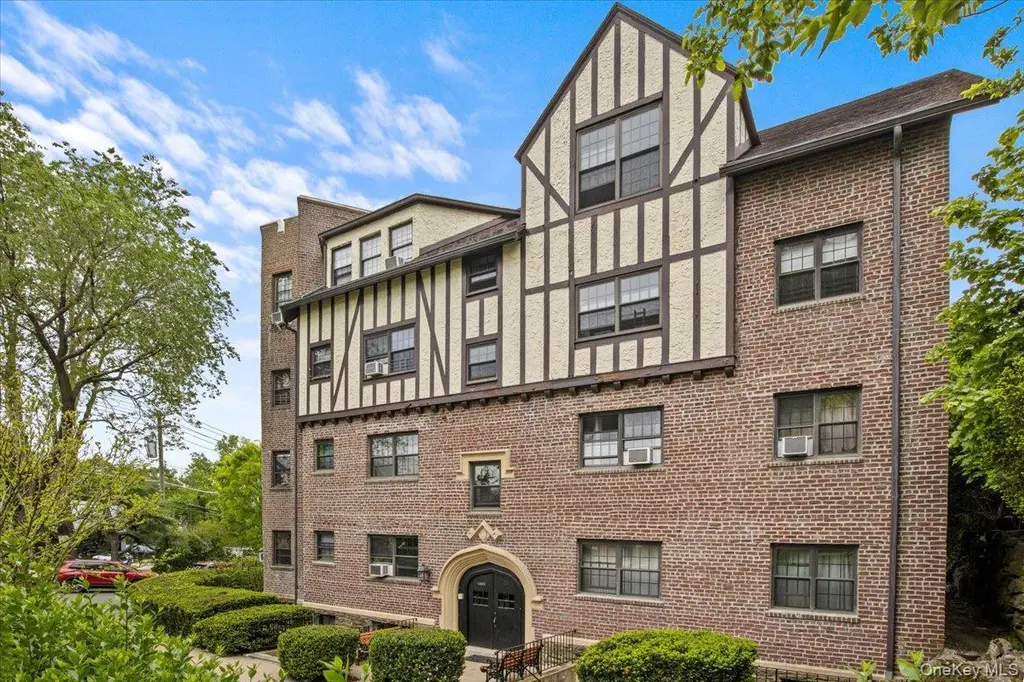
1440 Boston Post Rd Unit 2I · Larchmont, NY
Flood risk 6/10 · Moderate
- FEMA flood zone
- X (unshaded)
- Chance of flooding over 30 yrs
- 0.73%
- Est. flood insurance / yr
- $473 – $860
Fire risk 1/10 · Minimal
- Est. fire insurance / yr
- $691 – $1,283
Heat risk 6/10 · Moderate
- Hot days now (above 98°F)
- 7 days/yr
- Hot days in 30 yrs
- 16 days/yr
Wind risk 6/10 · Moderate
- Chance of severe wind over 30 yrs
- 27.0%
Air-quality risk 4/10 · Minor
- Unhealthy air days now
- 7 days/yr
- Unhealthy air days in 30 yrs
- 7 days/yr
Risk factors via First Street. Map © Google.
Why this score? — see what drove the D grade
The composite is a weighted blend of 9 inputs, each scored 0–100. Each bar is that input's sub-score; the figure is the points it added to the 100-point composite (weight × sub-score).
- Cash flow +17.7/30.0
- Schools +7.1/10.0
- DSCR +5.5/10.0
- 1% rule +4.8/10.0
- Livability +4.3/5.0
- Rent growth +2.5/5.0
- Condition / age +2.5/5.0
- ARV discount +0.0/15.0
- Appreciation +0.0/10.0
$310,000
🖨 Deal sheet 📄 Offer letter ✓ Due diligence
Listing remarks
Location! Location! Location! Larchmont Gables is a sought-after, charming, pre-war, co-op community with a resident superintendent and conveniently situated close to restaurants, schools, shopping, parks, Metro North, bus stops, Long Island Sound, and even an ice skating rink. This welcoming 2 bedroom, corner unit is freshly painted, on the second floor, is bright and sunny, has high ceilings and hardwood floors. Monthly maintenance includes taxes, heat, hot water, trash and sewer. Shareholders/residents receive immediate parking privileges, have access to bike storage and a common laundry room. As an added perk, shareholders of Larchmont Gables are eligible to join Larchmont Manor Beach e
Key facts
- Parking
- Built 1924
- Listed 21 days
Property features AI
Finance
- HOA & community: Association: Larchmont Gables; Live-in superintendent; Association fee covers common area and exterior maintenance, grounds care, heat, hot water, sewer, snow removal, trash and water; Additional monthly fuel assessment of $110
Exterior
- Parking: Carport; Off-street parking; Unassigned parking (total 1); Parking fee of $10
- Security: Building security
- Utilities: Public sewer; Utilities: see remarks
- Home design: Stock cooperative; One level (unit); 3-story building; Entry on level 2
- Construction: Brick construction; Stone construction; Stucco construction
- Exterior features: Brick, stone and stucco exterior; No waterfront; Bicycle room; Walk-up building
Interior
- Kitchen: Dishwasher; Gas oven; Gas range; Microwave; Refrigerator
- Bedrooms: Second-floor unit
- Flooring: Hardwood floors
- Bathrooms: 1 full bathroom
- Heating & cooling: Hot water heating; Oil heating; Wall/window air conditioning unit(s)
- Interior features: Built-in features; Common basement
- Laundry & utility: Laundry room; Common area laundry; Basement laundry
Neighborhood map
What this means for you Summary
Snapshot
- This is a 2-bed/1.0-bath townhouse listed at $310k.
Deal economics
- At list price, monthly cash flow is $249 ($3k/yr) — positive.
- The deal already cash-flows at list — no discount required.
- To meet the 1% rule (rent ≥ 1% of price), the offer needs to be $303k (2.4% below list).
- Recommended offer: $303k (2.4% below list) — sets the bar for 1% rule.
- Cap rate 7.3% vs local median 2.1% in Larchmont — top-decile yield for the area; either an underpriced asset or a hidden risk that comps aren't pricing in. Stress-test before assuming the spread holds.
Location & tenants
- Location reads 86/100 on livability (#18 in NY, #366 nationally) — a professional / high-income tenant draw. Strengths: crime A+, amenities A+, commute A+; Watch: cost of living F.
- Mamaroneck Union Free School District (suburban): math 74% / reading 81% proficiency, ranked #47 of 590 in NY (top 8%) — strong family-tenant draw, lease renewals of 3-5y typical; only 12% free/reduced lunch — higher-income household profile.
- Zoned schools: Central School (math 78% / reading 78%, grade A, #239 of 2,108 statewide, top 11%, 513 students, 14% FRL); Hommocks School (math 65% / reading 79%, grade A, #76 of 729 statewide, top 11%, 1,258 students, 20% FRL); Mamaroneck High School (math 95% / reading 91%, grade A+, #147 of 1,100 statewide, top 14%, 1,660 students, 23% FRL).
- Market conditions: 138 active listings in the ZIP; 12 comparable units currently listed for rent nearby; rentals lingering (median 44d on market — plan ~5-8 weeks vacancy on turnover, expect pricing pressure); 50% of comp listings sitting > 30 days — soft ceiling on asking rent; 954 units permitted in Westchester County in 2024 (649 in 5+ unit buildings).
Forward outlook
- Local home prices are declining (-3.0%/yr); year-one equity from $2k of loan paydown is wiped out by about $9k of value loss. Plan a longer hold.
- Westchester County population projected at +10% by 2050 — modest demand growth; plan on rents tracking national, not racing it.
Negotiation context
- It's been on market 22 days — a 2% lower offer ($305k) is reasonable based on typical stale-listing flexibility.
- 5 sale attempts since 26y ago; this cycle's ask is 12% above the opening price — seller raised mid-cycle; expect resistance to lowballs.
Risks & watch-outs
- Watch-outs: built in 1924 — expect roof / HVAC / electrical / plumbing capex.
- Climate carrying-cost: major flood risk; major wind risk, 27% chance of damaging wind over 30y; extreme-heat days projected 7→16/yr by 2055 (HVAC capex compounding) — expect insurance premiums to compound above CPI over the hold.
Questions for the listing agent
- Built in 1924 — when were the roof, HVAC, electrical panel, plumbing, and water heater last replaced?
- Is there a deadline driving the sale (1031 exchange, divorce, estate, relocation)? That informs how much negotiation room exists.
- Schools are A-rated — typically a magnet for longer-tenancy family renters. What's the average tenant stay here, and is there a school-zone premium baked into asking?
- The area grade is low — what's the realistic commute time and amenity access for the typical tenant pool here? Any planned neighborhood developments (good or bad) we should know about?
- What's the average days-on-market for RENTAL listings here right now (not sales)? A rising rental-DOM trend means longer vacancies and softer asking-rent achievability than the comps imply.
- What's the recent tenant-quality profile in this submarket — average credit score on applications, eviction rate, late-payment / NSF rate, and stable-employment percentage? A property-management company in the area should have these aggregated.
- How much new for-sale + rental construction is in the pipeline within 1–3 miles? Heavy new supply typically softens prices + rents 12–24 months out; constrained supply supports both.
Investment metrics
- 1% rule
- 0.98% ✗
- Cap rate
- 7.26%
- Cash-on-cash
- 3.44%
- DSCR
- 1.15
- GRM
- 8.5
CMA / ARV
- ARV (on-the-fly)
- $250,750
- Comps found
- 12
Show comp detail 12 sales within ~0.75 mi
| Address | Dist | Beds/Ba | Sqft | Sold | Price | $/sf | Match |
|---|---|---|---|---|---|---|---|
| 11 Alden Rd Unit 4D | 0.04mi | 1/1.0 (-1) | 850 (0%) | 5mo | $240,000 | $282 | 89 |
| 1444 Boston Post Rd Unit 2G | 0.02mi | 2/1.0 | 908 (+7%) | 3mo | $319,000 | $351 | 85 |
| 316 Richbell Rd Unit C2 | 0.58mi | 2/1.0 | 850 (0%) | 2mo | $251,000 | $295 | 71 |
| 336 Richbell Rd Unit C4 | 0.54mi | 2/1.0 | 850 (0%) | 6mo | $255,000 | $300 | 70 |
| 1299 Palmer Ave #124 | 0.38mi | 1/1.0 (-1) | 900 (+6%) | 1mo | $255,000 | $283 | 66 |
| 1299 Palmer Ave #328 | 0.36mi | 1/1.0 (-1) | 900 (+6%) | 5mo | $190,050 | $211 | 64 |
| 1815 Palmer Ave Unit 2V | 0.37mi | 1/1.0 (-1) | 780 (-8%) | 2mo | $230,000 | $295 | 62 |
| 21 N Chatsworth Ave Unit 4F | 0.69mi | 1/1.0 (-1) | 864 (+2%) | 5mo | $335,000 | $388 | 56 |
| 21 N Chatsworth Ave Unit 4N | 0.69mi | 1/1.0 (-1) | 900 (+6%) | 4mo | $315,000 | $350 | 50 |
| 340 Richbell Rd Unit B4 | 0.54mi | 1/1.0 (-1) | 750 (-12%) | 3mo | $160,000 | $213 | 48 |
| 342 Richbell Unit A4 | 0.54mi | 1/1.0 (-1) | 750 (-12%) | 5mo | $189,900 | $253 | 46 |
| 200 Richbell Rd Unit A2 | 0.58mi | 1/1.0 (-1) | 750 (-12%) | 4mo | $187,500 | $250 | 45 |
Match score weights: distance 35% · size 25% · config 20% · recency 20%. Top-matched comps best support the ARV.
Projected returns pro-forma
-3.0% appreciation · 3.0% rent growth · sell at horizon
- IRR
- -10.9%
- Equity multiple
- 0.60×
- Total profit
- $-34,355
- Equity at exit
- $46,222
- IRR
- -1.6%
- Equity multiple
- 0.89×
- Total profit
- $-9,343
- Equity at exit
- $26,803
Cash invested: $86,800 (down + closing). Projections, not guarantees.
Landlord ↔ Tenant lean methodology
- Overall (STATE)
- 15 Strongly Tenant-Friendly
- State New York
- 15 Strongly Tenant-Friendly · D+10
- County
- — inherits STATE
- City
- — inherits STATE
ZIP-level market 10538
- Active inventory
- 138
- Price-to-rent
- 8.5×
Monthly cashflow live
- Estimated rent
- $3,026 high interval (Pro) →
- Mortgage (P&I)
- −$1,626
- Tax est. 1.5%
- −$388 /mo · $4,650/yr
- Insurance
- −$129
- HOA
- −$0
- Vacancy / Maint / Mgmt
- −$636
- Net cashflow
- $249
Break-even live
UW: 25.0% down · 7.5% · 30yr · 1.5% tax · 5.0% vac · 8.0% maint · 8.0% mgmt
Financing live
Cash to close
- Down payment
- $77,500
- Closing costs
- $9,300
- Reserves months
- —
- Total cash needed
- —
Loan-product check · same deal, 3 products live
Conventional
25% down · 7.5% · 30yr
- Down + closing
- —
- Monthly P&I
- —
- Monthly cashflow
- —
- DSCR
- —
- Eligible?
- —
Personal DTI + credit; lowest rate.
DSCR
20% down · 8.5% · 30yr
- Down + closing
- —
- Monthly P&I
- —
- Monthly cashflow
- —
- DSCR
- —
- Eligible?
- —
No personal income docs; deal must DSCR.
Hard money
10% down · 12.0% · 12mo
- Down + closing
- —
- Monthly P&I
- —
- Monthly cashflow
- —
- DSCR
- —
- Eligible?
- —
Short-term bridge; refi at stabilization.
Rent comps 12 comps
| Address | Beds | Baths | Sqft | Rent | $/sqft | DOM | Units | Dist |
|---|---|---|---|---|---|---|---|---|
| 1833 Palmer Ave Unit 3K Larchmont, NY | 2.0 | 1.0 | 875 | $2,700 | $3.09 | 44d | 1 | 0.41mi |
| 4 Larchmont Acres Unit 4C Larchmont, NY | 2.0 | 1.0 | 1074 | $2,985 | $2.78 | 25d | 1 | 0.55mi |
| 314 Larchmont Acres Unit 4C Mamaroneck, NY | 2.0 | 1.0 | 1074 | $2,985 | $2.78 | 25d | 1 | 0.57mi |
| 5 Lester Pl Unit 1 Larchmont, NY | 2.0 | 1.0 | 850 | $3,200 | $3.76 | 25d | 1 | 0.85mi |
| 505 Rockland Ave Unit 2 Mamaroneck, NY | 1.0 | 1.0 | 700 | $2,800 | $4.00 | 44d | 1 | 0.94mi |
| 412 Munro Ave Apt 3F Mamaroneck, NY | 1.0 | 1.0 | 750 | $2,950 | $3.93 | 44d | 1 | 1.12mi |
| 300 Livingston Ave Unit 3E Mamaroneck, NY | 1.0 | 1.0 | 946 | $3,600 | $3.81 | 44d | 1 | 1.20mi |
| 338 Palmer Ave Unit B Mamaroneck, NY | 2.0 | 1.0 | 900 | $3,700 | $4.11 | 25d | 1 | 1.28mi |
| 225 Stanley Ave #313 Mamaroneck, NY | 1.0 | 1.0 | 825 | $3,500 | $4.24 | 25d | 1 | 1.39mi |
| 110 Stonelea Pl Unit 3B New Rochelle, NY | 2.0 | 1.0 | 800 | $2,650 | $3.31 | 44d | 1 | 1.46mi |
| 120 Stonelea Pl Apt 3M New Rochelle, NY | 1.0 | 1.0 | 750 | $2,300 | $3.07 | 19d | 1 | 1.46mi |
| 172 E Prospect Ave Unit 304 Mamaroneck, NY | 1.0 | 2.0 | 925 | $3,620 | $3.91 | 44d | 1 | 1.47mi |
Listing history 27 events
-
2026-06-18days on market $310,000 Active 22 DOM
-
2026-06-17days on market $310,000 Active 21 DOM
-
2026-06-16days on market $310,000 Active 20 DOM
-
2026-06-15days on market $310,000 Active 19 DOM
-
2026-06-13days on market $310,000 Active 17 DOM
-
2026-06-09days on market $310,000 Active 13 DOM
-
2026-06-08days on market $310,000 Active 12 DOM
-
2026-06-07days on market $310,000 Active 11 DOM
-
2026-06-04days on market $310,000 Active 8 DOM
-
2026-06-03days on market $310,000 Active 7 DOM
-
2026-06-02days on market $310,000 Active 6 DOM
-
2026-06-01days on market $310,000 Active 5 DOM
-
2026-05-31days on market $310,000 Active 4 DOM
-
2026-05-24historical $310,000
-
2021-11-15historical
-
2021-11-05price $269,000
-
2021-08-06status Active
-
2021-07-13historical
-
2021-05-20$278,000 Active
-
2019-05-07historical
-
2019-01-19$279,000 Active
-
2006-04-01soldstatus $275,000
-
2006-01-30historical
-
2005-06-14$275,000
-
2000-10-26soldstatus $74,000
-
2000-10-26price $79,500
-
2000-07-10$74,000
ⓘ Source: listings_history table (triggers on properties + properties_extension) + one-shot
backfill from property_details.listing_events for pre-trigger history.
Climate risk First Street
- Flood 6/10 Major FEMA zone X (unshaded) · 73% chance over 30 yrs
- Wildfire 1/10 Low
- Heat 6/10 Major 7 d/yr ≥98°F today · 16 d/yr by 30 yrs out
- Wind 6/10 Major 27% chance of damaging wind over 30 yrs
- Air quality 4/10 Moderate 7 unhealthy d/yr today · 7 by 30 yrs out
Nearby sold comps map
Loading sold comps map…
Walkable amenities ~0.75 mi
Loading nearby amenities…
Taxation est. · year 1
- Rental income
- $36,318
- − Mortgage interest
- −$17,365
- − Property taxes
- −$4,650
- − Insurance
- −$1,550
- − Repairs & maintenance
- −$2,905
- − Management
- −$2,905
- − Depreciation
- −$9,018
- Taxable loss
- −$2,076
- Est. tax savings @ 24.0%
- +$498
- After-tax cash flow
- $3,481/yr
For passive investors: Depreciation is non-cash, so a rental often shows a tax loss while cash-flowing — sheltering income. Rental losses are passive: they offset passive income freely, and up to $25,000/yr can offset ordinary (W-2) income if you actively participate and your MAGI is under $100k (phasing out to $0 by $150k); unused losses carry forward. On sale, claimed depreciation is recaptured at up to 25%, and gains may owe capital-gains tax (a 1031 exchange can defer both). Figures are a year-1 estimate at your 24.0% rate — not tax advice; consult a CPA.
Schools (NCES district)
- District
- Mamaroneck Union Free School District
- NCES district ID
- 3618240
- Math proficiency
- 74% ▼ -4.00%
- Reading proficiency
- 81% ▲ 9.00%
- Median HH income
- $111,011
- Composite
- 71.4/100
- National rank
- #228
- State rank
- #47 of 590 in NY
Livability — Larchmont
- Score
- 86/100
- State rank
- #18
- US rank
- #366
Category grades
Schools grade is shown separately in the Schools card above.
Census & demographics
- Population (ZIP)
- 17,709
Population outlook (Westchester County) Hauer SSP2
- Today (2025)
- 1,028,035 people
- By 2030
- 1,051,636 · +2.3%
- By 2040
- 1,098,520 · +6.9%
- By 2050
- 1,136,044 · +10.5%
- By 2075
- 1,196,925 · +16.4%
- By 2100
- 1,175,147 · +14.3%
Race, ethnicity, and origin ACS 2023
- Neighborhood character
- Predominantly White (78%)
- Race & ethnicity
- White 78% Two or more races 10% Hispanic / Latino 9% Black 4% Asian 4%
- Hispanic origin (detail)
- Puerto Rican 3%
- Common ancestry
- Scotch-Irish 5% Italian 3% Romanian 3%
- Foreign-born
- 16% · Canada, Jamaica, China
- Languages at home
- 83% English-only · Spanish 5% Other Indo-European 4% French/Haitian/Cajun 2%
Political lean MEDSL · Westchester
- 2024 margin
- Strong D (+26.3) · D 63.1% · R 36.9%
- 2008→2024 swing
- -1.3pp toward R · 2008: 27.6pp · 2024: 26.3pp
- All cycles
- 2024: D+26.3 2020: D+36.3 2016: D+32.8 2012: D+22.2 2008: D+27.6
Not yet ingested
- Civics
- —
Market trends
- HPI YoY
- ▼ -535.56%
- Current HPI
- 325.1393
- Rent YoY
- —
- Metro
- —
- State GDP YoY
- ▲ 2.60%
- F500 in state
- 92
Industry mix (Fortune 500 HQ in NY)
| Industry | F500 HQs | Revenue |
|---|---|---|
| Financial Services | 10 | $950B |
|
||
| Consumer Goods | 9 | $162B |
|
||
| Insurance | 4 | $225B |
|
||
| Telecommunications | 2 | $144B |
|
||
| Pharmaceuticals | 2 | $112B |
|
||
| Media / Entertainment | 2 | $69B |
|
||
Price history
+318.9% since first listed14 events — show timeline
- 2026-05-24 Coming Soon $310,000 OneKey® MLS as Distributed by MLS Grid
- 2021-11-15 Listing Removed — OneKey® MLS as Distributed by MLS Grid
- 2021-11-05 Price Changed $269,000 OneKey® MLS as Distributed by MLS Grid
- 2021-08-06 Relisted — OneKey® MLS as Distributed by MLS Grid
- 2021-07-13 Listing Removed — OneKey® MLS as Distributed by MLS Grid
- 2021-05-20 Listed $278,000 OneKey® MLS as Distributed by MLS Grid
- 2019-05-07 Listing Removed — OneKey® MLS as Distributed by MLS Grid
- 2019-01-19 Listed $279,000 OneKey® MLS as Distributed by MLS Grid
- 2006-04-01 Sold (MLS) $275,000 HGMLS
- 2006-01-30 Delisted — HGMLS
- 2005-06-14 Listed $275,000 HGMLS
- 2000-10-26 Price Changed $79,500 HGMLS
- 2000-10-26 Sold (MLS) $74,000 HGMLS
- 2000-07-10 Listed $74,000 HGMLS
Cash-flow waterfall
monthlySold comps — $/sqft
last 12 mo · ≤1 miLoading sold comps…