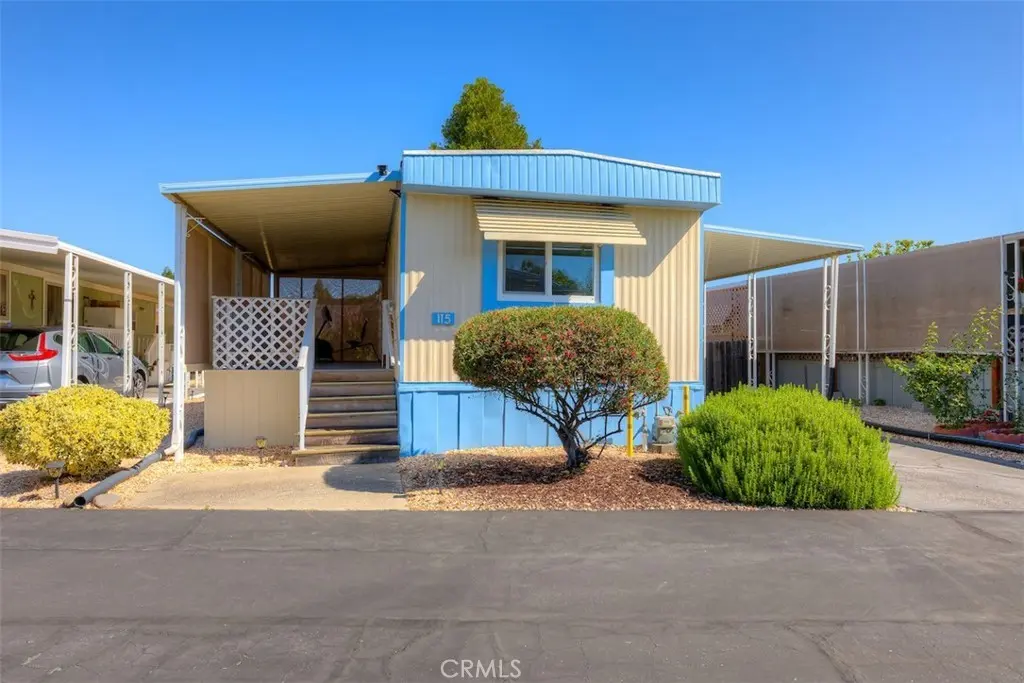
1675 Manzanita Ave #115 · Chico, CA
Flood risk 5/10 · Moderate
- FEMA flood zone
- X (shaded)
- Chance of flooding over 30 yrs
- 0.24%
- Est. flood insurance / yr
- $507 – $1,088
Fire risk 8/10 · Major
- Est. fire insurance / yr
- $659 – $1,223
Heat risk 8/10 · Major
- Hot days now (above 104°F)
- 4 days/yr
- Hot days in 30 yrs
- 9 days/yr
Wind risk 1/10 · Minimal
- Chance of severe wind over 30 yrs
- —
Air-quality risk 10/10 · Severe
- Unhealthy air days now
- 37 days/yr
- Unhealthy air days in 30 yrs
- 39 days/yr
Risk factors via First Street. Map © Google.
Why this score? — see what drove the B grade
The composite is a weighted blend of 9 inputs, each scored 0–100. Each bar is that input's sub-score; the figure is the points it added to the 100-point composite (weight × sub-score).
- Cash flow +30.0/30.0
- 1% rule +10.0/10.0
- DSCR +10.0/10.0
- ARV discount +7.5/15.0
- Schools +4.6/10.0
- Livability +3.6/5.0
- Rent growth +3.5/5.0
- Condition / age +2.5/5.0
- Appreciation +0.0/10.0
$41,500
🖨 Deal sheet 📄 Offer letter ✓ Due diligence
Listing remarks MLS
SELLER MOTIVATED. .. BRING ALL OFFERS Cute and Cozy very clean home in one of Chico's nicest senior mobile home parks. Newly painted living room and kitchen cabinets, new screens on porch, new redwood stairs on front porch and carport entries. New dual pane windows. A/C serviced 9/20. Low maintenance yard. Drip irrigation. Must see to appreciate.
Key facts
- Spacious backyard
- Private front porch
- Gas range
Tags
Property features AI
Finance
- Other: Park name: Pleasant Valley Mobile Park; Rural setting with street lighting; Manager approval required for tenancy; Pets allowed — contact park (call)
- Financial info: Land lease: $961 monthly (park-managed)
- HOA & community: Senior community; Clubhouse; Common RV parking; Association spa; Pet rules
Exterior
- Parking: Two uncovered spaces; Two carport spaces; Driveway; RV access/parking; Total of 4 parking spaces
- Security: Smoke detector(s); Carbon monoxide detector(s)
- Utilities: Natural gas connected; Electricity connected; Water connected (District/Public); Public sewer; 220V in laundry
- Home design: Single-story mobile home; Mobile home model 'Buddy' (12' x 52'); Mobile home remains on site; One total story; Has a view; Entry at ground level
- Construction: One shed on the property; Living area per assessor's data
- Exterior features: Awning; Rain gutters; Covered front porch; Screened patio; Deck; Back yard; Pool access via association
Interior
- Kitchen: Garbage disposal; Refrigerator; Range with hood; Gas range; Water heater unit
- Bedrooms: One-level home
- Flooring: Laminate flooring
- Bathrooms: Walk-in shower; Shower; Vanity area; Linen closet/storage
- Heating & cooling: Central heating (furnace); Central cooling
- Interior features: Pantry; Open floor plan; Double pane windows with blinds and screens; Smoke and carbon monoxide detectors; Association spa
- Laundry & utility: Washer hookup; Electric dryer hookup (220V in laundry); In-closet laundry
Neighborhood map
What this means for you Summary
Snapshot
- This is a 1-bed/1.0-bath manufactured listed at $42k.
Deal economics
- At list price, monthly cash flow is $731 ($9k/yr) — positive.
- The deal already cash-flows at list — no discount required.
- Meets the 1% rule at list price ($1k rent vs $42k).
- Cap rate 27.4% vs local median 2.6% in Chico — top-decile yield for the area; either an underpriced asset or a hidden risk that comps aren't pricing in. Stress-test before assuming the spread holds.
Location & tenants
- Location reads 72/100 on livability (#195 in CA) — a middle-class / working-renter tenant base. Strengths: amenities A+, commute A+, health & safety A-; Watch: employment C-, crime F, cost of living F.
- Chico Unified (urban): math 40% / reading 70% proficiency, ranked #117 of 517 in CA (top 23%) — acceptable for families but not a draw, mixed tenant base, ~2y average lease.
- Market conditions: Rents rising (+4.0%/yr); 90 active listings in the ZIP; 1 comparable units currently listed for rent nearby; 946 units permitted in Butte County in 2024 (254 in 5+ unit buildings).
Forward outlook
- Local home prices are declining (-3.0%/yr); year-one equity from $287 of loan paydown is wiped out by about $1k of value loss. Plan a longer hold.
- Butte County population projected at +10% by 2050 — modest demand growth; plan on rents tracking national, not racing it.
- At projected returns (-3.0% appreciation + 4.0% rent growth), your $12k cash investment doubles in ~2 years — after that, you're playing with house money.
Negotiation context
- Only 11 days on market — expect competitive offers; lowballing is unlikely to land.
- 5 sale attempts since 17y ago with the ask held roughly flat each time — persistent listings suggest the price (not the market) is what's stuck; bring a comps-based counter.
Risks & watch-outs
- Climate carrying-cost: moderate flood risk; severe wildfire risk; extreme-heat days projected 4→9/yr by 2055 (HVAC capex compounding) — expect insurance premiums to compound above CPI over the hold.
Questions for the listing agent
- Built in 1979 — when were the roof, HVAC, electrical panel, plumbing, and water heater last replaced?
- Is there a deadline driving the sale (1031 exchange, divorce, estate, relocation)? That informs how much negotiation room exists.
- Schools are B-rated — typically a magnet for longer-tenancy family renters. What's the average tenant stay here, and is there a school-zone premium baked into asking?
- Crime grade is F in this area — have there been break-ins, vandalism, or insurance claims at this property in the last 3 years? What carrier currently insures it and at what premium?
- What's the average days-on-market for RENTAL listings here right now (not sales)? A rising rental-DOM trend means longer vacancies and softer asking-rent achievability than the comps imply.
- What's the recent tenant-quality profile in this submarket — average credit score on applications, eviction rate, late-payment / NSF rate, and stable-employment percentage? A property-management company in the area should have these aggregated.
- How much new for-sale + rental construction is in the pipeline within 1–3 miles? Heavy new supply typically softens prices + rents 12–24 months out; constrained supply supports both.
Investment metrics
- 1% rule
- 3.05% ✓
- Cap rate
- 27.42%
- Cash-on-cash
- 75.45%
- DSCR
- 4.36
- GRM
- 2.7
CMA / ARV
No comps found within radius.
Projected returns pro-forma
-3.0% appreciation · 3.98% rent growth · sell at horizon
- IRR
- 76.4%
- Equity multiple
- 4.53×
- Total profit
- $41,074
- Equity at exit
- $6,188
- IRR
- 80.3%
- Equity multiple
- 9.69×
- Total profit
- $100,984
- Equity at exit
- $3,588
Cash invested: $11,620 (down + closing). Projections, not guarantees.
Landlord ↔ Tenant lean methodology
- Overall (STATE)
- 18 Strongly Tenant-Friendly
- State California
- 18 Strongly Tenant-Friendly · D+13
- County
- — inherits STATE
- City
- — inherits STATE
ZIP-level market 95926
- Rents YoY
- 4.0%
- Active inventory
- 90
- Price-to-rent
- 2.7×
Monthly cashflow live
- Estimated rent
- $1,264 medium interval (Pro) →
- Mortgage (P&I)
- −$218
- Tax from tax record
- −$33 /mo · $398/yr
- Insurance
- −$17
- HOA
- −$0
- Vacancy / Maint / Mgmt
- −$265
- Net cashflow
- $731
Break-even live
UW: 25.0% down · 7.5% · 30yr · 1.5% tax · 5.0% vac · 8.0% maint · 8.0% mgmt
Financing live
Cash to close
- Down payment
- $10,375
- Closing costs
- $1,245
- Reserves months
- —
- Total cash needed
- —
Loan-product check · same deal, 3 products live
Conventional
25% down · 7.5% · 30yr
- Down + closing
- —
- Monthly P&I
- —
- Monthly cashflow
- —
- DSCR
- —
- Eligible?
- —
Personal DTI + credit; lowest rate.
DSCR
20% down · 8.5% · 30yr
- Down + closing
- —
- Monthly P&I
- —
- Monthly cashflow
- —
- DSCR
- —
- Eligible?
- —
No personal income docs; deal must DSCR.
Hard money
10% down · 12.0% · 12mo
- Down + closing
- —
- Monthly P&I
- —
- Monthly cashflow
- —
- DSCR
- —
- Eligible?
- —
Short-term bridge; refi at stabilization.
Rent comps 1 comps
| Address | Beds | Baths | Sqft | Rent | $/sqft | DOM | Units | Dist |
|---|---|---|---|---|---|---|---|---|
| 2777 Eaton Rd Chico, CA | 1.0–2.0 | 1.0–2.0 | 790 | $1,403 | $1.78 | 13d | 3 | 1.44mi |
Listing history 10 events
-
2026-06-19days on market $41,500 Active 11 DOM
-
2026-06-18days on market $41,500 Active 10 DOM
-
2026-06-17days on market $41,500 Active 9 DOM
-
2026-06-16days on market $41,500 Active 8 DOM
-
2026-06-15days on market $41,500 Active 7 DOM
-
2026-06-14days on market $41,500 Active 5 DOM
-
2026-06-13days on market $41,500 Active 4 DOM
-
2026-06-10days on market $41,500 Active 2 DOM
-
2026-06-09remarks 693-char remark
-
2026-06-09$41,500 Active 1 DOM
ⓘ Source: listings_history table (triggers on properties + properties_extension) + one-shot
backfill from property_details.listing_events for pre-trigger history.
Tax reassessment forecast CA · Resets to sale price
- Current annual tax
- $398 · $33/mo
- Projected year-2 tax
- $398 · $33/mo
- Expected delta
- $0/yr ($0/mo · 0.0%)
ⓘ Screening estimate from a state-policy table — verify with the county assessor before closing.
Climate risk First Street
- Flood 5/10 Major FEMA zone X (shaded) · 24% chance over 30 yrs
- Wildfire 8/10 Severe
- Heat 8/10 Severe 4 d/yr ≥104°F today · 9 d/yr by 30 yrs out
- Wind 1/10 Low
- Air quality 10/10 Extreme 37 unhealthy d/yr today · 39 by 30 yrs out
Nearby sold comps map
Loading sold comps map…
Walkable amenities ~0.75 mi
Loading nearby amenities…
Taxation est. · year 1
- Rental income
- $15,170
- − Mortgage interest
- −$2,325
- − Property taxes
- −$398
- − Insurance
- −$208
- − Repairs & maintenance
- −$1,214
- − Management
- −$1,214
- − Depreciation
- −$1,207
- Taxable income
- $8,605
- Est. tax owed @ 24.0%
- −$2,065
- After-tax cash flow
- $6,702/yr
For passive investors: Depreciation is non-cash, so a rental often shows a tax loss while cash-flowing — sheltering income. Rental losses are passive: they offset passive income freely, and up to $25,000/yr can offset ordinary (W-2) income if you actively participate and your MAGI is under $100k (phasing out to $0 by $150k); unused losses carry forward. On sale, claimed depreciation is recaptured at up to 25%, and gains may owe capital-gains tax (a 1031 exchange can defer both). Figures are a year-1 estimate at your 24.0% rate — not tax advice; consult a CPA.
Schools (NCES district)
- District
- Chico Unified
- NCES district ID
- 0608370
- Math proficiency
- 40% ▼ -2.00%
- Reading proficiency
- 70% ▲ 14.00%
- Median HH income
- $46,223
- Composite
- 46.45/100
- National rank
- #2443
- State rank
- #117 of 517 in CA
Livability — Chico
- Score
- 72/100
- State rank
- #195
- US rank
- #6332
Category grades
Schools grade is shown separately in the Schools card above.
Census & demographics
- Census place
- Chico, CA
- County
- Butte County · 175,030 people
- City population
- 117,007
- Metro
- Chico, CA
- Population (ZIP)
- 40,567
- Household income
- $61,920
- Rent vs Own
- Severe rent burden
- 3912.0
Population outlook (Butte County) Hauer SSP2
- Today (2025)
- 237,527 people
- By 2030
- 243,804 · +2.6%
- By 2040
- 253,899 · +6.9%
- By 2050
- 262,561 · +10.5%
- By 2075
- 283,709 · +19.4%
- By 2100
- 282,689 · +19.0%
Race, ethnicity, and origin ACS 2023
- Neighborhood character
- Predominantly White (65%)
- Race & ethnicity
- White 65% Hispanic / Latino 20% Two or more races 13% Asian 6% Black 3%
- Hispanic origin (detail)
- Mexican 16% Puerto Rican 1%
- Common ancestry
- Italian 4% Portuguese 3% Lithuanian 2%
- Foreign-born
- 7% · Canada, China
- Languages at home
- 83% English-only · Spanish 10% Other Asian/Pacific 2% Chinese 1%
Political lean MEDSL · Butte
- 2024 margin
- Toss-up / Even · D 46.8% · R 49.9% · Other 3.3%
- 2008→2024 swing
- -5.5pp toward R · 2008: 2.4pp · 2024: -3.1pp
- All cycles
- 2024: R+3.1 2020: D+1.7 2016: R+4.0 2012: R+3.9 2008: D+2.4
Not yet ingested
- Civics
- —
Market trends
- HPI YoY
- ▼ -453.39%
- Current HPI
- 256.0261
- Rent YoY
- ▲ 3.98%
- Metro
- Chico, CA
- State GDP YoY
- ▲ 3.21%
- F500 in state
- 116
Industry mix (Fortune 500 HQ in CA)
| Industry | F500 HQs | Revenue |
|---|---|---|
| Technology | 27 | $1,492B |
|
||
| Financial Services | 3 | $174B |
|
||
| Retail | 3 | $44B |
|
||
| Insurance | 3 | $26B |
|
||
| Media / Entertainment | 2 | $115B |
|
||
| Pharmaceuticals / Biotech | 2 | $62B |
|
||
Price history
+112.8% since first listed20 events — show timeline
- 2026-06-08 Listed $41,500 CRMLS
- 2021-09-29 Sold (MLS) $40,000 CRMLS
- 2021-09-27 Pending — CRMLS
- 2021-09-10 Contingent — CRMLS
- 2021-09-09 Pending — CRMLS
- 2021-09-06 Price Changed $42,500 CRMLS
- 2021-08-27 Price Changed $44,500 CRMLS
- 2021-08-16 Listed $49,900 CRMLS
- 2016-12-22 Sold (MLS) $15,500 CRMLS
- 2016-12-12 Pending — CRMLS
- 2016-10-14 Listed $17,950 CRMLS
- 2015-11-25 Sold (MLS) $6,500 CRMLS
- 2015-11-12 Pending — CRMLS
- 2015-11-10 Price Changed $6,500 CRMLS
- 2015-11-03 Price Changed $10,000 CRMLS
- 2015-10-08 Price Changed $12,000 CRMLS
- 2015-09-24 Price Changed $16,500 CRMLS
- 2015-09-16 Listed $19,500 CRMLS
- 2010-02-26 Sold (MLS) $17,500 CRMLS
- 2009-09-30 Listed $19,500 CRMLS
Property tax history
+12.8%/yrLatest (2025): $398 · +6.8% YoY. Source: county tax records.
Cash-flow waterfall
monthlySold comps — $/sqft
last 12 mo · ≤1 miLoading sold comps…