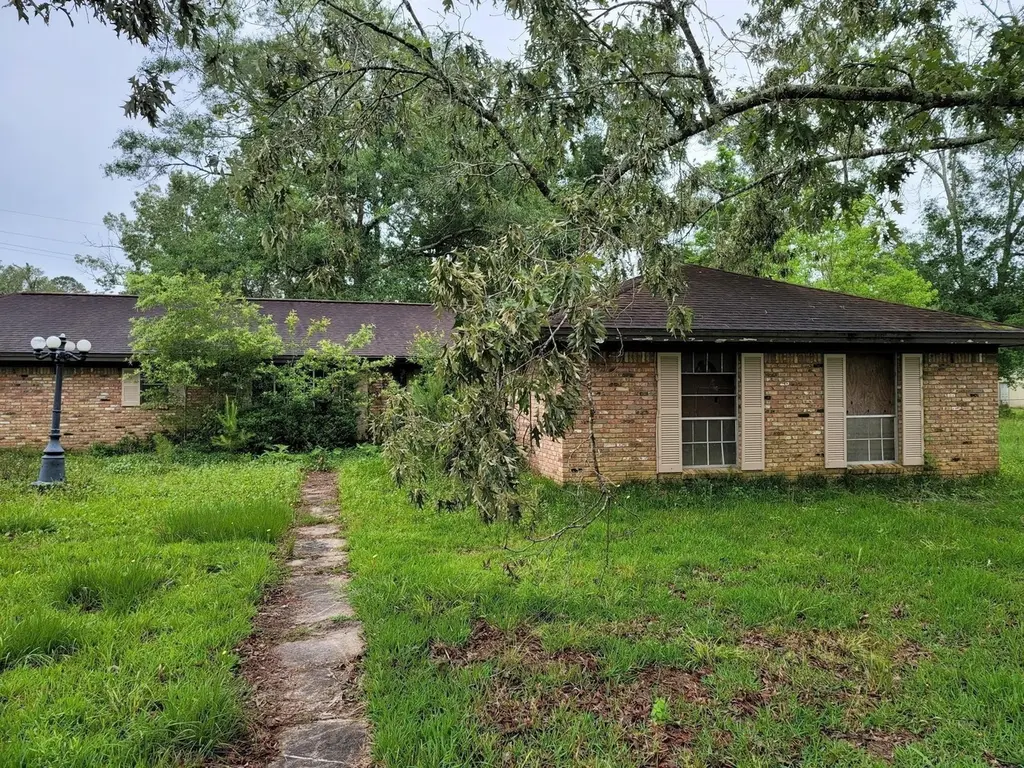
13325 River Oaks Blvd · Bevil Oaks, TX
Flood risk 8/10 · Major
- FEMA flood zone
- —
- Chance of flooding over 30 yrs
- 0.99%
- Est. flood insurance / yr
- —
Fire risk 2/10 · Minimal
- Est. fire insurance / yr
- $1,222 – $2,270
Heat risk 9/10 · Severe
- Hot days now (above 110°F)
- 7 days/yr
- Hot days in 30 yrs
- 25 days/yr
Wind risk 9/10 · Severe
- Chance of severe wind over 30 yrs
- 99.0%
Air-quality risk 2/10 · Minimal
- Unhealthy air days now
- 1 days/yr
- Unhealthy air days in 30 yrs
- 1 days/yr
Risk factors via First Street. Map © Google.
Why this score? — see what drove the B grade
The composite is a weighted blend of 9 inputs, each scored 0–100. Each bar is that input's sub-score; the figure is the points it added to the 100-point composite (weight × sub-score).
- Cash flow +30.0/30.0
- 1% rule +10.0/10.0
- DSCR +10.0/10.0
- ARV discount +7.5/15.0
- Schools +4.5/10.0
- Livability +3.2/5.0
- Rent growth +2.7/5.0
- Condition / age +2.5/5.0
- Appreciation +0.0/10.0
$115,000
🖨 Deal sheet 📄 Offer letter ✓ Due diligence
Listing remarks MLS
Investor special!!! House is completely gutted and ready for a new makeover! Property includes a shop and storage shed. Property being sold AS-IS (seller will make no repairs). Must be Cash or Hard money only. MAKE AN OFFER!
Key facts
- Shop
- Completely gutted
- Storage shed
Tags
Neighborhood map
What this means for you Summary
Snapshot
- This is a 3-bed/2.5-bath single-family listed at $115k.
Deal economics
- At list price, monthly cash flow is $657 ($8k/yr) — positive.
- The deal already cash-flows at list — no discount required.
- Meets the 1% rule at list price ($2k rent vs $115k).
Location & tenants
- Location reads 65/100 on livability (#689 in TX) — a middle-class / working-renter tenant base. Strengths: crime A+, housing A+, employment A-; Watch: schools D+, amenities F, commute F.
- Hardin-Jefferson ISD (rural): math 54% / reading 49% proficiency, ranked #135 of 826 in TX (top 16%) — acceptable for families but not a draw, mixed tenant base, ~2y average lease.
- Market conditions: Rents flat; 285 active listings in the ZIP; 1 comparable units currently listed for rent nearby; solid renter incomes; 343 units permitted in Jefferson County in 2024 (0 in 5+ unit buildings).
Forward outlook
- Local home prices are declining (-3.0%/yr); year-one equity from $795 of loan paydown is wiped out by about $3k of value loss. Plan a longer hold.
- At projected returns (-3.0% appreciation + 0.8% rent growth), your $32k cash investment doubles in ~6 years — after that, you're playing with house money.
Negotiation context
- Only 7 days on market — expect competitive offers; lowballing is unlikely to land.
- 11 sale attempts since 5y ago with the ask held roughly flat each time — persistent listings suggest the price (not the market) is what's stuck; bring a comps-based counter.
Risks & watch-outs
- Climate carrying-cost: severe flood risk; severe wind risk, 99% chance of damaging wind over 30y; extreme-heat days projected 7→25/yr by 2055 (HVAC capex compounding) — expect insurance premiums to compound above CPI over the hold.
Questions for the listing agent
- Built in 1965 — when were the roof, HVAC, electrical panel, plumbing, and water heater last replaced?
- Is there a deadline driving the sale (1031 exchange, divorce, estate, relocation)? That informs how much negotiation room exists.
- Schools are D-rated, which usually means shorter tenancies and higher turnover. Who's the typical renter profile here, and what's been the actual vacancy rate?
- What's the average days-on-market for RENTAL listings here right now (not sales)? A rising rental-DOM trend means longer vacancies and softer asking-rent achievability than the comps imply.
- What's the recent tenant-quality profile in this submarket — average credit score on applications, eviction rate, late-payment / NSF rate, and stable-employment percentage? A property-management company in the area should have these aggregated.
- How much new for-sale + rental construction is in the pipeline within 1–3 miles? Heavy new supply typically softens prices + rents 12–24 months out; constrained supply supports both.
Investment metrics
- 1% rule
- 1.57% ✓
- Cap rate
- 13.15%
- Cash-on-cash
- 24.50%
- DSCR
- 2.09
- GRM
- 5.3
CMA / ARV
- ARV (median comp)
- $254,877
- List price
- $115,000
- Delta
- -54.88%
- Verdict
- UNDERPRICED
- Comps
- 20 within 1.0 mi
Show comp detail 7 sales within ~0.75 mi
| Address | Dist | Beds/Ba | Sqft | Sold | Price | $/sf | Match |
|---|---|---|---|---|---|---|---|
| 13370 Capital Dr | 0.21mi | 4/2.0 (+1) | 2,299 (-2%) | 11mo | $270,000 | $117 | 70 |
| 13525 Leaning Oaks Dr | 0.53mi | 4/2.5 (+1) | 2,399 (+2%) | 4mo | $279,900 | $117 | 64 |
| 13375 Craig Ln | 0.14mi | 4/2.5 (+1) | 2,068 (-12%) | 5mo | $225,000 | $109 | 64 |
| 13340 Moss Hill Dr | 0.28mi | 4/2.5 (+1) | 2,240 (-5%) | 14mo | $305,000 | $136 | 62 |
| 13455 Alaskan Dr | 0.71mi | 3/2.0 | 2,291 (-3%) | 7mo | $315,000 | $137 | 54 |
| 13365 Chimney Rock Dr | 0.50mi | 4/3.0 (+1) | 2,444 (+4%) | 12mo | $229,000 | $94 | 53 |
| 7125 Sweetgum Rd | 0.74mi | 4/3.0 (+1) | 2,184 (-7%) | 17mo | $275,500 | $126 | 32 |
Match score weights: distance 35% · size 25% · config 20% · recency 20%. Top-matched comps best support the ARV.
Projected returns pro-forma
-3.0% appreciation · 0.79% rent growth · sell at horizon
- IRR
- 15.4%
- Equity multiple
- 1.60×
- Total profit
- $19,317
- Equity at exit
- $17,147
- IRR
- 22.4%
- Equity multiple
- 2.72×
- Total profit
- $55,363
- Equity at exit
- $9,943
Cash invested: $32,200 (down + closing). Projections, not guarantees.
Landlord ↔ Tenant lean methodology
- Overall (STATE)
- 87 Strongly Landlord-Friendly
- State Texas
- 87 Strongly Landlord-Friendly · R+5
- County
- — inherits STATE
- City
- — inherits STATE
ZIP-level market 77713
- Home prices YoY
- -19.3%
- Rents YoY
- 0.8%
- Active inventory
- 285
- Price-to-rent
- 5.3×
Monthly cashflow live
- Estimated rent
- $1,805 medium interval (Pro) →
- Mortgage (P&I)
- −$603
- Tax from tax record
- −$117 /mo · $1,410/yr
- Insurance
- −$48
- HOA
- −$0
- Vacancy / Maint / Mgmt
- −$379
- Net cashflow
- $657
Break-even live
UW: 25.0% down · 7.5% · 30yr · 1.5% tax · 5.0% vac · 8.0% maint · 8.0% mgmt
Financing live
Cash to close
- Down payment
- $28,750
- Closing costs
- $3,450
- Reserves months
- —
- Total cash needed
- —
Loan-product check · same deal, 3 products live
Conventional
25% down · 7.5% · 30yr
- Down + closing
- —
- Monthly P&I
- —
- Monthly cashflow
- —
- DSCR
- —
- Eligible?
- —
Personal DTI + credit; lowest rate.
DSCR
20% down · 8.5% · 30yr
- Down + closing
- —
- Monthly P&I
- —
- Monthly cashflow
- —
- DSCR
- —
- Eligible?
- —
No personal income docs; deal must DSCR.
Hard money
10% down · 12.0% · 12mo
- Down + closing
- —
- Monthly P&I
- —
- Monthly cashflow
- —
- DSCR
- —
- Eligible?
- —
Short-term bridge; refi at stabilization.
Rent comps 1 comps
| Address | Beds | Baths | Sqft | Rent | $/sqft | DOM | Units | Dist |
|---|---|---|---|---|---|---|---|---|
| 13620 Thousand Oaks Dr Beaumont, TX | 3.0 | 2.0 | 2103 | $2,300 | $1.09 | 12d | 1 | 1.08mi |
Listing history 39 events
-
2026-06-18days on market $115,000 Active 7 DOM
-
2026-06-17days on market $115,000 Active 6 DOM
-
2026-06-16days on market $115,000 Active 5 DOM
-
2026-06-15days on market $115,000 Active 4 DOM
-
2026-06-14days on market $115,000 Active 2 DOM
-
2026-06-13days on market $115,000 Active 1 DOM
-
2026-06-10days on market $115,000 Active 98 DOM
-
2026-06-09days on market $115,000 Active 97 DOM
-
2026-06-08days on market $115,000 Active 96 DOM
-
2026-06-07days on market $115,000 Active 95 DOM
-
2026-06-03days on market $115,000 Active 91 DOM
-
2026-06-02days on market $115,000 Active 90 DOM
-
2026-06-01days on market $115,000 Active 89 DOM
-
2026-05-31days on market $115,000 Active 88 DOM
-
2026-05-30days on market $115,000 Active 87 DOM
-
2026-03-04$115,000 Active 224-char remark
Show marketing remark (224 chars)
Investor special!!! House is completely gutted and ready for a new makeover! Property includes a shop and storage shed. Property being sold AS-IS (seller will make no repairs). Must be Cash or Hard money only. MAKE AN OFFER!
-
2026-03-04historical
Show marketing remark (224 chars)
Investor special!!! House is completely gutted and ready for a new makeover! Property includes a shop and storage shed. Property being sold AS-IS (seller will make no repairs). Must be Cash or Hard money only. MAKE AN OFFER!
-
2026-01-20$115,000 Active
-
2026-01-20historical
-
2025-12-29$115,000 Active
-
2025-12-29historical
-
2025-12-05status Active
-
2025-11-24status Pending
-
2025-11-21$115,000 Active
-
2025-11-21historical
-
2025-10-28$115,000 Active
-
2025-07-08status Pending
-
2025-05-27historical
-
2025-05-27historical
-
2025-03-12$125,000 Active
-
2025-03-12historical
-
2024-12-30$125,000 Active
-
2024-12-30historical
-
2024-05-30$125,000 Active
-
2024-05-30historical
-
2024-02-06$125,000 Active
-
2022-01-16historical
-
2021-10-14$125,000 Active
-
2021-06-16soldstatus
ⓘ Source: listings_history table (triggers on properties + properties_extension) + one-shot
backfill from property_details.listing_events for pre-trigger history.
Tax reassessment forecast TX · Resets to sale price
- Current annual tax
- $1,410 · $117/mo
- Projected year-2 tax
- $2,104 · $175/mo
- Expected delta
- +$695/yr (+$58/mo · 49.3%)
ⓘ Screening estimate from a state-policy table — verify with the county assessor before closing.
Climate risk First Street
- Flood 8/10 Severe 99% chance over 30 yrs
- Wildfire 2/10 Low
- Heat 9/10 Extreme 7 d/yr ≥110°F today · 25 d/yr by 30 yrs out
- Wind 9/10 Extreme 99% chance of damaging wind over 30 yrs
- Air quality 2/10 Low 1 unhealthy d/yr today · 1 by 30 yrs out
Nearby sold comps map
Loading sold comps map…
Walkable amenities ~0.75 mi
Loading nearby amenities…
Taxation est. · year 1
- Rental income
- $21,658
- − Mortgage interest
- −$6,442
- − Property taxes
- −$1,410
- − Insurance
- −$575
- − Repairs & maintenance
- −$1,733
- − Management
- −$1,733
- − Depreciation
- −$3,345
- Taxable income
- $6,421
- Est. tax owed @ 24.0%
- −$1,541
- After-tax cash flow
- $6,347/yr
For passive investors: Depreciation is non-cash, so a rental often shows a tax loss while cash-flowing — sheltering income. Rental losses are passive: they offset passive income freely, and up to $25,000/yr can offset ordinary (W-2) income if you actively participate and your MAGI is under $100k (phasing out to $0 by $150k); unused losses carry forward. On sale, claimed depreciation is recaptured at up to 25%, and gains may owe capital-gains tax (a 1031 exchange can defer both). Figures are a year-1 estimate at your 24.0% rate — not tax advice; consult a CPA.
Schools (NCES district)
- District
- Hardin-Jefferson ISD
- NCES district ID
- 4822410
- Math proficiency
- 54% ▼ -5.00%
- Reading proficiency
- 49% ▼ -4.00%
- Median HH income
- $61,336
- Composite
- 45.14/100
- National rank
- #2682
- State rank
- #135 of 826 in TX
Livability — Bevil Oaks
- Score
- 65/100
- State rank
- #689
- US rank
- #12889
Category grades
Schools grade is shown separately in the Schools card above.
Census & demographics
- Census place
- Bevil Oaks, TX
- County
- Jefferson County · 203,592 people
- Metro
- Beaumont-Port Arthur, TX
- Population (ZIP)
- 15,541
- Household income
- $91,330
- Rent vs Own
- Severe rent burden
- 444.0
Population outlook (Jefferson County) Hauer SSP2
- Today (2025)
- 259,015 people
- By 2030
- 260,685 · +0.6%
- By 2040
- 263,309 · +1.7%
- By 2050
- 265,237 · +2.4%
- By 2075
- 270,193 · +4.3%
- By 2100
- 255,628 · -1.3%
Race, ethnicity, and origin ACS 2023
- Neighborhood character
- Diverse neighborhood (Simpson 0.68)
- Race & ethnicity
- White 46% Black 25% Hispanic / Latino 22% Two or more races 16% Asian 3%
- Hispanic origin (detail)
- Mexican 18%
- Common ancestry
- Lithuanian 6% Serbian 2% Italian 1%
- Foreign-born
- 10% · Canada
- Languages at home
- 81% English-only · Spanish 16% Tagalog/Filipino 1% Other Asian/Pacific 1%
Political lean MEDSL · Jefferson
- 2024 margin
- Lean R (+8.9) · D 45.1% · R 54.0%
- 2008→2024 swing
- -11.1pp toward R · 2008: 2.2pp · 2024: -8.9pp
- All cycles
- 2024: R+8.9 2020: R+1.6 2016: R+0.5 2012: D+1.6 2008: D+2.2
Not yet ingested
- Civics
- —
Market trends
- HPI YoY
- ▼ -41.58%
- Current HPI
- 173.8851
- Rent YoY
- ▲ 0.79%
- Metro
- Beaumont-Port Arthur, TX
- State GDP YoY
- ▲ 3.95%
- F500 in state
- 110
Industry mix (Fortune 500 HQ in TX)
| Industry | F500 HQs | Revenue |
|---|---|---|
| Energy | 16 | $1,198B |
|
||
| Technology | 5 | $198B |
|
||
| Engineering / Construction | 4 | $72B |
|
||
| Energy Services | 3 | $60B |
|
||
| Utilities | 3 | $41B |
|
||
| Healthcare | 2 | $330B |
|
||
Price history
-8.0% since first listed24 events — show timeline
- 2026-03-04 Listing Removed — HARMLS
- 2026-03-04 Listed $115,000 HARMLS
- 2026-01-20 Listing Removed — HARMLS
- 2026-01-20 Listed $115,000 HARMLS
- 2025-12-29 Listing Removed — HARMLS
- 2025-12-29 Listed $115,000 HARMLS
- 2025-12-05 Relisted — HARMLS
- 2025-11-24 Pending — HARMLS
- 2025-11-21 Listing Removed — HARMLS
- 2025-11-21 Listed $115,000 HARMLS
- 2025-10-28 Listed $115,000 HARMLS
- 2025-07-08 Pending — HARMLS
- 2025-05-27 Listing Removed — HARMLS
- 2025-05-27 Listing Removed — HARMLS
- 2025-03-12 Listing Removed — HARMLS
- 2025-03-12 Listed $125,000 HARMLS
- 2024-12-30 Listing Removed — HARMLS
- 2024-12-30 Listed $125,000 HARMLS
- 2024-05-30 Listing Removed — HARMLS
- 2024-05-30 Listed $125,000 HARMLS
- 2024-02-06 Listed $125,000 HARMLS
- 2022-01-16 Listing Removed — HARMLS
- 2021-10-14 Listed $125,000 HARMLS
- 2021-06-16 Sold (Public Records) — Public Records
Property tax history
-5.8%/yrLatest (2025): $1,410 · +19.9% YoY. Source: county tax records.
Cash-flow waterfall
monthlySold comps — $/sqft
last 12 mo · ≤1 miLoading sold comps…