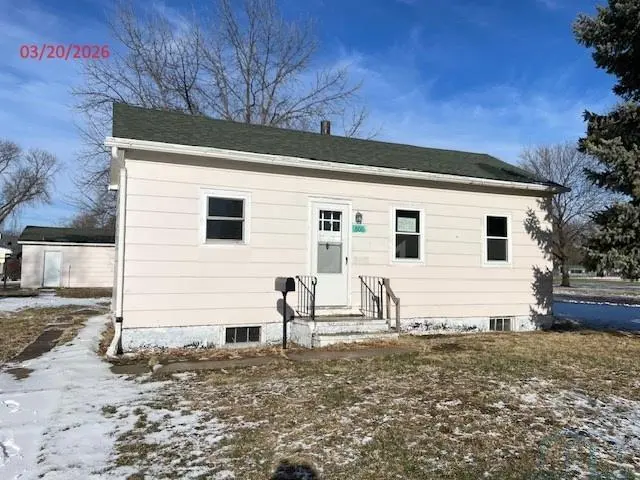
800 12th St · Onawa, IA
Flood risk 1/10 · Minimal
- FEMA flood zone
- X (unshaded)
- Chance of flooding over 30 yrs
- 0.0%
- Est. flood insurance / yr
- $473 – $860
Fire risk 1/10 · Minimal
- Est. fire insurance / yr
- $902 – $1,676
Heat risk 3/10 · Minor
- Hot days now (above 104°F)
- 7 days/yr
- Hot days in 30 yrs
- 15 days/yr
Wind risk 2/10 · Minimal
- Chance of severe wind over 30 yrs
- —
Air-quality risk 1/10 · Minimal
- Unhealthy air days now
- 0 days/yr
- Unhealthy air days in 30 yrs
- 0 days/yr
Risk factors via First Street. Map © Google.
Why this score? — see what drove the A- grade
The composite is a weighted blend of 9 inputs, each scored 0–100. Each bar is that input's sub-score; the figure is the points it added to the 100-point composite (weight × sub-score).
- Cash flow +30.0/30.0
- ARV discount +15.0/15.0
- DSCR +10.0/10.0
- 1% rule +9.3/10.0
- Appreciation +5.4/10.0
- Schools +5.2/10.0
- Livability +3.8/5.0
- Rent growth +2.5/5.0
- Condition / age +2.5/5.0
$65,000
🖨 Deal sheet (PDF) 📄 Offer letter ✓ Due diligence
Listing remarks
Nice one bedroom, 1 bath home in nice condition on a level corner lot. Inexpensive living or great investment property. Oversize one stall garage with plenty of room for a workshop and mowers or toys. All offers to be submitted on www. HUDHomestore. gov. Case # 161-423466
Key facts
- Room for a workshop
- Level corner lot
- 8,184 sq ft lot
Tags
Neighborhood map
What this means for you Summary
Snapshot
- This is a 1-bed/1.0-bath single-family listed at $65k.
Deal economics
- At list price, monthly cash flow is $305 ($4k/yr) — positive.
- The deal already cash-flows at list — no discount required.
- Meets the 1% rule at list price ($927 rent vs $65k).
- Recommended offer: $64k (1.5% below list) — sets the bar for market timing.
Location & tenants
- Location reads 75/100 on livability (#223 in IA, #4,208 nationally) — a middle-class / working-renter tenant base. Strengths: crime A+, cost of living A+, housing A+; Watch: amenities F, commute F, employment D-.
- West Monona Community School District (town): math 57% / reading 67% proficiency, ranked #240 of 289 in IA (top 83%) — acceptable for families but not a draw, mixed tenant base, ~2y average lease.
- Zoned schools: West Monona Elementary (math 52% / reading 72%, grade B, #363 of 616 statewide, top 62%, 325 students, 47% FRL); West Monona Middle Sch (math 62% / reading 62%, grade B+, #175 of 246 statewide, top 72%, 105 students, 43% FRL); West Monona High School (math 57% / reading 67%, grade B-, #242 of 336 statewide, top 76%, 204 students, 50% FRL).
- Market conditions: 23 active listings in the ZIP; 2 comparable units currently listed for rent nearby; 9 units permitted in Monona County in 2024 (0 in 5+ unit buildings).
Forward outlook
- In year one you build about $978 of equity ($449 loan paydown + $529 appreciation (0.8% local appreciation)).
- Monona County population projected at -12% by 2050 — secular population decline; favor cash flow + early exit over multi-decade hold.
- At projected returns (0.8% appreciation + 3.0% rent growth), your $18k cash investment doubles in ~4 years — after that, you're playing with house money.
Negotiation context
- It's been on market 21 days — a 2% lower offer ($64k) is reasonable based on typical stale-listing flexibility.
- 5 sale attempts since 11y ago with the ask held roughly flat each time — persistent listings suggest the price (not the market) is what's stuck; bring a comps-based counter.
Risks & watch-outs
- Watch-outs: built in 1920 — expect roof / HVAC / electrical / plumbing capex.
Questions for the listing agent
- Built in 1920 — when were the roof, HVAC, electrical panel, plumbing, and water heater last replaced?
- Is there a deadline driving the sale (1031 exchange, divorce, estate, relocation)? That informs how much negotiation room exists.
- What's the average days-on-market for RENTAL listings here right now (not sales)? A rising rental-DOM trend means longer vacancies and softer asking-rent achievability than the comps imply.
- What's the recent tenant-quality profile in this submarket — average credit score on applications, eviction rate, late-payment / NSF rate, and stable-employment percentage? A property-management company in the area should have these aggregated.
- How much new for-sale + rental construction is in the pipeline within 1–3 miles? Heavy new supply typically softens prices + rents 12–24 months out; constrained supply supports both.
Investment metrics
- 1% rule
- 1.43% ✓
- Cap rate
- 11.92%
- Cash-on-cash
- 20.09%
- DSCR
- 1.89
- GRM
- 5.8
CMA / ARV
- ARV (on-the-fly)
- $94,560
- Comps found
- 5
Show comp detail 5 sales within ~0.75 mi
| Address | Dist | Beds/Ba | Sqft | Sold | Price | $/sf | Match |
|---|---|---|---|---|---|---|---|
| 716 14th St | 0.14mi | 2/1.0 (+1) | 816 (+4%) | 9mo | $98,000 | $120 | 75 |
| 607 12th St | 0.17mi | 1/1.0 | 794 (+1%) | 22mo | $7,500 | $9 | 73 |
| 811 11th St | 0.10mi | 2/1.0 (+1) | 864 (+10%) | 20mo | $123,500 | $143 | 58 |
| 1107 6th St | 0.55mi | 2/1.0 (+1) | 842 (+7%) | 10mo | $107,000 | $127 | 50 |
| 1212 4th St | 0.70mi | 2/1.0 (+1) | 818 (+4%) | 16mo | $17,000 | $21 | 42 |
Match score weights: distance 35% · size 25% · config 20% · recency 20%. Top-matched comps best support the ARV.
Projected returns pro-forma
0.81% appreciation · 3.0% rent growth · sell at horizon
- IRR
- 21.8%
- Equity multiple
- 2.10×
- Total profit
- $20,030
- Equity at exit
- $21,561
- IRR
- 24.9%
- Equity multiple
- 3.96×
- Total profit
- $53,916
- Equity at exit
- $28,172
Cash invested: $18,200 (down + closing). Projections, not guarantees.
Landlord ↔ Tenant lean methodology
- Overall (STATE)
- 83 Strongly Landlord-Friendly
- State Iowa
- 83 Strongly Landlord-Friendly · R+6
- County
- — inherits STATE
- City
- — inherits STATE
ZIP-level market 51040
- Home prices YoY
- 0.4%
- Active inventory
- 23
- Price-to-rent
- 5.8×
Monthly cashflow live
- Estimated rent
- $927 medium interval (Pro) →
- Mortgage (P&I)
- −$341
- Tax from tax record
- −$60 /mo · $718/yr
- Insurance
- −$27
- HOA
- −$0
- Lot rent
- −$0
- Vacancy / Maint / Mgmt
- −$195
- Net cashflow
- $305
Break-even live
Sensitivity live
| Price | -10% $341 | -5% $323 | +0% $305 | +5% $286 | +10% $268 |
|---|---|---|---|---|---|
| Rent | -10% $231 | -5% $268 | +0% $305 | +5% $341 | +10% $378 |
| Rate | -1.0pp $337 | -0.5pp $321 | base $305 | +0.5pp $288 | +1.0pp $271 |
UW: 25.0% down · 7.5% · 30yr · 1.5% tax · 5.0% vac · 8.0% maint · 8.0% mgmt
Financing live
Cash to close
- Down payment
- $16,250
- Closing costs
- $1,950
- Reserves months
- —
- Total cash needed
- —
Loan-product check · same deal, 3 products live
Conventional
25% down · 7.5% · 30yr
- Down + closing
- —
- Monthly P&I
- —
- Monthly cashflow
- —
- DSCR
- —
- Eligible?
- —
Personal DTI + credit; lowest rate.
DSCR
20% down · 8.5% · 30yr
- Down + closing
- —
- Monthly P&I
- —
- Monthly cashflow
- —
- DSCR
- —
- Eligible?
- —
No personal income docs; deal must DSCR.
Hard money
10% down · 12.0% · 12mo
- Down + closing
- —
- Monthly P&I
- —
- Monthly cashflow
- —
- DSCR
- —
- Eligible?
- —
Short-term bridge; refi at stabilization.
Rent comps 2 comps
| Address | Beds | Baths | Sqft | Rent | $/sqft | DOM | Units | Dist |
|---|---|---|---|---|---|---|---|---|
| 800 Iowa Ave Unit 9 Onawa, IA | 1.0 | 1.0 | 528 | $975 | $1.85 | 46d | 1 | 0.30mi |
| 802 1st St Unit 3 Onawa, IA | 2.0 | 1.0 | 800 | $850 | $1.06 | 46d | 1 | 0.71mi |
Listing history 10 events
-
2026-04-15status Pending
-
2026-04-14status Active
-
2026-04-09status Pending
-
2026-03-20$65,000 Active
-
2024-11-04price $86,950
-
2024-07-22$102,500 Active
-
2023-04-05soldstatus $82,500
-
2023-03-30soldstatus $82,500 Closed
-
2022-11-07$84,900 Active
-
2015-06-21$47,500
ⓘ Source: listings_history table (triggers on properties + properties_extension) + one-shot
backfill from property_details.listing_events for pre-trigger history.
Tax reassessment forecast IA · Partial reset (capped growth)
- Current annual tax
- $718 · $60/mo
- Projected year-2 tax
- $869 · $72/mo
- Expected delta
- +$151/yr (+$13/mo · 21.1%)
ⓘ Screening estimate from a state-policy table — verify with the county assessor before closing.
Climate risk First Street
- Flood 1/10 Low FEMA zone X (unshaded) · 0% chance over 30 yrs
- Wildfire 1/10 Low
- Heat 3/10 Moderate 7 d/yr ≥104°F today · 15 d/yr by 30 yrs out
- Wind 2/10 Low
- Air quality 1/10 Low 0 unhealthy d/yr today · 0 by 30 yrs out
Nearby sold comps map
Loading sold comps map…
Walkable amenities ~0.75 mi
Loading nearby amenities…
Taxation est. · year 1
- Rental income
- $11,126
- − Mortgage interest
- −$3,641
- − Property taxes
- −$718
- − Insurance
- −$325
- − Repairs & maintenance
- −$890
- − Management
- −$890
- − Depreciation
- −$1,891
- Taxable income
- $2,771
- Est. tax owed @ 24.0%
- −$665
- After-tax cash flow
- $2,991/yr
For passive investors: Depreciation is non-cash, so a rental often shows a tax loss while cash-flowing — sheltering income. Rental losses are passive: they offset passive income freely, and up to $25,000/yr can offset ordinary (W-2) income if you actively participate and your MAGI is under $100k (phasing out to $0 by $150k); unused losses carry forward. On sale, claimed depreciation is recaptured at up to 25%, and gains may owe capital-gains tax (a 1031 exchange can defer both). Figures are a year-1 estimate at your 24.0% rate — not tax advice; consult a CPA.
Schools (NCES district)
- District
- West Monona Community School District
- NCES district ID
- 1931110
- Math proficiency
- 57% ▼ -1.00%
- Reading proficiency
- 67% ▲ 1.00%
- Median HH income
- $38,925
- Composite
- 51.64/100
- National rank
- #1697
- State rank
- #240 of 289 in IA
Livability — Onawa
- Score
- 75/100
- State rank
- #223
- US rank
- #4208
Category grades
Schools grade is shown separately in the Schools card above.
Census & demographics
- Census place
- Onawa, IA
- City population
- 3,388
- Population (ZIP)
- 3,388
Population outlook (Monona County) Hauer SSP2
- Today (2025)
- 8,622 people
- By 2030
- 8,419 · -2.4%
- By 2040
- 7,994 · -7.3%
- By 2050
- 7,586 · -12.0%
- By 2075
- 7,204 · -16.4%
- By 2100
- 6,612 · -23.3%
Race, ethnicity, and origin ACS 2023
- Neighborhood character
- Predominantly White (92%)
- Race & ethnicity
- White 92% Two or more races 6% Hispanic / Latino 2%
- Common ancestry
- Lithuanian 2% Portuguese 2% Romanian 1%
- Languages at home
- 98% English-only · Spanish 2%
Political lean MEDSL · Monona
- 2024 margin
- Solid R (+45.4) · D 26.8% · R 72.2% · Other 1.1%
- 2008→2024 swing
- -43.0pp toward R · 2008: -2.4pp · 2024: -45.4pp
- All cycles
- 2024: R+45.4 2020: R+38.9 2016: R+41.4 2012: R+9.7 2008: R+2.4
Not yet ingested
- Civics
- —
Market trends
- HPI YoY
- ▲ 0.81%
- Current HPI
- 217.2446
- Rent YoY
- —
- Metro
- —
- State GDP YoY
- ▲ 2.48%
- F500 in state
- 4
Industry mix (Fortune 500 HQ in IA)
| Industry | F500 HQs | Revenue |
|---|---|---|
| Financial Services | 1 | $16B |
|
||
| Retail / Convenience | 1 | $15B |
|
||
Price history
+36.8% since first listed10 events — show timeline
- 2026-04-15 Pending — NWIA
- 2026-04-14 Relisted — NWIA
- 2026-04-09 Pending — NWIA
- 2026-03-20 Listed $65,000 NWIA
- 2024-11-04 Price Changed $86,950 NWIA
- 2024-07-22 Listed $102,500 NWIA
- 2023-04-05 Sold (Public Records) $82,500 Public Records
- 2023-03-30 Sold (MLS) $82,500 NWIA
- 2022-11-07 Listed $84,900 NWIA
- 2015-06-21 Listed $47,500 SWIAR
Property tax history
+2.3%/yrLatest (2025): $718 · -0.3% YoY. Source: county tax records.
Cash-flow waterfall
monthlySold comps — $/sqft
last 12 mo · ≤1 miLoading sold comps…